Estimated zip code population in 2022: 13,282 Zip code population in 2010: 13,576 Zip code population in 2000: 13,301
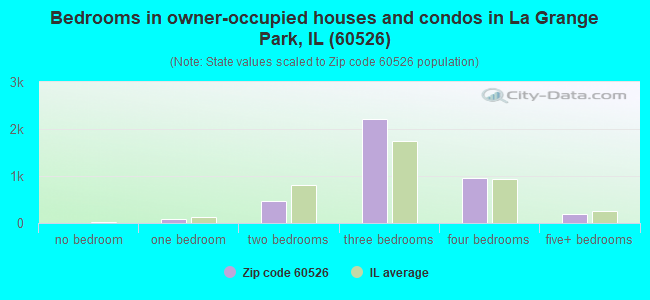
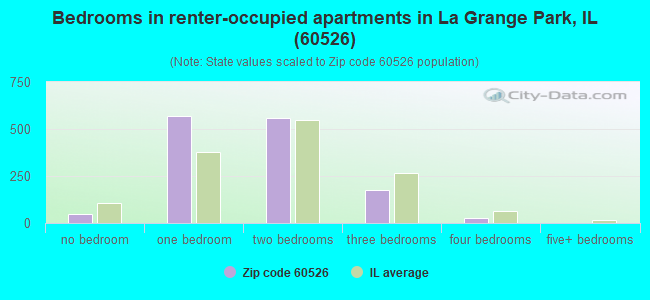
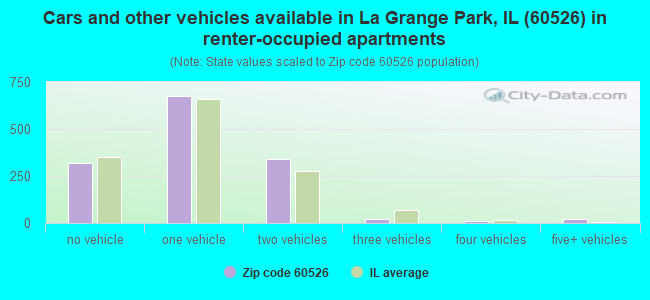
Houses and condos: 5,661 Renter-occupied apartments: 1,384
% of renters here:
26%
State:
33%
March 2022 cost of living index in zip code 60526: 101.3 (near average, U.S. average is 100)
Land area: 2.7 sq. mi. Water area: 0.0 sq. mi.
Population density: 4,837 people per square mile
(average).
OSM Map
General Map
Google Map
MSN Map
OSM Map
General Map
Google Map
MSN Map
OSM Map
General Map
Google Map
MSN Map
OSM Map
General Map
Google Map
MSN Map
Please wait while loading the map...
Real estate property taxes paid for housing units in 2022:
This zip code:
2.1% ($8,640)
Illinois:
2.0% ($4,912)
Median real estate property taxes paid for housing units with mortgages in 2022: $8,770 (2.0%) Median real estate property taxes paid for housing units with no mortgage in 2022: $8,143 (2.0%)
Business Search- 14 Million verified businesses
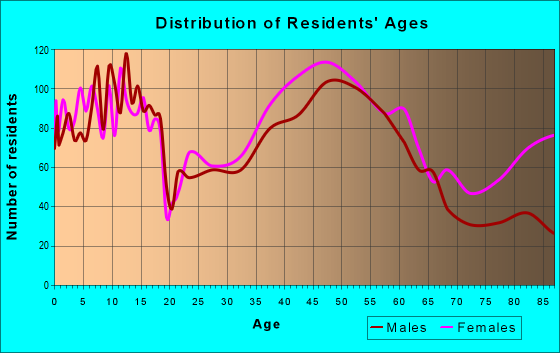
Males: 6,432
(48.4%)
Females: 6,850
(51.6%)
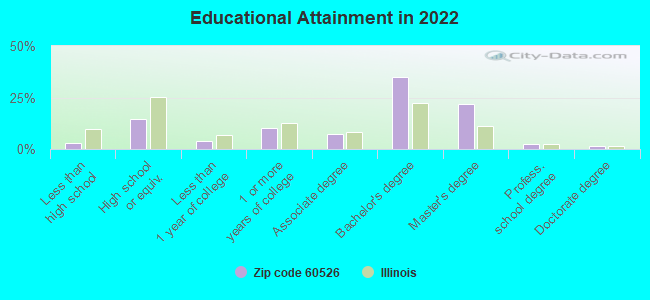
For population 25 years and over in 60526:
High school or higher: 98.3%
Bachelor's degree or higher: 61.5%
Graduate or professional degree: 26.2%
Unemployed: 3.0%
Mean travel time to work (commute): 29.9 minutes
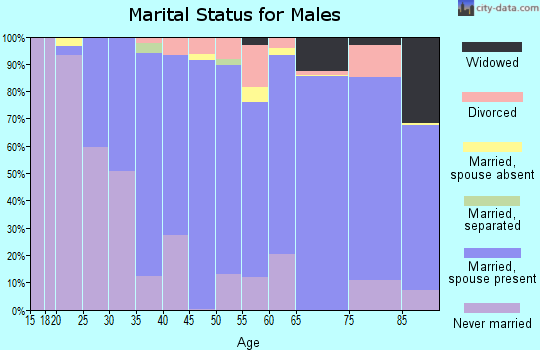
For population 15 years and over in 60526:
Never married: 27.1%
Now married: 56.9%
Separated: 0.7%
Widowed: 7.6%
Divorced: 7.7%
Zip code 60526 compared to state average:
Median house value above state average.
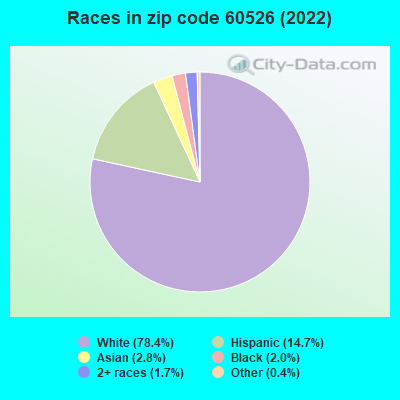
Black race population percentage significantly below state average.
Foreign-born population percentage below state average.
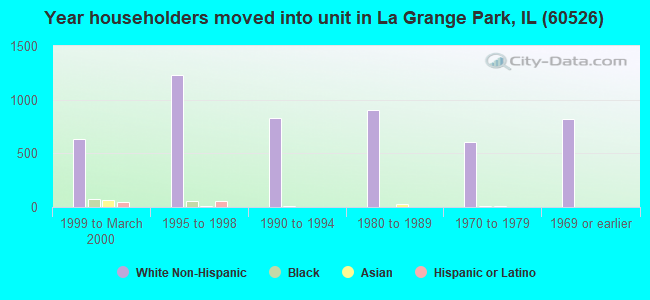
Length of stay since moving in significantly above state average.
Percentage of population with a bachelor's degree or higher above state average.
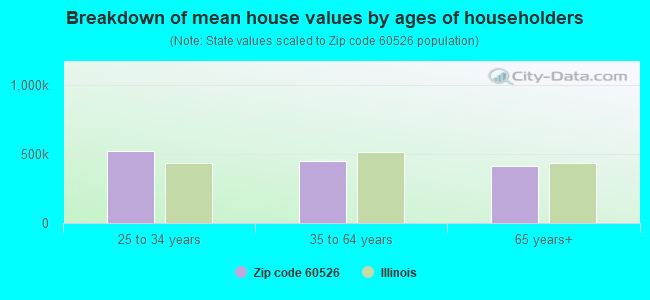
Estimated median house/condo value in 2022: $415,440
60526:
$415,440
Illinois:
$251,600
According to our research of Illinois and other state lists, there were 3 registered sex offenders living in 60526 zip code as of April 25, 2024. The ratio of all residents to sex offenders in zip code 60526 is 4,586 to 1. The ratio of registered sex offenders to all residents in this zip code is much lower than the state average.
Median resident age:
This zip code:
41.9 years
Illinois median age:
39.1 years
Average household size:
This zip code:
2.4 people
Illinois:
2.4 people
Averages for the 2020 tax year for zip code 60526, filed in 2021:
Average Adjusted Gross Income (AGI) in 2020: $107,677 (Individual Income Tax Returns)
Here:
$107,677
State:
$82,626
Salary/wage: $97,094 (reported on 77.3% of returns)
Here:
$97,094
State:
$66,640
(% of AGI for various income ranges: 1025.0% for AGIs below $25k, 3345.8% for AGIs $25k-50k, 5964.4% for AGIs $50k-75k, 8903.9% for AGIs $75k-100k, 17244.7% for AGIs $100k-200k, 72861.2% for AGIs over 200k)
Taxable interest for individuals: $1,963 (reported on 43.5% of returns)
This zip code:
$1,963
Illinois:
$2,376
(% of AGI for various income ranges: 38.3% for AGIs below $25k, 54.1% for AGIs $25k-50k, 110.3% for AGIs $50k-75k, 147.5% for AGIs $75k-100k, 216.7% for AGIs $100k-200k, 515.5% for AGIs over 200k)
Ordinary dividends: $7,859 (reported on 39.7% of returns)
Here:
$7,859
State:
$9,061
(% of AGI for various income ranges: 77.6% for AGIs below $25k, 158.3% for AGIs $25k-50k, 353.6% for AGIs $50k-75k, 444.1% for AGIs $75k-100k, 740.6% for AGIs $100k-200k, 2519.1% for AGIs over 200k)
Net capital gain/loss in AGI: +$14,893 (reported on 33.6% of returns)
Here:
+$14,893
State:
+$31,684
(% of AGI for various income ranges: 39.9% for AGIs below $25k, 68.1% for AGIs $25k-50k, 181.5% for AGIs $50k-75k, 247.5% for AGIs $75k-100k, 631.8% for AGIs $100k-200k, 7564.2% for AGIs over 200k)
Profit/loss from business: +$21,841 (reported on 14.4% of returns)
Here:
+$21,841
State:
+$12,175
(% of AGI for various income ranges: 127.8% for AGIs below $25k, 187.0% for AGIs $25k-50k, 171.7% for AGIs $50k-75k, 215.7% for AGIs $75k-100k, 591.9% for AGIs $100k-200k, 3377.9% for AGIs over 200k)
Taxable individual retirement arrangement distribution: $25,703 (reported on 15.0% of returns)
60526:
$25,703
Illinois:
$21,613
(% of AGI for various income ranges: 83.5% for AGIs below $25k, 247.5% for AGIs $25k-50k, 395.6% for AGIs $50k-75k, 638.4% for AGIs $75k-100k, 1134.7% for AGIs $100k-200k, 2399.4% for AGIs over 200k)
Self-employed (Keogh) retirement plans: $27,600 (reported on 1.0% of returns)
60526:
$27,600
Illinois:
$30,962
(% of AGI for various income ranges: 53.2% for AGIs $75k-100k, 514.5% for AGIs over 200k)
Total itemized deductions: $34,519 (reported on 18.1% of returns)
Here:
$34,519
State:
$34,948
(% of AGI for various income ranges: 159.8% for AGIs below $25k, 325.7% for AGIs $25k-50k, 688.3% for AGIs $50k-75k, 933.2% for AGIs $75k-100k, 1511.9% for AGIs $100k-200k, 4937.0% for AGIs over 200k)
Charity contributions: $7,191 (reported on 15.2% of returns)
Here:
$7,191
State:
$13,122
(% of AGI for various income ranges: 10.4% for AGIs below $25k, 28.7% for AGIs $25k-50k, 82.5% for AGIs $50k-75k, 97.3% for AGIs $75k-100k, 261.6% for AGIs $100k-200k, 1143.3% for AGIs over 200k)
Taxes paid: $8,574 (reported on 17.7% of returns)
60526:
$8,574
State:
$8,563
(% of AGI for various income ranges: 33.1% for AGIs below $25k, 83.0% for AGIs $25k-50k, 176.3% for AGIs $50k-75k, 268.0% for AGIs $75k-100k, 361.0% for AGIs $100k-200k, 1144.5% for AGIs over 200k)
Earned income credit: $2,007 (reported on 6.1% of returns)
Here:
$2,007
State:
$2,311
(% of AGI for various income ranges: 53.2% for AGIs below $25k, 33.1% for AGIs $25k-50k)
Percentage of individuals using paid preparers for their 2020 taxes: 91.1%
Here:
91%
State:
93%
(% for various income ranges: 89.3% for AGIs below $25k, 90.3% for AGIs $25k-50k, 90.8% for AGIs $50k-75k, 89.7% for AGIs $75k-100k, 92.9% for AGIs $100k-200k, 93.5% for AGIs over 200k)
Averages for the 2012 tax year for zip code 60526, filed in 2013:
Average Adjusted Gross Income (AGI) in 2012: $85,289 (Individual Income Tax Returns)
Here:
$85,289
State:
$68,058
Salary/wage: $75,112 (reported on 77.9% of returns)
Here:
$75,112
State:
$55,396
(% of AGI for various income ranges: 62.7% for AGIs below $25k, 70.2% for AGIs $25k-50k, 66.0% for AGIs $50k-75k, 70.9% for AGIs $75k-100k, 74.3% for AGIs $100k-200k, 63.8% for AGIs over 200k)
Taxable interest for individuals: $1,731 (reported on 49.7% of returns)
This zip code:
$1,731
Illinois:
$1,969
(% of AGI for various income ranges: 2.4% for AGIs below $25k, 1.5% for AGIs $25k-50k, 1.1% for AGIs $50k-75k, 1.1% for AGIs $75k-100k, 0.8% for AGIs $100k-200k, 0.9% for AGIs over 200k)
Ordinary dividends: $7,316 (reported on 40.9% of returns)
Here:
$7,316
State:
$7,786
(% of AGI for various income ranges: 5.5% for AGIs below $25k, 3.7% for AGIs $25k-50k, 3.9% for AGIs $50k-75k, 3.1% for AGIs $75k-100k, 3.1% for AGIs $100k-200k, 3.7% for AGIs over 200k)
Net capital gain/loss in AGI: +$11,196 (reported on 31.1% of returns)
Here:
+$11,196
State:
+$22,183
(% of AGI for various income ranges: 0.7% for AGIs $25k-50k, 1.0% for AGIs $50k-75k, 0.6% for AGIs $75k-100k, 1.7% for AGIs $100k-200k, 9.4% for AGIs over 200k)
Profit/loss from business: +$15,972 (reported on 14.2% of returns)
Here:
+$15,972
State:
+$12,903
(% of AGI for various income ranges: 6.7% for AGIs below $25k, 3.0% for AGIs $25k-50k, 2.8% for AGIs $50k-75k, 2.3% for AGIs $75k-100k, 2.8% for AGIs $100k-200k, 2.1% for AGIs over 200k)
Taxable individual retirement arrangement distribution: $18,099 (reported on 18.7% of returns)
60526:
$18,099
Illinois:
$17,929
(% of AGI for various income ranges: 8.0% for AGIs below $25k, 4.3% for AGIs $25k-50k, 5.0% for AGIs $50k-75k, 4.4% for AGIs $75k-100k, 4.0% for AGIs $100k-200k, 3.1% for AGIs over 200k)
Self-employment retirement plans: $21,300 (reported on 1.5% of returns)
60526:
$21,300
Illinois:
$24,666
Total itemized deductions: $26,485 (20% of AGI, reported on 51.4% of returns)
Here:
$26,485
State:
$26,433
Here:
19.7% of AGI
State:
19.2% of AGI
(% of AGI for various income ranges: 20.9% for AGIs below $25k, 14.6% for AGIs $25k-50k, 18.3% for AGIs $50k-75k, 18.1% for AGIs $75k-100k, 17.7% for AGIs $100k-200k, 12.8% for AGIs over 200k)
Charity contributions: $3,128 (reported on 45.8% of returns)
Here:
$3,128
State:
$4,525
(% of AGI for various income ranges: 1.3% for AGIs below $25k, 1.6% for AGIs $25k-50k, 1.8% for AGIs $50k-75k, 1.6% for AGIs $75k-100k, 1.7% for AGIs $100k-200k, 1.7% for AGIs over 200k)
Taxes paid: $12,481 (reported on 51.2% of returns)
60526:
$12,481
State:
$11,968
(% of AGI for various income ranges: 6.4% for AGIs below $25k, 5.1% for AGIs $25k-50k, 7.2% for AGIs $50k-75k, 8.2% for AGIs $75k-100k, 8.5% for AGIs $100k-200k, 7.1% for AGIs over 200k)
Earned income credit: $1,915 (reported on 7.3% of returns)
Here:
$1,915
State:
$2,349
(% of AGI for various income ranges: 3.3% for AGIs below $25k, 0.5% for AGIs $25k-50k)
Percentage of individuals using paid preparers for their 2012 taxes: 54.5%
Here:
55%
State:
57%
(% for various income ranges: 48.2% for AGIs below $25k, 49.2% for AGIs $25k-50k, 58.7% for AGIs $50k-75k, 58.0% for AGIs $75k-100k, 57.5% for AGIs $100k-200k, 70.4% for AGIs over 200k)
Averages for the 2004 tax year for zip code 60526, filed in 2005:
Average Adjusted Gross Income (AGI) in 2004: $61,813 (Individual Income Tax Returns)
Here:
$61,813
State:
$54,625
Salary/wage: $58,484 (reported on 75.4% of returns)
Here:
$58,484
State:
$46,811
(% of AGI for various income ranges: 100.5% for AGIs below $10k, 54.6% for AGIs $10k-25k, 67.4% for AGIs $25k-50k, 72.9% for AGIs $50k-75k, 74.5% for AGIs $75k-100k, 71.7% for AGIs over 100k)
Taxable interest for individuals: $2,685 (reported on 66.6% of returns)
This zip code:
$2,685
Illinois:
$2,101
(% of AGI for various income ranges: 14.3% for AGIs below $10k, 8.4% for AGIs $10k-25k, 3.7% for AGIs $25k-50k, 3.3% for AGIs $50k-75k, 2.9% for AGIs $75k-100k, 1.9% for AGIs over 100k)
Taxable dividends: $4,488 (reported on 47.4% of returns)
Here:
$4,488
State:
$4,306
(% of AGI for various income ranges: 12.6% for AGIs below $10k, 6.4% for AGIs $10k-25k, 4.6% for AGIs $25k-50k, 3.5% for AGIs $50k-75k, 2.8% for AGIs $75k-100k, 3.0% for AGIs over 100k)
Net capital gain/loss: +$7,973 (reported on 35.5% of returns)
Here:
+$7,973
State:
+$17,321
(% of AGI for various income ranges: -8.0% for AGIs below $10k, 0.0% for AGIs $10k-25k, 1.4% for AGIs $25k-50k, 1.0% for AGIs $50k-75k, 1.8% for AGIs $75k-100k, 8.0% for AGIs over 100k)
Profit/loss from business: +$16,061 (reported on 12.7% of returns)
Here:
+$16,061
State:
+$11,771
(% of AGI for various income ranges: 6.9% for AGIs below $10k, 5.2% for AGIs $10k-25k, 2.6% for AGIs $25k-50k, 2.0% for AGIs $50k-75k, 2.4% for AGIs $75k-100k, 3.9% for AGIs over 100k)
IRA payment deduction: $3,243 (reported on 3.0% of returns)
60526:
$3,243
Illinois:
$3,087
(% of AGI for various income ranges: 0.3% for AGIs $10k-25k, 0.4% for AGIs $25k-50k, 0.3% for AGIs $50k-75k, 0.1% for AGIs $75k-100k, 0.1% for AGIs over 100k)
Self-employed pension: $12,743 (reported on 1.8% of returns)
Here:
$12,743
Illinois:
$16,965
Total itemized deductions: $19,785 (20% of AGI, reported on 49.1% of returns)
Here:
$19,785
State:
$20,239
Here:
20.5% of AGI
State:
19.5% of AGI
(% of AGI for various income ranges: 31.5% for AGIs below $10k, 20.3% for AGIs $10k-25k, 16.4% for AGIs $25k-50k, 18.9% for AGIs $50k-75k, 17.5% for AGIs $75k-100k, 13.3% for AGIs over 100k)
Charity contributions deductions: $2,829 (3% of AGI, reported on 45.7% of returns)
Here:
$2,829
State:
$3,719
Here:
2.9% of AGI
State:
3.4% of AGI
(% of AGI for various income ranges: 1.5% for AGIs below $10k, 1.9% for AGIs $10k-25k, 2.2% for AGIs $25k-50k, 2.1% for AGIs $50k-75k, 2.3% for AGIs $75k-100k, 2.0% for AGIs over 100k)
Total tax: $9,940 (reported on 81.2% of returns)
60526:
$9,940
State:
$9,882
(% of AGI for various income ranges: 3.1% for AGIs below $10k, 4.3% for AGIs $10k-25k, 7.5% for AGIs $25k-50k, 9.2% for AGIs $50k-75k, 10.3% for AGIs $75k-100k, 17.4% for AGIs over 100k)
Earned income credit: $1,374 (reported on 4.7% of returns)
Here:
$1,374
State:
$1,788
Percentage of individuals using paid preparers for their 2004 taxes: 56.6%
Here:
57%
State:
61%
(% for various income ranges: 48.9% for AGIs below $10k, 58.7% for AGIs $10k-25k, 56.7% for AGIs $25k-50k, 59.7% for AGIs $50k-75k, 57.4% for AGIs $75k-100k, 59.4% for AGIs over 100k)
Household received Food Stamps/SNAP in the past 12 months: 216 Household did not receive Food Stamps/SNAP in the past 12 months: 5,002
Women who had a birth in the past 12 months: 121 (88 now married, 33 unmarried) Women who did not have a birth in the past 12 months: 2,828 (1,417 now married, 1,399 unmarried)
Housing units in zip code 60526 with a mortgage: 2,457 (402 second mortgage, 6 home equity loan, 283 both second mortgage and home equity loan) Houses without a mortgage: 102
Median monthly owner costs for units with a mortgage: $2,478 Median monthly owner costs for units without a mortgage: $1,002
Residents with income below the poverty level in 2022:
This zip code:
3.9%
Whole state:
11.9%
Residents with income below 50% of the poverty level in 2022:
This zip code:
1.6%
Whole state:
5.7%
Median number of rooms in houses and condos:
Here:
6.8
State:
6.4
Median number of rooms in apartments:
Here:
4.0
State:
4.1
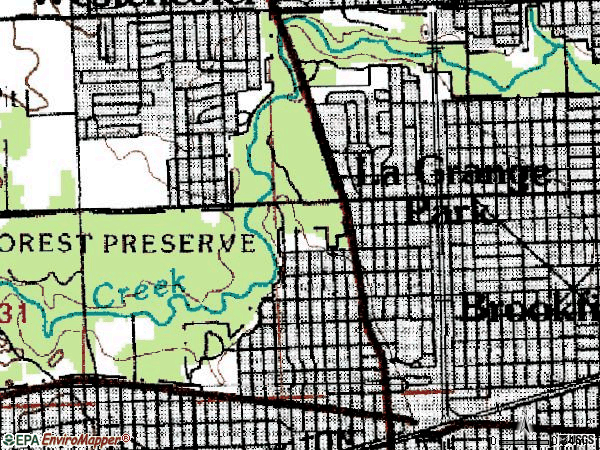
Notable locations in this zip code not listed on our city pages
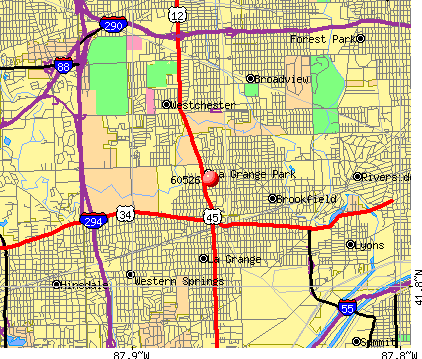
Notable locations in zip code 60526: La Grange Park Public Library (A), La Grange Park Village Hall (B), La Grange Park Fire Department Station 2 (C), La Grange Park Fire Department (D), La Grange Park Police Department (E), Bethlehem Center (F). Display/hide their locations on the map
Churches in zip code 60526 include: Saint Louis De Marillac Church (A), Saint Michael's Lutheran Church (B), Village United Church of Christ (C). Display/hide their locations on the map
Parks in zip code 60526 include: Northeast Park (1), Memorial Park (2), Salt Creek Woods Nature Preserve (3), Stone and Monroe Park (4), Hainesworth Park (5), Robin Hood Park (6). Display/hide their locations on the map
In group quarters: 340 (-1 institutionalized population)
Size of family households: 1,275 2-persons, 876 3-persons, 939 4-persons, 337 5-persons, 35 6-persons, 14 7-or-more-persons
Size of nonfamily households: 1,584 1-person, 209 2-persons
2,747 married couples with children.
530 single-parent households (28 men, 502 women).
85.3% of residents of 60526 zip code speak English at home.
7.4% of residents speak Spanish at home (94% very well, 2% well, 1% not well, 3% not at all).
5.4% of residents speak other Indo-European language at home (79% very well, 16% well, 5% not well).
1.8% of residents speak Asian or Pacific Island language at home (65% very well, 29% well, 6% not well).
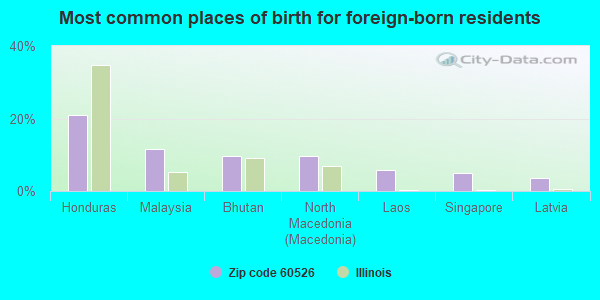
Foreign born population: 955 (7.2%) (62.7% of them are naturalized citizens)
This zip code:
7.2%
Whole state:
14.4%
21%Honduras
12%Malaysia
10%Bhutan
10%North Macedonia (Macedonia)
6%Laos
5%Singapore
3%Latvia
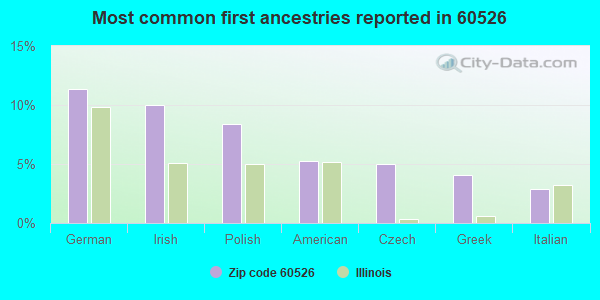
11%German
10%Irish
8%Polish
5%American
5%Czech
4%Greek
3%Italian
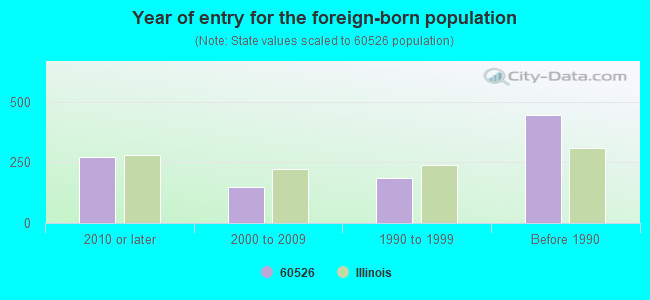
Year of entry for the foreign-born population
2722010 or later
1472000 to 2009
1841990 to 1999
446Before 1990
Major facilities with environmental interests located in this zip code:
LA GRANGE PARK (447 N CATHERINE AVE in LAGRANGE PARK, IL)
STATE MASTER (Illinois EPA Project) - HAZARDOUS WASTE PROGRAM, National Pollutant Discharge Elimination System Permit STATE MASTER (Illinois EPA Project) - DRINKING WATER PROGRAM National Pollutant Discharge Elimination System NON-MAJOR (Tracking pollutant discharge elimination systems) - permit Small Quantity Generators, between 100 kg and 1000 kg of hazardous waste/month (Resource Conservation and Recovery Act (tracking hazardous waste)) - notification Business SIC classification: NONCLASSIFIABLE ESTABLISHMENTS Organizations: LAGRANGE PARK VILLAGE OF (CONTACT/OWNER)
Alternative names: LAGRANGE PARK CSOS, LAGRANGE PARK CSOS, VILLAGE OF, LAGRANGE PARK VILLAGE OF
LIQUID CARBONIC SPECIALTY GAS CORP (26TH AND BEACH in LA GRANGE PARK, IL)
STATE MASTER (Illinois EPA Project) - AIR PROGRAM, SOLID WASTE PROGRAM AIR MINOR (AIRS/AFS) Conditionally Exempt Small Quantity Generators, less than 100 kg/month of hazardous waste (Resource Conservation and Recovery Act (tracking hazardous waste)) - notification TRI REPORTER (Tracking of toxic chemicals releasing facilities) Business SIC classification: INDUSTRIAL GASES Organizations: LIQUID CARBONIC CORP (CONTACT/OWNER)
Alternative names: LIQUID CARBONIC IND. CORP.
JP KORRIS INC (1245 BARNSDALE ROAD in LAGRANGE PARK, IL)
STATE MASTER (Illinois EPA Project) - AIR PROGRAM, SOLID WASTE PROGRAM AIR MINOR (AIRS/AFS) CRITERIA AND HAZARDOUS AIR POLLUTANT INVENTORY (Inventory of air pollution sources) Business SIC classification: PLASTICS PRODUCTS Alternative names: J P KORRIS INCORPORATED
LAGRANGE PARK ONE HOUR CLEANERS (1009 EAST 31ST STREET in LA GRANGE PARK, IL)
STATE MASTER (Illinois EPA Project) - HAZARDOUS WASTE PROGRAM, AIR PROGRAM AIR MINOR (AIRS/AFS) Small Quantity Generators, between 100 kg and 1000 kg of hazardous waste/month (Resource Conservation and Recovery Act (tracking hazardous waste)) - notification Business SIC classification: DRYCLEANING PLANTS, EXCEPT RUG CLEANING Organizations: LAGRANGE PARK 1 HR CLEANERS (CONTACT/OWNER)
Alternative names: LAGRANGE PARK 1 HR CLEANERS
JOSEPH WEIL & SONS INC (825 EAST 26TH STREET in LA GRANGE PARK, IL)
AIR MINOR (AIRS/AFS) CRITERIA AND HAZARDOUS AIR POLLUTANT INVENTORY (Inventory of air pollution sources) Small Quantity Generators, between 100 kg and 1000 kg of hazardous waste/month (Resource Conservation and Recovery Act (tracking hazardous waste)) - notification Business SIC classification: INDUSTRIAL AND PERSONAL SERVICE PAPER Organizations: WEIL JOSEPH AND SONS (CONTACT/OWNER)
Alternative names: WEIL JOSEPH AND SONS INC
MUSSER DIV LUDWIG INDUSTRIES (1100 E 31ST ST in LA GRANGE PARK, IL)
STATE MASTER (Illinois EPA Project) - AIR PROGRAM AIR MINOR (AIRS/AFS) Business SIC classification: MUSICAL INSTRUMENTS
PLYMOUTH PLACE INC (315 N LA GRANGE RD in LA GRANGE PARK, IL)
STATE MASTER (Illinois EPA Project) - AIR PROGRAM, SOLID WASTE PROGRAM AIR MINOR (AIRS/AFS) Business SIC classification: NONCLASSIFIABLE ESTABLISHMENTS
JEWEL FOOD STORES, INC. #3265 (507 WOODLAWN in LAGRANGE PARK, IL)
AIR MINOR (AIRS/AFS) - ICIS-05-2003-0340, ENFORCEMENT/COMPLIANCE ACTIVITY Business SIC classification: GROCERY STORES
MURPHYS TRANSMISSION (1117 E 31ST ST in LA GRANGE PARK, IL)
STATE MASTER (Illinois EPA Project) - SOLID WASTE PROGRAM, HAZARDOUS WASTE PROGRAM Small Quantity Generators, between 100 kg and 1000 kg of hazardous waste/month (Resource Conservation and Recovery Act (tracking hazardous waste)) - notification
INLAND ELECTRIC (340 S WASHINGTON in LA GRANGE PARK, IL)
HOMESTEAD APARTMENTS (443 SHERWOOD ROAD in LAGRANGE PARK, IL)
ENFORCEMENT/COMPLIANCE ACTIVITY (Integrated Compliance Information System) COMPLIANCE ACTIVITY (Tracking inspections of insecticide, fungicide, and rodenticide, and toxic substances)
LAGRANGE SD #102 (333 N PARK ROAD in LA GRANGE PARK, IL)
COMPLIANCE ACTIVITY (Tracking inspections of insecticide, fungicide, and rodenticide, and toxic substances)
Housing units lacking complete plumbing facilities: 0.3% Housing units lacking complete kitchen facilities: 1.0%
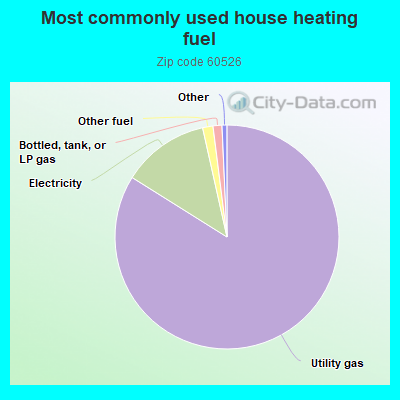
84.0%Utility gas
12.6%Electricity
1.5%Other fuel
1.3%Bottled, tank, or LP gas
Place of birth for U.S.-born residents:
This state: 10,466
Northeast: 339
Midwest: 768
South: 271
West: 367
67% of the 60526 zip code residents lived in the same house 5 years ago. Out of people who lived in different houses, 73% lived in this county. Out of people who lived in different counties, 50% lived in Illinois.
87% of the 60526 zip code residents lived in the same house 1 year ago. Out of people who lived in different houses, 65% moved from this county. Out of people who lived in different houses, 11% moved from different county within same state. Out of people who lived in different houses, 14% moved from different state. Out of people who lived in different houses, 9% moved from abroad.
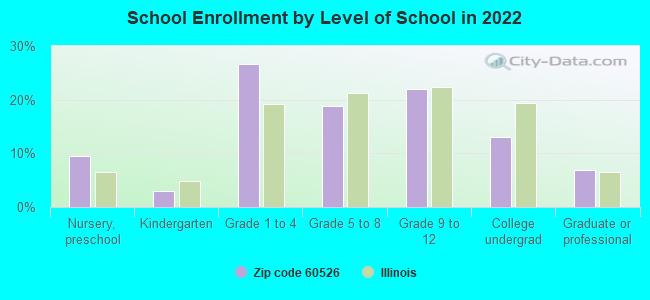
Private vs. public school enrollment:
Students in private schools in grades 1 to 8 (elementary and middle school): 182
Here:
10.7%
Illinois:
13.3%
Students in private schools in grades 9 to 12 (high school): 24
Here:
3.0%
Illinois:
9.9%
Students in private undergraduate colleges: 190
Here:
38.8%
Illinois:
27.4%
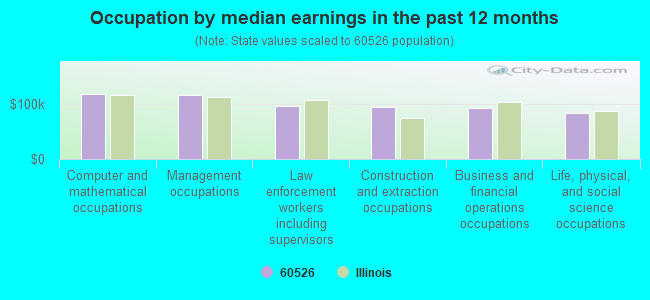
Occupation by median earnings in the past 12 months ($)
118,501Computer and mathematical occupations
116,959Management occupations
96,012Law enforcement workers including supervisors
95,012Construction and extraction occupations
93,289Business and financial operations occupations
82,834Life, physical, and social science occupations
Companies with federal contracts located in this zip code:
CHEMGROUT, INC (805 E 31ST STREET in LA GRANGE PARK, IL; small business) : $44,915 in 3 contractsfrom 2002 to 2006
$26,400 with Army for Clay and Concrete Products Industries Machinery. Signed on 2002-03-13. Completion date: 2002-04-11.
$18,695 with Navy for Miscellaneous Construction Equipment. Signed on 2006-02-09. Completion date: 2006-03-10.
-$180, same as above.Signed on 2006-03-29. Completion date: 2006-03-30.
AVON GEAR & ENGINEERING CO (18 NEWBERRY AVE in LA GRANGE PARK, IL; small business)
$2,887 with Navy for Gears, Pulleys, Sprockets, and Transmission Chain. Signed on 2005-11-22. Completion date: 2006-02-14.
Top industries in this zip code by the number of employees in 2005:
Administrative and Support and Waste Management and Remediation Services: Temporary Help Services (500-999 employees: 1 establishment)
Health Care and Social Assistance: Continuing Care Retirement Communities (100-249: 1)
Construction: All Other Specialty Trade Contractors (100-249: 1)
2002 - 2018 National Fire Incident Reporting System (NFIRS) incidents
According to the data from the years 2002 - 2018 the average number of fire incidents per year is 40. The highest number of reported fires - 67 took place in 2009, and the least - 17 in 2013. The data has a decreasing trend.
When looking into fire subcategories, the most incidents belonged to: Structure Fires (63.7%), and Outside Fires (22.2%).
Fire incident types reported to NFIRS in Zip Code 60526


 Nearest zip codes: 60154, 60513, 60155, 60558, 60141, 60162.
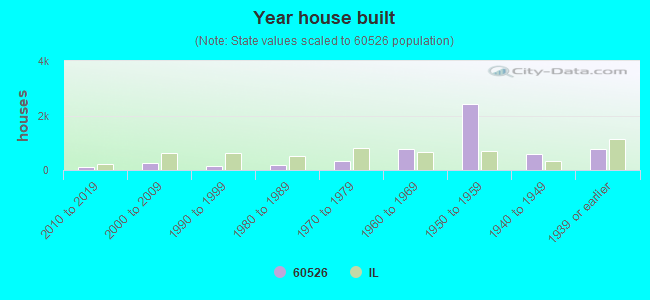


 According to the data from the years 2002 - 2018 the average number of fire incidents per year is 40. The highest number of reported fires - 67 took place in 2009, and the least - 17 in 2013. The data has a decreasing trend.
 When looking into fire subcategories, the most incidents belonged to: Structure Fires (63.7%), and Outside Fires (22.2%).