Estimated zip code population in 2022: 1,160 Zip code population in 2010: 1,440 Zip code population in 2000: 1,445
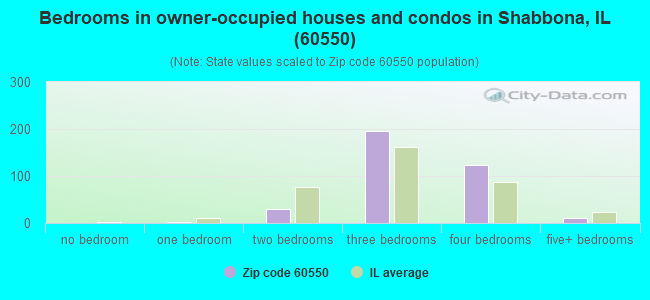
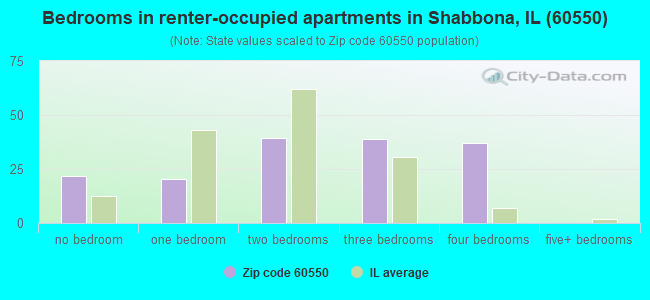
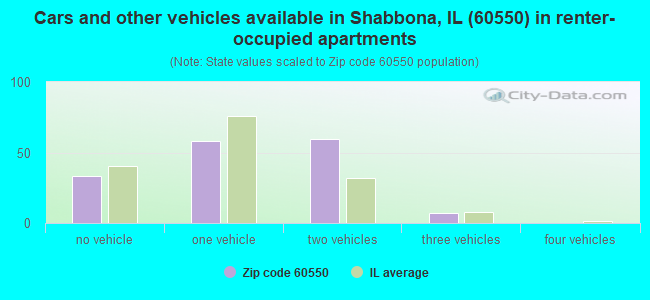
Houses and condos: 566 Renter-occupied apartments: 159
% of renters here:
31%
State:
33%
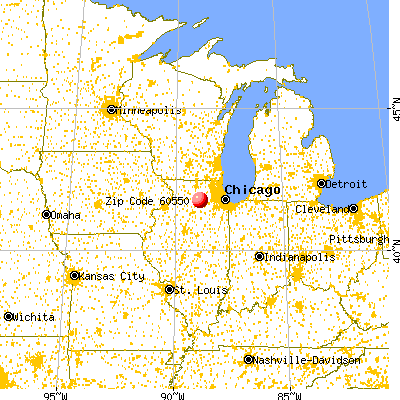
March 2022 cost of living index in zip code 60550: 93.0 (less than average, U.S. average is 100)
Land area: 44.5 sq. mi. Water area: 0.6 sq. mi.
Population density: 26 people per square mile
(very low).
OSM Map
General Map
Google Map
MSN Map
OSM Map
General Map
Google Map
MSN Map
OSM Map
General Map
Google Map
MSN Map
OSM Map
General Map
Google Map
MSN Map
Please wait while loading the map...
Real estate property taxes paid for housing units in 2022:
This zip code:
2.0% ($4,227)
Illinois:
2.0% ($4,912)
Median real estate property taxes paid for housing units with mortgages in 2022: $4,086 (2.0%) Median real estate property taxes paid for housing units with no mortgage in 2022: $4,383 (2.0%)
Business Search- 14 Million verified businesses
Males: 516
(44.5%)
Females: 644
(55.5%)
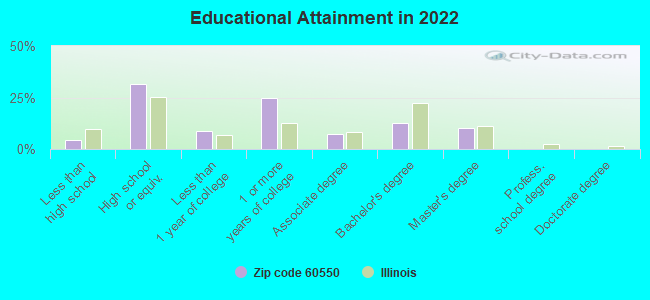
For population 25 years and over in 60550:
High school or higher: 94.3%
Bachelor's degree or higher: 23.0%
Graduate or professional degree: 10.2%
Unemployed: 2.9%
Mean travel time to work (commute): 22.9 minutes
For population 15 years and over in 60550:
Never married: 21.2%
Now married: 50.5%
Separated: 1.6%
Widowed: 16.6%
Divorced: 10.1%
Zip code 60550 compared to state average:
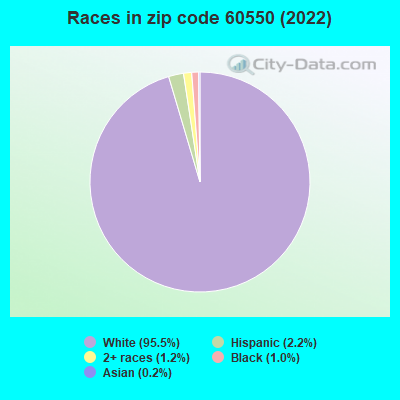
Black race population percentage significantly below state average.
Hispanic race population percentage significantly below state average.
Median age significantly above state average.
Foreign-born population percentage significantly below state average.
Number of rooms per house above state average.
Percentage of population with a bachelor's degree or higher below state average.
Averages for the 2020 tax year for zip code 60550, filed in 2021:
Average Adjusted Gross Income (AGI) in 2020: $68,153 (Individual Income Tax Returns)
Here:
$68,153
State:
$82,626
Salary/wage: $52,021 (reported on 81.4% of returns)
Here:
$52,021
State:
$66,640
(% of AGI for various income ranges: 1020.9% for AGIs below $25k, 3646.0% for AGIs $25k-50k, 5607.1% for AGIs $50k-75k, 9112.0% for AGIs $75k-100k, 16742.9% for AGIs $100k-200k)
Taxable interest for individuals: $1,156 (reported on 42.4% of returns)
This zip code:
$1,156
Illinois:
$2,376
(% of AGI for various income ranges: 11.8% for AGIs below $25k, 16.0% for AGIs $25k-50k, 27.1% for AGIs $50k-75k, 74.0% for AGIs $75k-100k, 124.3% for AGIs $100k-200k)
Ordinary dividends: $2,982 (reported on 18.6% of returns)
Here:
$2,982
State:
$9,061
(% of AGI for various income ranges: 21.8% for AGIs below $25k, 45.7% for AGIs $50k-75k, 388.6% for AGIs $100k-200k)
Net capital gain/loss in AGI: +$14,482 (reported on 18.6% of returns)
Here:
+$14,482
State:
+$31,684
(% of AGI for various income ranges: 4.5% for AGIs below $25k, 390.0% for AGIs $50k-75k, 1878.6% for AGIs $100k-200k)
Profit/loss from business: +$15,750 (reported on 13.6% of returns)
Here:
+$15,750
State:
+$12,175
(% of AGI for various income ranges: 92.7% for AGIs below $25k, 426.0% for AGIs $25k-50k, 1464.0% for AGIs $75k-100k)
Taxable individual retirement arrangement distribution: $15,220 (reported on 8.5% of returns)
60550:
$15,220
Illinois:
$21,613
(% of AGI for various income ranges: 315.0% for AGIs $25k-50k, 637.1% for AGIs $100k-200k)
Total itemized deductions: $31,350 (reported on 3.4% of returns)
Here:
$31,350
State:
$34,948
(% of AGI for various income ranges: 627.0% for AGIs $25k-50k)
Taxes paid: $6,900 (reported on 3.4% of returns)
60550:
$6,900
State:
$8,563
(% of AGI for various income ranges: 138.0% for AGIs $25k-50k)
Earned income credit: $2,317 (reported on 10.2% of returns)
Here:
$2,317
State:
$2,311
(% of AGI for various income ranges: 76.4% for AGIs below $25k, 55.0% for AGIs $25k-50k)
Percentage of individuals using paid preparers for their 2020 taxes: 94.9%
Here:
95%
State:
93%
(% for various income ranges: 93.8% for AGIs below $25k, 92.9% for AGIs $25k-50k, 100.0% for AGIs $50k-75k, 100.0% for AGIs $75k-100k, 90.9% for AGIs $100k-200k, 100.0% for AGIs over 200k)
Averages for the 2012 tax year for zip code 60550, filed in 2013:
Average Adjusted Gross Income (AGI) in 2012: $62,386 (Individual Income Tax Returns)
Here:
$62,386
State:
$68,058
Salary/wage: $41,350 (reported on 84.4% of returns)
Here:
$41,350
State:
$55,396
(% of AGI for various income ranges: 69.8% for AGIs below $25k, 74.7% for AGIs $25k-50k, 72.6% for AGIs $50k-75k, 76.7% for AGIs $75k-100k, 37.5% for AGIs $100k-200k)
Taxable interest for individuals: $1,411 (reported on 43.8% of returns)
This zip code:
$1,411
Illinois:
$1,969
(% of AGI for various income ranges: 2.1% for AGIs below $25k, 0.6% for AGIs $25k-50k, 0.4% for AGIs $50k-75k, 0.2% for AGIs $75k-100k, 1.3% for AGIs $100k-200k)
Ordinary dividends: $2,673 (reported on 23.4% of returns)
Here:
$2,673
State:
$7,786
(% of AGI for various income ranges: 1.2% for AGIs below $25k, 2.1% for AGIs $25k-50k, 1.0% for AGIs $75k-100k, 1.0% for AGIs $100k-200k)
Net capital gain/loss in AGI: +$10,920 (reported on 15.6% of returns)
Here:
+$10,920
State:
+$22,183
(% of AGI for various income ranges: 5.7% for AGIs $100k-200k)
Profit/loss from business: +$9,729 (reported on 10.9% of returns)
Here:
+$9,729
State:
+$12,903
(% of AGI for various income ranges: 3.8% for AGIs below $25k, 7.3% for AGIs $25k-50k, 3.4% for AGIs $75k-100k)
Taxable individual retirement arrangement distribution: $11,656 (reported on 14.1% of returns)
60550:
$11,656
Illinois:
$17,929
(% of AGI for various income ranges: 6.5% for AGIs below $25k, 4.3% for AGIs $50k-75k, 3.0% for AGIs $100k-200k)
Total itemized deductions: $17,980 (18% of AGI, reported on 39.1% of returns)
Here:
$17,980
State:
$26,433
Here:
18.0% of AGI
State:
19.2% of AGI
(% of AGI for various income ranges: 14.0% for AGIs below $25k, 10.2% for AGIs $25k-50k, 15.2% for AGIs $50k-75k, 13.0% for AGIs $75k-100k, 9.4% for AGIs $100k-200k)
Charity contributions: $2,411 (reported on 28.1% of returns)
Here:
$2,411
State:
$4,525
(% of AGI for various income ranges: 0.9% for AGIs $25k-50k, 1.4% for AGIs $50k-75k, 1.4% for AGIs $75k-100k, 1.1% for AGIs $100k-200k)
Taxes paid: $7,852 (reported on 39.1% of returns)
60550:
$7,852
State:
$11,968
(% of AGI for various income ranges: 3.4% for AGIs below $25k, 3.8% for AGIs $25k-50k, 6.2% for AGIs $50k-75k, 5.1% for AGIs $75k-100k, 5.0% for AGIs $100k-200k)
Earned income credit: $1,912 (reported on 12.5% of returns)
Here:
$1,912
State:
$2,349
(% of AGI for various income ranges: 3.9% for AGIs below $25k, 0.8% for AGIs $25k-50k)
Percentage of individuals using paid preparers for their 2012 taxes: 68.8%
Here:
69%
State:
57%
(% for various income ranges: 62.5% for AGIs below $25k, 69.2% for AGIs $25k-50k, 70.0% for AGIs $50k-75k, 71.4% for AGIs $75k-100k, 80.0% for AGIs $100k-200k)
Averages for the 2004 tax year for zip code 60550, filed in 2005:
Average Adjusted Gross Income (AGI) in 2004: $44,797 (Individual Income Tax Returns)
Here:
$44,797
State:
$54,625
Salary/wage: $38,073 (reported on 82.6% of returns)
Here:
$38,073
State:
$46,811
(% of AGI for various income ranges: 458.9% for AGIs below $10k, 65.4% for AGIs $10k-25k, 75.5% for AGIs $25k-50k, 81.0% for AGIs $50k-75k, 81.2% for AGIs $75k-100k, 47.4% for AGIs over 100k)
Taxable interest for individuals: $2,224 (reported on 51.6% of returns)
This zip code:
$2,224
Illinois:
$2,101
(% of AGI for various income ranges: 45.7% for AGIs below $10k, 4.7% for AGIs $10k-25k, 2.4% for AGIs $25k-50k, 0.8% for AGIs $50k-75k, 1.2% for AGIs $75k-100k, 3.6% for AGIs over 100k)
Taxable dividends: $3,278 (reported on 26.3% of returns)
Here:
$3,278
State:
$4,306
(% of AGI for various income ranges: 23.2% for AGIs below $10k, 0.7% for AGIs $10k-25k, 1.3% for AGIs $25k-50k, 0.2% for AGIs $50k-75k, 0.9% for AGIs $75k-100k, 4.2% for AGIs over 100k)
Net capital gain/loss: +$9,078 (reported on 20.6% of returns)
Here:
+$9,078
State:
+$17,321
(% of AGI for various income ranges: 20.5% for AGIs below $10k, -0.0% for AGIs $10k-25k, -0.5% for AGIs $25k-50k, -0.1% for AGIs $50k-75k, 0.2% for AGIs $75k-100k, 13.3% for AGIs over 100k)
Profit/loss from business: +$6,901 (reported on 11.8% of returns)
Here:
+$6,901
State:
+$11,771
(% of AGI for various income ranges: -74.2% for AGIs below $10k, 4.9% for AGIs $10k-25k, 5.6% for AGIs $25k-50k, 1.8% for AGIs $50k-75k, 1.0% for AGIs over 100k)
Profit/loss from farming: +$5,314 (reported on 5.1% of returns)
Here:
+$5,314
State:
+$2,327
IRA payment deduction: $2,421 (reported on 2.8% of returns)
60550:
$2,421
Illinois:
$3,087
Total itemized deductions: $15,657 (20% of AGI, reported on 35.8% of returns)
Here:
$15,657
State:
$20,239
Here:
20.4% of AGI
State:
19.5% of AGI
(% of AGI for various income ranges: 16.9% for AGIs $10k-25k, 10.6% for AGIs $25k-50k, 16.6% for AGIs $50k-75k, 15.8% for AGIs $75k-100k, 8.0% for AGIs over 100k)
Charity contributions deductions: $2,258 (3% of AGI, reported on 28.9% of returns)
Here:
$2,258
State:
$3,719
Here:
2.7% of AGI
State:
3.4% of AGI
(% of AGI for various income ranges: 0.9% for AGIs $10k-25k, 0.9% for AGIs $25k-50k, 0.7% for AGIs $50k-75k, 2.2% for AGIs $75k-100k, 2.2% for AGIs over 100k)
Total tax: $6,831 (reported on 77.0% of returns)
60550:
$6,831
State:
$9,882
(% of AGI for various income ranges: 31.8% for AGIs below $10k, 4.7% for AGIs $10k-25k, 7.8% for AGIs $25k-50k, 8.6% for AGIs $50k-75k, 9.4% for AGIs $75k-100k, 19.3% for AGIs over 100k)
Earned income credit: $1,449 (reported on 7.2% of returns)
Here:
$1,449
State:
$1,788
Percentage of individuals using paid preparers for their 2004 taxes: 64.6%
Here:
65%
State:
61%
(% for various income ranges: 59.5% for AGIs below $10k, 57.9% for AGIs $10k-25k, 66.3% for AGIs $25k-50k, 59.8% for AGIs $50k-75k, 78.7% for AGIs $75k-100k, 86.3% for AGIs over 100k)
Likely homosexual households (counted as self-reported same-sex unmarried-partner households)
Lesbian couples: 0.3% of all households
Gay men: 0.0% of all households
Household received Food Stamps/SNAP in the past 12 months: 48 Household did not receive Food Stamps/SNAP in the past 12 months: 469
Women who had a birth in the past 12 months: 9 (9 now married, 0 unmarried) Women who did not have a birth in the past 12 months: 173 (76 now married, 96 unmarried)
Housing units in zip code 60550 with a mortgage: 208 (6 second mortgage, 6 both second mortgage and home equity loan) Houses without a mortgage: 4
Median monthly owner costs for units with a mortgage: $1,639 Median monthly owner costs for units without a mortgage: $804
Residents with income below the poverty level in 2022:
This zip code:
5.2%
Whole state:
11.9%
Residents with income below 50% of the poverty level in 2022:
This zip code:
1.5%
Whole state:
5.7%
Median number of rooms in houses and condos:
Here:
7.2
State:
6.4
Median number of rooms in apartments:
Here:
5.2
State:
4.1
Notable locations in this zip code not listed on our city pages
Notable locations in zip code 60550: Shabbona Grove Picnic Area (A), Sommonauk Point Picnic Area (B), Three Fires Picnic Area (C), Chief Shabbona Historical Site (D), Indian Oaks Country Club (E), Timber Edge Farm (F), Shabbona Volunteer Fire Department (G). Display/hide their locations on the map
In group quarters: 71 (-1 institutionalized population)
Size of family households: 169 2-persons, 27 3-persons, 36 4-persons, 59 5-persons
Size of nonfamily households: 208 1-person, 15 2-persons, 2 3-persons
158 married couples with children.
27 single-parent households (8 men, 19 women).
95.3% of residents of 60550 zip code speak English at home.
1.4% of residents speak Spanish at home (100% very well).
3.3% of residents speak other Indo-European language at home (100% very well).
0.3% of residents speak Asian or Pacific Island language at home (100% very well).
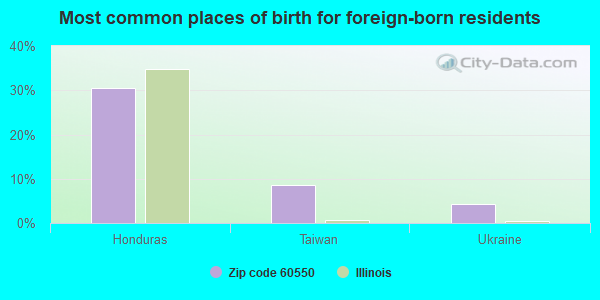
Foreign born population: 23 (2.0%) (35.0% of them are naturalized citizens)
This zip code:
2.0%
Whole state:
14.4%
30%Honduras
9%Taiwan
4%Ukraine
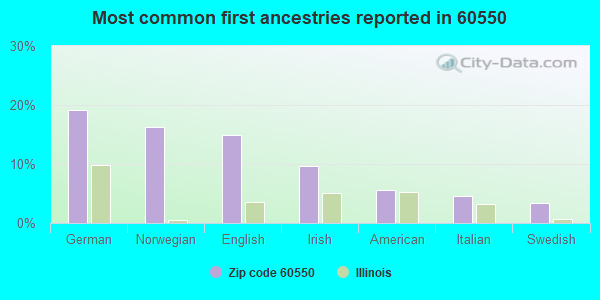
19%German
16%Norwegian
15%English
10%Irish
6%American
5%Italian
3%Swedish
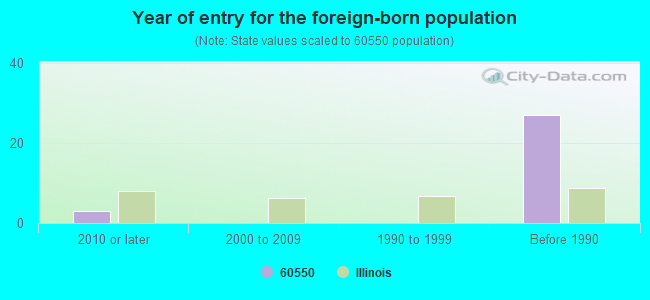
Year of entry for the foreign-born population
32010 or later
02000 to 2009
01990 to 1999
27Before 1990
Facilities with environmental interests located in this zip code:
MULLINS GRAIN CO (217 N. SHABBONA RD. in SHABBONA, IL)
STATE MASTER (Illinois EPA Project) - SOLID WASTE PROGRAM, AIR PROGRAM AIR MINOR (AIRS/AFS) CRITERIA AND HAZARDOUS AIR POLLUTANT INVENTORY (Inventory of air pollution sources) Business SIC classification: GRAIN AND FIELD BEANS
INDIAN CREEK HIGH SCHOOL (506 SHABBONA RD in SHABBONA, IL)
(Geographic Names Information System) (National Center for Education Statistics) - STATE ID-1601942500001 Organizations: INDIAN CREEK COMM UNIT DIST 425 (SCHOOL DISTRICT)
AMOCO FERTILIZER PLANT (RTE 30 E in SHABBONA, IL)
(Resource Conservation and Recovery Act (tracking hazardous waste))
INDIAN CREEK S.D. #425 (506 S. SHABBONA RD in SHABBONA, IL)
COMPLIANCE ACTIVITY (Tracking inspections of insecticide, fungicide, and rodenticide, and toxic substances)
CROPMATE FERTILIZER CO (RT 30 E & INDIAN RD in SHABBONA, IL)
COMPLIANCE ACTIVITY (Tracking inspections of insecticide, fungicide, and rodenticide, and toxic substances)
Housing units lacking complete kitchen facilities: 4.8%
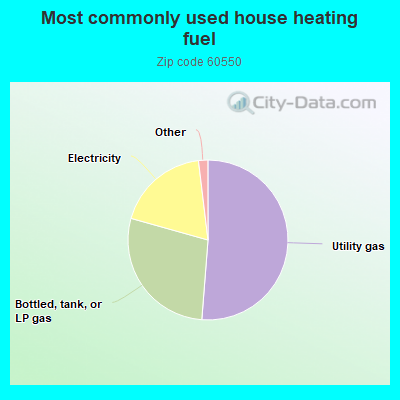
51.4%Utility gas
28.2%Bottled, tank, or LP gas
18.8%Electricity
1.0%Other fuel
1.0%No fuel used
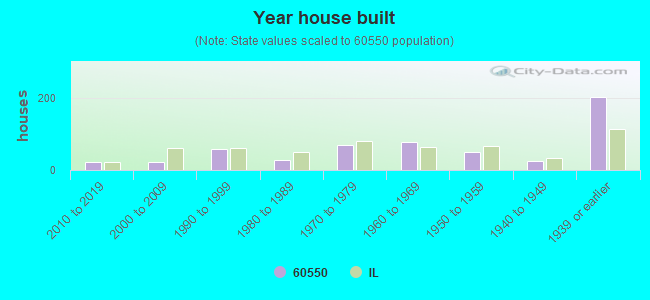
Population in 1990: 1,180. Population change in the 1990s: +265 (+22.5%).
Place of birth for U.S.-born residents:
This state: 996
Northeast: 11
Midwest: 69
South: 18
West: 30
67% of the 60550 zip code residents lived in the same house 5 years ago. Out of people who lived in different houses, 57% lived in this county. Out of people who lived in different counties, 50% lived in Illinois.
92% of the 60550 zip code residents lived in the same house 1 year ago. Out of people who lived in different houses, 44% moved from this county. Out of people who lived in different houses, 23% moved from different county within same state. Out of people who lived in different houses, 17% moved from different state. Out of people who lived in different houses, 17% moved from abroad.
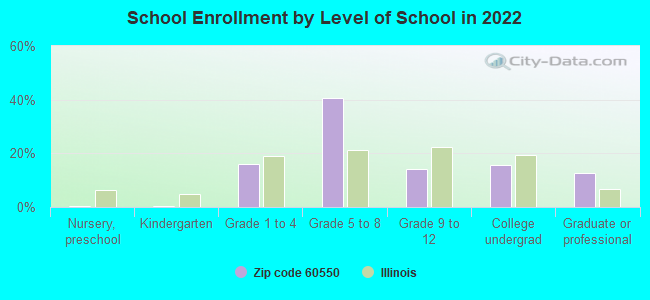
Private vs. public school enrollment:
Students in private schools in grades 1 to 8 (elementary and middle school):
Here:
0.0%
Illinois:
13.3%
Students in private schools in grades 9 to 12 (high school):
Here:
0.0%
Illinois:
9.9%
Students in private undergraduate colleges: 8
Here:
19.1%
Illinois:
27.4%
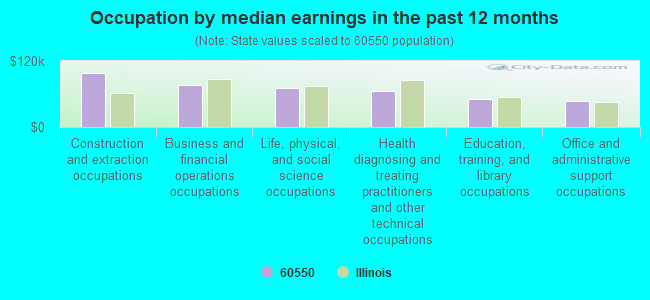
Occupation by median earnings in the past 12 months ($)
98,606Construction and extraction occupations
75,783Business and financial operations occupations
70,232Life, physical, and social science occupations
65,351Health diagnosing and treating practitioners and other technical occupations
51,072Education, training, and library occupations
46,679Office and administrative support occupations
Top industries in this zip code by the number of employees in 2005:
Health Care and Social Assistance: Nursing Care Facilities (50-99 employees: 1 establishment)
Arts, Entertainment, and Recreation: Golf Courses and Country Clubs (20-49: 1)
Construction: Residential Remodelers (10-19: 1)
Other Services (except Public Administration): Automotive Body, Paint, and Interior Repair and Maintenance (10-19: 1)
Other Services (except Public Administration): Religious Organizations (5-9: 1, 1-4: 1)
Health Care and Social Assistance: Offices of Physicians (except Mental Health Specialists) (5-9: 1)
Finance and Insurance: Commercial Banking (5-9: 1)
People in group quarters in 2010:
71 people in nursing facilities/skilled-nursing facilities
People in group quarters in 2000:
66 people in nursing homes
Fatal accident statistics in 2014:
Fatal accident count: 1
Vehicles involved in fatal accidents: 1
Fatal accidents caused by drunken drivers: 1
Fatalities: 1
Persons involved in fatal accidents: 2
Pedestrians involved in fatal accidents: 0
Fatal accident statistics in 2011:
Fatal accident count: 1
Vehicles involved in fatal accidents: 2
Fatal accidents caused by drunken drivers: 1
Fatalities: 1
Persons involved in fatal accidents: 4
Pedestrians involved in fatal accidents: 0
Home Mortgage Disclosure Act Aggregated Statistics For Year 2009 (Based on 2 partial tracts)
A) FHA, FSA/RHS & VA Home Purchase Loans
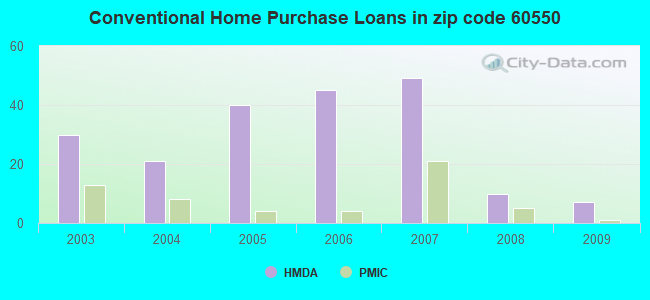
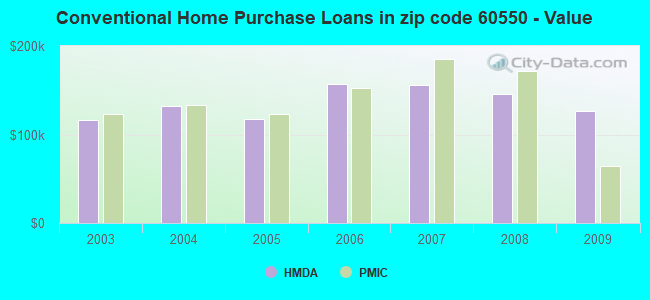
B) Conventional Home Purchase Loans
C) Refinancings
D) Home Improvement Loans
F) Non-occupant Loans on < 5 Family Dwellings (A B C & D)
Number
Average Value
Number
Average Value
Number
Average Value
Number
Average Value
Number
Average Value
LOANS ORIGINATED
12
$126,964
7
$126,603
65
$149,098
1
$57,060
3
$102,583
APPLICATIONS APPROVED, NOT ACCEPTED
1
$109,260
0
$0
7
$176,377
0
$0
0
$0
APPLICATIONS DENIED
2
$206,985
0
$0
23
$175,845
1
$105,010
1
$185,740
APPLICATIONS WITHDRAWN
1
$73,450
1
$63,730
7
$178,891
0
$0
0
$0
FILES CLOSED FOR INCOMPLETENESS
0
$0
0
$0
6
$182,100
0
$0
0
$0
Aggregated Statistics For Year 2008 (Based on 2 partial tracts)
A) FHA, FSA/RHS & VA Home Purchase Loans
B) Conventional Home Purchase Loans
C) Refinancings
D) Home Improvement Loans
F) Non-occupant Loans on < 5 Family Dwellings (A B C & D)
G) Loans On Manufactured Home Dwelling (A B C & D)
Number
Average Value
Number
Average Value
Number
Average Value
Number
Average Value
Number
Average Value
Number
Average Value
LOANS ORIGINATED
5
$212,208
10
$146,044
48
$165,053
4
$18,970
5
$122,978
1
$64,340
APPLICATIONS APPROVED, NOT ACCEPTED
2
$183,920
4
$164,800
5
$176,758
0
$0
0
$0
0
$0
APPLICATIONS DENIED
4
$157,972
2
$184,225
27
$194,577
4
$84,828
1
$81,940
0
$0
APPLICATIONS WITHDRAWN
0
$0
1
$359,340
12
$189,282
1
$139,610
0
$0
0
$0
FILES CLOSED FOR INCOMPLETENESS
0
$0
1
$72,840
3
$148,107
0
$0
0
$0
0
$0
Aggregated Statistics For Year 2007 (Based on 2 partial tracts)
A) FHA, FSA/RHS & VA Home Purchase Loans
B) Conventional Home Purchase Loans
C) Refinancings
D) Home Improvement Loans
F) Non-occupant Loans on < 5 Family Dwellings (A B C & D)
G) Loans On Manufactured Home Dwelling (A B C & D)
Number
Average Value
Number
Average Value
Number
Average Value
Number
Average Value
Number
Average Value
Number
Average Value
LOANS ORIGINATED
1
$220,950
49
$155,974
55
$151,220
10
$43,097
9
$106,224
1
$8,500
APPLICATIONS APPROVED, NOT ACCEPTED
1
$67,980
4
$179,672
12
$133,439
2
$35,510
0
$0
0
$0
APPLICATIONS DENIED
2
$153,875
11
$186,239
25
$180,692
5
$36,178
1
$136,570
1
$35,810
APPLICATIONS WITHDRAWN
1
$113,510
11
$189,935
12
$167,785
2
$149,625
0
$0
0
$0
FILES CLOSED FOR INCOMPLETENESS
0
$0
1
$136,570
6
$247,555
0
$0
0
$0
0
$0
Aggregated Statistics For Year 2006 (Based on 2 partial tracts)
A) FHA, FSA/RHS & VA Home Purchase Loans
B) Conventional Home Purchase Loans
C) Refinancings
D) Home Improvement Loans
F) Non-occupant Loans on < 5 Family Dwellings (A B C & D)
G) Loans On Manufactured Home Dwelling (A B C & D)
Number
Average Value
Number
Average Value
Number
Average Value
Number
Average Value
Number
Average Value
Number
Average Value
LOANS ORIGINATED
3
$151,347
45
$157,200
50
$143,386
6
$57,260
4
$115,178
0
$0
APPLICATIONS APPROVED, NOT ACCEPTED
1
$112,900
8
$141,886
7
$133,887
3
$57,463
1
$67,380
1
$67,380
APPLICATIONS DENIED
1
$92,870
6
$209,820
25
$145,534
4
$73,598
2
$92,265
0
$0
APPLICATIONS WITHDRAWN
1
$154,180
11
$130,119
13
$141,618
2
$77,090
3
$105,617
0
$0
FILES CLOSED FOR INCOMPLETENESS
0
$0
0
$0
8
$186,045
0
$0
0
$0
0
$0
Aggregated Statistics For Year 2005 (Based on 2 partial tracts)
A) FHA, FSA/RHS & VA Home Purchase Loans
B) Conventional Home Purchase Loans
C) Refinancings
D) Home Improvement Loans
F) Non-occupant Loans on < 5 Family Dwellings (A B C & D)
G) Loans On Manufactured Home Dwelling (A B C & D)
Number
Average Value
Number
Average Value
Number
Average Value
Number
Average Value
Number
Average Value
Number
Average Value
LOANS ORIGINATED
2
$142,950
40
$117,394
53
$130,734
4
$71,625
1
$91,050
0
$0
APPLICATIONS APPROVED, NOT ACCEPTED
0
$0
5
$116,786
10
$143,131
0
$0
2
$109,565
0
$0
APPLICATIONS DENIED
0
$0
4
$120,490
36
$135,664
7
$48,733
1
$65,560
1
$30,350
APPLICATIONS WITHDRAWN
1
$100,160
2
$122,005
21
$153,687
2
$115,635
0
$0
0
$0
FILES CLOSED FOR INCOMPLETENESS
0
$0
0
$0
4
$167,532
1
$45,520
0
$0
0
$0
Aggregated Statistics For Year 2004 (Based on 2 partial tracts)
A) FHA, FSA/RHS & VA Home Purchase Loans
B) Conventional Home Purchase Loans
C) Refinancings
D) Home Improvement Loans
F) Non-occupant Loans on < 5 Family Dwellings (A B C & D)
G) Loans On Manufactured Home Dwelling (A B C & D)
Number
Average Value
Number
Average Value
Number
Average Value
Number
Average Value
Number
Average Value
Number
Average Value
LOANS ORIGINATED
5
$153,692
21
$132,355
59
$130,443
5
$64,706
2
$134,145
0
$0
APPLICATIONS APPROVED, NOT ACCEPTED
0
$0
0
$0
8
$130,050
1
$8,500
0
$0
0
$0
APPLICATIONS DENIED
0
$0
2
$120,185
26
$135,735
1
$12,140
1
$91,050
1
$19,420
APPLICATIONS WITHDRAWN
0
$0
1
$108,050
19
$137,022
1
$27,310
0
$0
0
$0
FILES CLOSED FOR INCOMPLETENESS
0
$0
0
$0
4
$132,175
0
$0
0
$0
0
$0
Aggregated Statistics For Year 2003 (Based on 2 partial tracts)
A) FHA, FSA/RHS & VA Home Purchase Loans
B) Conventional Home Purchase Loans
C) Refinancings
D) Home Improvement Loans
F) Non-occupant Loans on < 5 Family Dwellings (A B C & D)


 Nearest zip codes: 60530, 60556, 60150, 61353, 60115, 60553.