Estimated zip code population in 2022: 28,051 Zip code population in 2010: 29,107 Zip code population in 2000: 22,499
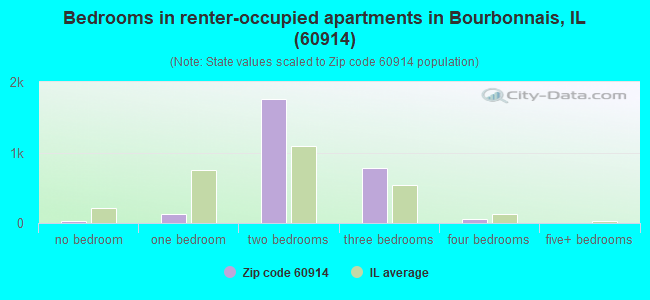
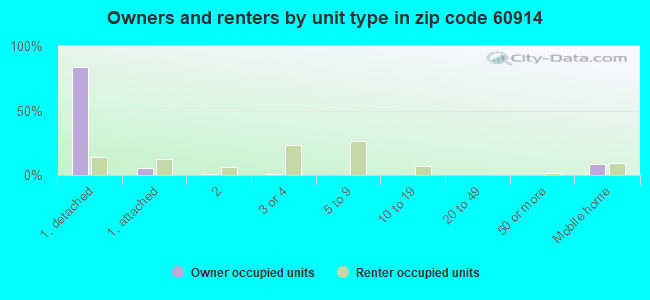
Houses and condos: 10,414 Renter-occupied apartments: 2,781
% of renters here:
28%
State:
33%
March 2022 cost of living index in zip code 60914: 94.6 (less than average, U.S. average is 100)
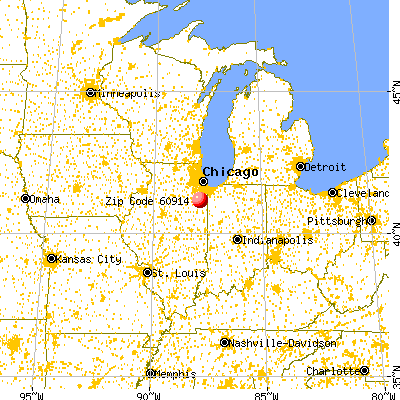
Land area: 48.8 sq. mi. Water area: 0.4 sq. mi.
Population density: 575 people per square mile
(low).
OSM Map
General Map
Google Map
MSN Map
OSM Map
General Map
Google Map
MSN Map
OSM Map
General Map
Google Map
MSN Map
OSM Map
General Map
Google Map
MSN Map
Please wait while loading the map...
Real estate property taxes paid for housing units in 2022:
This zip code:
2.0% ($4,959)
Illinois:
2.0% ($4,912)
Median real estate property taxes paid for housing units with mortgages in 2022: $5,103 (2.1%) Median real estate property taxes paid for housing units with no mortgage in 2022: $4,633 (2.0%)
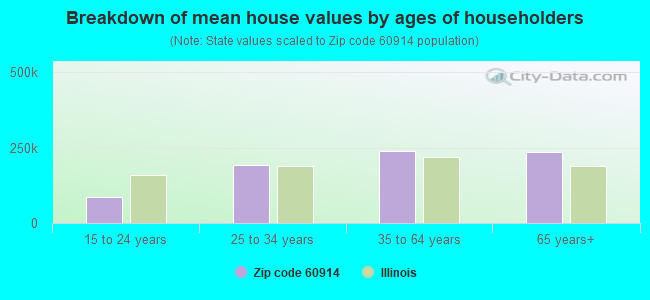
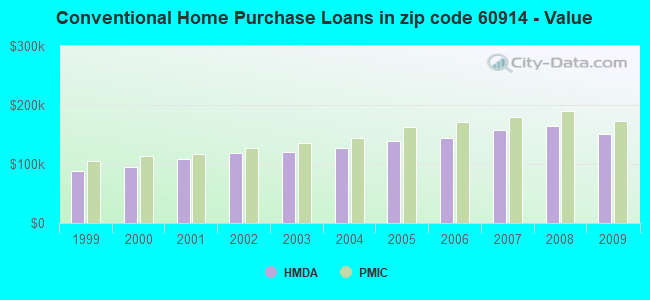
Estimated median house/condo value in 2022: $243,392
60914:
$243,392
Illinois:
$251,600
According to our research of Illinois and other state lists, there were 27 registered sex offenders living in 60914 zip code as of April 19, 2024. The ratio of all residents to sex offenders in zip code 60914 is 1,096 to 1. The ratio of registered sex offenders to all residents in this zip code is lower than the state average.
Median resident age:
This zip code:
35.3 years
Illinois median age:
39.1 years
Average household size:
This zip code:
2.6 people
Illinois:
2.4 people
Averages for the 2020 tax year for zip code 60914, filed in 2021:
Average Adjusted Gross Income (AGI) in 2020: $74,690 (Individual Income Tax Returns)
Here:
$74,690
State:
$82,626
Salary/wage: $58,688 (reported on 83.8% of returns)
Here:
$58,688
State:
$66,640
(% of AGI for various income ranges: 1142.1% for AGIs below $25k, 3375.3% for AGIs $25k-50k, 6249.6% for AGIs $50k-75k, 8976.4% for AGIs $75k-100k, 15620.6% for AGIs $100k-200k, 63395.3% for AGIs over 200k)
Taxable interest for individuals: $1,619 (reported on 29.8% of returns)
This zip code:
$1,619
Illinois:
$2,376
(% of AGI for various income ranges: 13.3% for AGIs below $25k, 19.1% for AGIs $25k-50k, 39.6% for AGIs $50k-75k, 49.3% for AGIs $75k-100k, 91.7% for AGIs $100k-200k, 1807.6% for AGIs over 200k)
Ordinary dividends: $5,436 (reported on 19.0% of returns)
Here:
$5,436
State:
$9,061
(% of AGI for various income ranges: 22.3% for AGIs below $25k, 35.8% for AGIs $25k-50k, 63.2% for AGIs $50k-75k, 121.8% for AGIs $75k-100k, 172.2% for AGIs $100k-200k, 4378.8% for AGIs over 200k)
Net capital gain/loss in AGI: +$18,665 (reported on 16.7% of returns)
Here:
+$18,665
State:
+$31,684
(% of AGI for various income ranges: 9.5% for AGIs below $25k, 35.7% for AGIs $25k-50k, 76.5% for AGIs $50k-75k, 123.1% for AGIs $75k-100k, 279.8% for AGIs $100k-200k, 20216.5% for AGIs over 200k)
Profit/loss from business: +$8,821 (reported on 12.5% of returns)
Here:
+$8,821
State:
+$12,175
(% of AGI for various income ranges: 66.4% for AGIs below $25k, 55.2% for AGIs $25k-50k, 69.1% for AGIs $50k-75k, 76.7% for AGIs $75k-100k, 200.5% for AGIs $100k-200k, 3773.5% for AGIs over 200k)
Taxable individual retirement arrangement distribution: $19,047 (reported on 9.8% of returns)
60914:
$19,047
Illinois:
$21,613
(% of AGI for various income ranges: 54.1% for AGIs below $25k, 104.6% for AGIs $25k-50k, 243.2% for AGIs $50k-75k, 406.2% for AGIs $75k-100k, 528.5% for AGIs $100k-200k, 2639.4% for AGIs over 200k)
Self-employed (Keogh) retirement plans: $26,950 (reported on 0.3% of returns)
60914:
$26,950
Illinois:
$30,962
(% of AGI for various income ranges: 634.1% for AGIs over 200k)
Total itemized deductions: $33,277 (reported on 7.8% of returns)
Here:
$33,277
State:
$34,948
(% of AGI for various income ranges: 46.6% for AGIs below $25k, 129.2% for AGIs $25k-50k, 319.9% for AGIs $50k-75k, 480.0% for AGIs $75k-100k, 577.9% for AGIs $100k-200k, 6665.9% for AGIs over 200k)
Charity contributions: $11,918 (reported on 6.2% of returns)
Here:
$11,918
State:
$13,122
(% of AGI for various income ranges: 3.9% for AGIs below $25k, 22.0% for AGIs $25k-50k, 48.9% for AGIs $50k-75k, 103.8% for AGIs $75k-100k, 187.8% for AGIs $100k-200k, 2687.6% for AGIs over 200k)
Taxes paid: $7,815 (reported on 7.8% of returns)
60914:
$7,815
State:
$8,563
(% of AGI for various income ranges: 9.1% for AGIs below $25k, 25.3% for AGIs $25k-50k, 82.5% for AGIs $50k-75k, 154.8% for AGIs $75k-100k, 181.3% for AGIs $100k-200k, 907.6% for AGIs over 200k)
Earned income credit: $2,393 (reported on 13.7% of returns)
Here:
$2,393
State:
$2,311
(% of AGI for various income ranges: 92.2% for AGIs below $25k, 61.0% for AGIs $25k-50k, 0.9% for AGIs $50k-75k)
Percentage of individuals using paid preparers for their 2020 taxes: 95.2%
Here:
95%
State:
93%
(% for various income ranges: 94.2% for AGIs below $25k, 96.0% for AGIs $25k-50k, 94.5% for AGIs $50k-75k, 96.0% for AGIs $75k-100k, 95.6% for AGIs $100k-200k, 96.2% for AGIs over 200k)
Averages for the 2012 tax year for zip code 60914, filed in 2013:
Average Adjusted Gross Income (AGI) in 2012: $61,020 (Individual Income Tax Returns)
Here:
$61,020
State:
$68,058
Salary/wage: $52,392 (reported on 86.4% of returns)
Here:
$52,392
State:
$55,396
(% of AGI for various income ranges: 75.4% for AGIs below $25k, 78.2% for AGIs $25k-50k, 78.5% for AGIs $50k-75k, 78.9% for AGIs $75k-100k, 80.3% for AGIs $100k-200k, 54.9% for AGIs over 200k)
Taxable interest for individuals: $1,203 (reported on 38.0% of returns)
This zip code:
$1,203
Illinois:
$1,969
(% of AGI for various income ranges: 1.1% for AGIs below $25k, 0.8% for AGIs $25k-50k, 0.5% for AGIs $50k-75k, 0.5% for AGIs $75k-100k, 0.6% for AGIs $100k-200k, 1.2% for AGIs over 200k)
Ordinary dividends: $3,660 (reported on 19.9% of returns)
Here:
$3,660
State:
$7,786
(% of AGI for various income ranges: 1.6% for AGIs below $25k, 0.9% for AGIs $25k-50k, 0.8% for AGIs $50k-75k, 0.8% for AGIs $75k-100k, 0.8% for AGIs $100k-200k, 2.4% for AGIs over 200k)
Net capital gain/loss in AGI: +$8,072 (reported on 14.8% of returns)
Here:
+$8,072
State:
+$22,183
(% of AGI for various income ranges: 0.4% for AGIs $25k-50k, 0.5% for AGIs $50k-75k, 0.3% for AGIs $75k-100k, 0.8% for AGIs $100k-200k, 8.0% for AGIs over 200k)
Profit/loss from business: +$9,970 (reported on 12.9% of returns)
Here:
+$9,970
State:
+$12,903
(% of AGI for various income ranges: 5.7% for AGIs below $25k, 1.7% for AGIs $25k-50k, 1.3% for AGIs $50k-75k, 1.3% for AGIs $75k-100k, 1.4% for AGIs $100k-200k, 3.5% for AGIs over 200k)
Taxable individual retirement arrangement distribution: $12,457 (reported on 9.8% of returns)
60914:
$12,457
Illinois:
$17,929
(% of AGI for various income ranges: 2.9% for AGIs below $25k, 2.4% for AGIs $25k-50k, 2.6% for AGIs $50k-75k, 2.2% for AGIs $75k-100k, 1.8% for AGIs $100k-200k, 1.1% for AGIs over 200k)
Self-employment retirement plans: $21,000 (reported on 0.2% of returns)
60914:
$21,000
Illinois:
$24,666
Total itemized deductions: $22,031 (20% of AGI, reported on 37.8% of returns)
Here:
$22,031
State:
$26,433
Here:
20.0% of AGI
State:
19.2% of AGI
(% of AGI for various income ranges: 9.4% for AGIs below $25k, 10.7% for AGIs $25k-50k, 15.1% for AGIs $50k-75k, 15.4% for AGIs $75k-100k, 15.5% for AGIs $100k-200k, 11.7% for AGIs over 200k)
Charity contributions: $3,897 (reported on 31.4% of returns)
Here:
$3,897
State:
$4,525
(% of AGI for various income ranges: 0.7% for AGIs below $25k, 1.2% for AGIs $25k-50k, 1.9% for AGIs $50k-75k, 1.9% for AGIs $75k-100k, 2.3% for AGIs $100k-200k, 2.6% for AGIs over 200k)
Taxes paid: $9,392 (reported on 37.8% of returns)
60914:
$9,392
State:
$11,968
(% of AGI for various income ranges: 2.3% for AGIs below $25k, 3.3% for AGIs $25k-50k, 5.5% for AGIs $50k-75k, 6.3% for AGIs $75k-100k, 7.2% for AGIs $100k-200k, 6.4% for AGIs over 200k)
Earned income credit: $2,374 (reported on 14.8% of returns)
Here:
$2,374
State:
$2,349
(% of AGI for various income ranges: 6.5% for AGIs below $25k, 1.0% for AGIs $25k-50k)
Percentage of individuals using paid preparers for their 2012 taxes: 62.2%
Here:
62%
State:
57%
(% for various income ranges: 53.8% for AGIs below $25k, 59.1% for AGIs $25k-50k, 67.4% for AGIs $50k-75k, 70.0% for AGIs $75k-100k, 72.8% for AGIs $100k-200k, 84.8% for AGIs over 200k)
Averages for the 2004 tax year for zip code 60914, filed in 2005:
Average Adjusted Gross Income (AGI) in 2004: $49,786 (Individual Income Tax Returns)
Here:
$49,786
State:
$54,625
Salary/wage: $44,862 (reported on 87.3% of returns)
Here:
$44,862
State:
$46,811
(% of AGI for various income ranges: 106.4% for AGIs below $10k, 73.5% for AGIs $10k-25k, 82.3% for AGIs $25k-50k, 84.6% for AGIs $50k-75k, 85.6% for AGIs $75k-100k, 70.0% for AGIs over 100k)
Taxable interest for individuals: $1,704 (reported on 51.5% of returns)
This zip code:
$1,704
Illinois:
$2,101
(% of AGI for various income ranges: 8.8% for AGIs below $10k, 2.6% for AGIs $10k-25k, 1.5% for AGIs $25k-50k, 1.1% for AGIs $50k-75k, 1.1% for AGIs $75k-100k, 2.2% for AGIs over 100k)
Taxable dividends: $2,198 (reported on 24.4% of returns)
Here:
$2,198
State:
$4,306
(% of AGI for various income ranges: 4.6% for AGIs below $10k, 1.6% for AGIs $10k-25k, 0.7% for AGIs $25k-50k, 0.6% for AGIs $50k-75k, 0.8% for AGIs $75k-100k, 1.4% for AGIs over 100k)
Net capital gain/loss: +$8,157 (reported on 18.5% of returns)
Here:
+$8,157
State:
+$17,321
(% of AGI for various income ranges: -0.6% for AGIs below $10k, 0.1% for AGIs $10k-25k, 0.3% for AGIs $25k-50k, 0.5% for AGIs $50k-75k, 1.0% for AGIs $75k-100k, 7.5% for AGIs over 100k)
Profit/loss from business: +$8,730 (reported on 12.9% of returns)
Here:
+$8,730
State:
+$11,771
(% of AGI for various income ranges: 8.0% for AGIs below $10k, 2.8% for AGIs $10k-25k, 2.3% for AGIs $25k-50k, 1.4% for AGIs $50k-75k, 1.4% for AGIs $75k-100k, 2.8% for AGIs over 100k)
Profit/loss from farming: +$12,517 (reported on 0.5% of returns)
Here:
+$12,517
State:
+$2,327
(% of AGI for various income ranges: 3.1% for AGIs below $10k, 0.1% for AGIs $25k-50k, 0.0% for AGIs $50k-75k, 0.2% for AGIs over 100k)
IRA payment deduction: $3,241 (reported on 2.6% of returns)
60914:
$3,241
Illinois:
$3,087
(% of AGI for various income ranges: 0.1% for AGIs $10k-25k, 0.3% for AGIs $25k-50k, 0.2% for AGIs $50k-75k, 0.2% for AGIs $75k-100k, 0.1% for AGIs over 100k)
Self-employed pension: $13,390 (reported on 0.5% of returns)
Here:
$13,390
Illinois:
$16,965
Total itemized deductions: $17,216 (20% of AGI, reported on 37.4% of returns)
Here:
$17,216
State:
$20,239
Here:
19.8% of AGI
State:
19.5% of AGI
(% of AGI for various income ranges: 11.1% for AGIs below $10k, 10.2% for AGIs $10k-25k, 11.6% for AGIs $25k-50k, 14.4% for AGIs $50k-75k, 15.3% for AGIs $75k-100k, 12.1% for AGIs over 100k)
Charity contributions deductions: $3,483 (4% of AGI, reported on 33.9% of returns)
Here:
$3,483
State:
$3,719
Here:
3.9% of AGI
State:
3.4% of AGI
(% of AGI for various income ranges: 0.9% for AGIs below $10k, 1.3% for AGIs $10k-25k, 1.7% for AGIs $25k-50k, 2.0% for AGIs $50k-75k, 2.5% for AGIs $75k-100k, 3.1% for AGIs over 100k)
Total tax: $7,547 (reported on 77.4% of returns)
60914:
$7,547
State:
$9,882
(% of AGI for various income ranges: 3.0% for AGIs below $10k, 4.0% for AGIs $10k-25k, 6.9% for AGIs $25k-50k, 8.6% for AGIs $50k-75k, 9.9% for AGIs $75k-100k, 18.5% for AGIs over 100k)
Earned income credit: $1,605 (reported on 12.0% of returns)
Here:
$1,605
State:
$1,788
Percentage of individuals using paid preparers for their 2004 taxes: 65.7%
Here:
66%
State:
61%
(% for various income ranges: 55.3% for AGIs below $10k, 64.7% for AGIs $10k-25k, 65.9% for AGIs $25k-50k, 70.3% for AGIs $50k-75k, 72.0% for AGIs $75k-100k, 74.5% for AGIs over 100k)
Household received Food Stamps/SNAP in the past 12 months: 1,187 Household did not receive Food Stamps/SNAP in the past 12 months: 8,572
Women who had a birth in the past 12 months: 410 (220 now married, 190 unmarried) Women who did not have a birth in the past 12 months: 7,101 (2,288 now married, 4,832 unmarried)
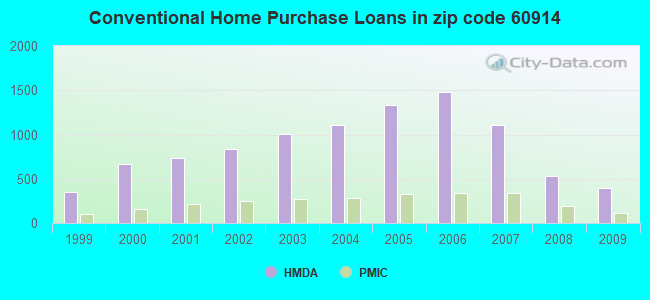
Housing units in zip code 60914 with a mortgage: 4,678 (287 second mortgage, 14 home equity loan, 268 both second mortgage and home equity loan) Houses without a mortgage: 30
Median monthly owner costs for units with a mortgage: $1,735 Median monthly owner costs for units without a mortgage: $821
Residents with income below the poverty level in 2022:
This zip code:
12.1%
Whole state:
11.9%
Residents with income below 50% of the poverty level in 2022:
This zip code:
5.4%
Whole state:
5.7%
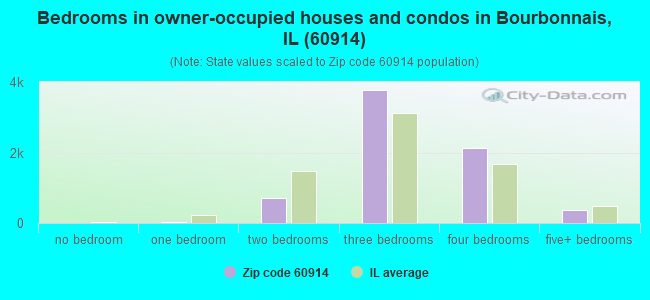
Median number of rooms in houses and condos:
Here:
6.6
State:
6.4
Median number of rooms in apartments:
Here:
4.2
State:
4.1
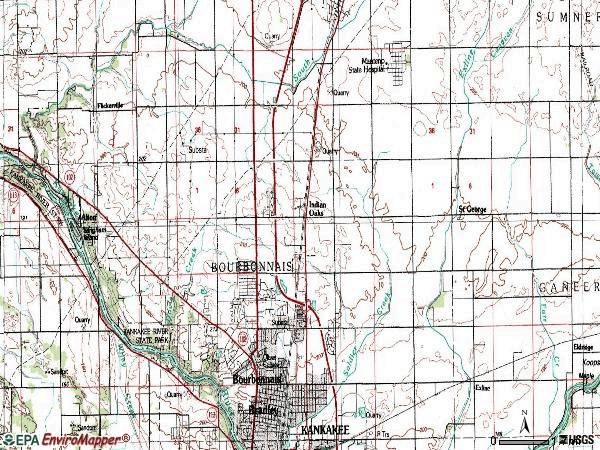
Notable locations in this zip code not listed on our city pages
Notable locations in zip code 60914: Bon Vivant Country Club (A), Camp Shaw-Waw-Nassee (B), Bourbonnais Fire Protection District (C), Saint Mary's Ambulance Service (D). Display/hide their locations on the map
In group quarters: 2,461 (-1 institutionalized population)
Size of family households: 2,715 2-persons, 1,647 3-persons, 1,575 4-persons, 496 5-persons, 263 6-persons, 80 7-or-more-persons
Size of nonfamily households: 2,451 1-person, 524 2-persons, 8 3-persons
3,479 married couples with children.
2,224 single-parent households (401 men, 1,823 women).
92.4% of residents of 60914 zip code speak English at home.
4.1% of residents speak Spanish at home (81% very well, 12% well, 6% not well).
1.2% of residents speak other Indo-European language at home (81% very well, 1% well, 8% not well, 11% not at all).
1.3% of residents speak Asian or Pacific Island language at home (80% very well, 17% well, 4% not well).
0.4% of residents speak other language at home (100% very well).
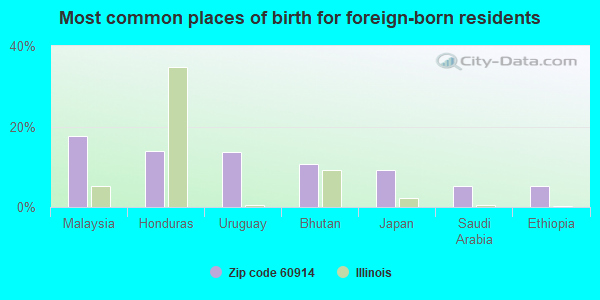
Foreign born population: 1,232 (4.4%) (66.7% of them are naturalized citizens)
This zip code:
4.4%
Whole state:
14.4%
18%Malaysia
14%Honduras
14%Uruguay
11%Bhutan
9%Japan
5%Saudi Arabia
5%Ethiopia
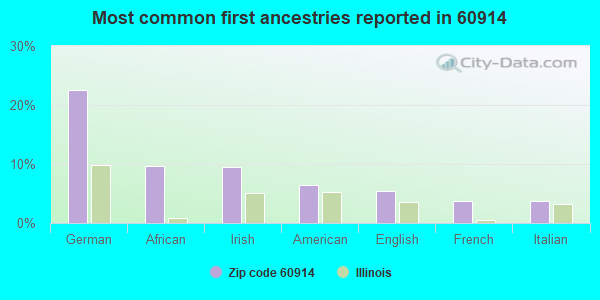
23%German
10%African
9%Irish
6%American
5%English
4%French
4%Italian
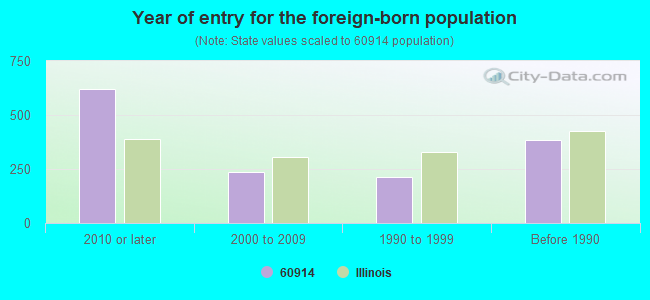
Year of entry for the foreign-born population
6222010 or later
2372000 to 2009
2131990 to 1999
384Before 1990
Major facilities with environmental interests located in this zip code:
IL DNR-KANKAKEE RIVER STATE PK (ROUTE 102 NORTH in BOURBONNAIS, IL)
STATE MASTER (Illinois EPA Project) - National Pollutant Discharge Elimination System Permit, National Pollutant Discharge Elimination System NON-MAJOR (Tracking pollutant discharge elimination systems) - permit National Pollutant Discharge Elimination System NON-MAJOR (Tracking pollutant discharge elimination systems) - permit Business SIC classification: LAND, MINERAL, WILDLIFE, AND FOREST CONSERVATION
NUCOR STEEL KANKAKEE INC. (972 EAST 4500 NORTH ROAD in BOURBONNAIS, IL)
AIR MAJOR (AIRS/AFS) CRITERIA AND HAZARDOUS AIR POLLUTANT INVENTORY (Inventory of air pollution sources) National Pollutant Discharge Elimination System NON-MAJOR (Tracking pollutant discharge elimination systems) - permit HAZARDOUS WASTE BIENNIAL REPORTER (Resource Conservation and Recovery Act (tracking hazardous waste)) Large Quantity Generators, more that 1000 kg of hazardous waste/month (Resource Conservation and Recovery Act (tracking hazardous waste)) - notification TSD (Resource Conservation and Recovery Act (tracking hazardous waste)) TRI REPORTER (Tracking of toxic chemicals releasing facilities) Business SIC classification: STEEL WORKS, BLAST FURNACES (INCLUDING COKE OVENS), AND ROLLING MILLS Business NAICS classification: IRON AND STEEL MILLS. Alternative names: BIRMINGHAM STEEL CORP ILLINOIS STEEL DIV, BIRMINGHAM STEEL CORP., KANKAKEE ILLINOIS STEEL DIV., BIRMINGHAM STEEL CORP.-KANKAKEE STEEL DIV, BIRMINGHAM STEEL-BOURBONNAIS, NUCOR STEEL INC-BOURBONNAIS
RUDOLPH EXPRESS COMPANY (1650 ARMOUR RD in BOURBONNAIS, IL)
STATE MASTER (Illinois EPA Project) - National Pollutant Discharge Elimination System Permit National Pollutant Discharge Elimination System NON-MAJOR (Tracking pollutant discharge elimination systems) - permit Small Quantity Generators, between 100 kg and 1000 kg of hazardous waste/month (Resource Conservation and Recovery Act (tracking hazardous waste)) - notification Organizations: CORP (CONTACT/OWNER)
HERITAGE FS INC (4887 N. 1220 E. RD. in BOURBONNAIS, IL)
STATE MASTER (Illinois EPA Project) - AIR PROGRAM AIR MINOR (AIRS/AFS) CRITERIA AND HAZARDOUS AIR POLLUTANT INVENTORY (Inventory of air pollution sources) Business SIC classification: GRAIN AND FIELD BEANS Alternative names: LAMBERT GRAIN INCORPORATED
NRG BOURBONNAIS LLC (801 EAST SAINT GEORGE ROAD in BOURBONNAIS, IL)
STATE MASTER (Illinois EPA Project) - AIR PROGRAM AIR MINOR (AIRS/AFS) AIR PROGRAM (Clean Air Markets Division Business System) Business SIC classification: ELECTRIC SERVICES Organizations: NRG BOURBONNAIS, LLC (OWNER/OPERATOR)
Alternative names: INDECK-BOURBONNAIS ENERGY CENTER, INDECK BOURBONNAIS LLC, INDECK-BOURBONNAIS ENERGY CENTER, NRGBOURBONNAIS LLC
PRECISION AUTO CRAFTERS (615 ARMOUR RD in BOURBONNAIS, IL)
STATE MASTER (Illinois EPA Project) - HAZARDOUS WASTE PROGRAM Large Quantity Generators, more that 1000 kg of hazardous waste/month (Resource Conservation and Recovery Act (tracking hazardous waste)) - notification Organizations: MAKKAY AUTO BODY INC (CONTACT/OWNER)
Alternative names: PRECISION AUTO CRAFTERS BY MARKAY
CIRCLE K 173 (655 N CONVENT in BOURBONNAIS, IL)
STATE MASTER (Illinois EPA Project) - HAZARDOUS WASTE PROGRAM Large Quantity Generators, more that 1000 kg of hazardous waste/month (Resource Conservation and Recovery Act (tracking hazardous waste)) Organizations: MACS CONVENIENCE STORES (CONTACT/OWNER)
HECKETT DIV OF HARSCO CORP (RTE. 50 & MCKNIGHT in BOURBONNAIS, IL)
STATE MASTER (Illinois EPA Project) - AIR PROGRAM AIR MINOR (AIRS/AFS) TRI REPORTER (Tracking of toxic chemicals releasing facilities) Business SIC classification: MINERALS AND EARTHS, GROUND OR OTHERWISE TREATED; PRIMARY METAL PRODUCTS Alternative names: HARSCO CORP. HECKETT DIV. PLANT 3, HECKETT PLANT 3 DIVISION OF HARSCO CORPORATION
ILLINOIS CENTRAL (RR MILEPOST 51.5 in BOURBONNAIS, IL)
STATE MASTER (Illinois EPA Project) - HAZARDOUS WASTE PROGRAM HAZARDOUS WASTE BIENNIAL REPORTER (Resource Conservation and Recovery Act (tracking hazardous waste)) (Resource Conservation and Recovery Act (tracking hazardous waste)) Business NAICS classification: LINE-HAUL RAILROADS.
KEVIN NUGENT CONSTRUCTION CO INC (106 ERNEST MOONEY DR in BOURBONNAIS, IL)
STATE MASTER (Illinois EPA Project) - HAZARDOUS WASTE PROGRAM Small Quantity Generators, between 100 kg and 1000 kg of hazardous waste/month (Resource Conservation and Recovery Act (tracking hazardous waste))
KLIEST PAINTING SVC (417 MAIN ST in BOURBONNAIS, IL)
STATE MASTER (Illinois EPA Project) - HAZARDOUS WASTE PROGRAM Small Quantity Generators, between 100 kg and 1000 kg of hazardous waste/month (Resource Conservation and Recovery Act (tracking hazardous waste)) - notification Organizations: KLIEST JOSEPH (CONTACT/OWNER)
CYNTEC OF BOURBONNAIS INC (MCKNIGHT RD in BOURBONNAIS, IL)
STATE MASTER (Illinois EPA Project) - AIR PROGRAM AIR MINOR (AIRS/AFS) Business SIC classification: NONCLASSIFIABLE ESTABLISHMENTS
Housing units lacking complete plumbing facilities: 0.8% Housing units lacking complete kitchen facilities: 1.1%
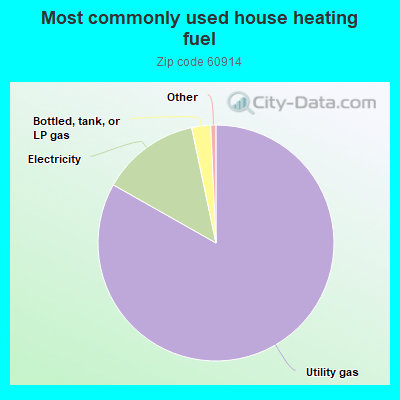
83.2%Utility gas
13.5%Electricity
2.6%Bottled, tank, or LP gas
Population in 1990: 18,311. Population change in the 1990s: +4,188 (+22.9%).
Place of birth for U.S.-born residents:
This state: 21,049
Northeast: 421
Midwest: 2,539
South: 1,705
West: 850
51% of the 60914 zip code residents lived in the same house 5 years ago. Out of people who lived in different houses, 56% lived in this county. Out of people who lived in different counties, 50% lived in Illinois.
94% of the 60914 zip code residents lived in the same house 1 year ago. Out of people who lived in different houses, 56% moved from this county. Out of people who lived in different houses, 34% moved from different county within same state. Out of people who lived in different houses, 7% moved from different state. Out of people who lived in different houses, 4% moved from abroad.
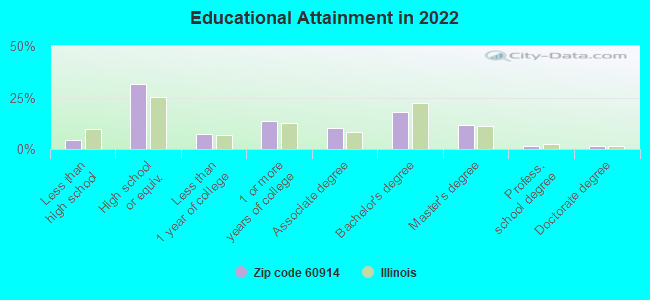
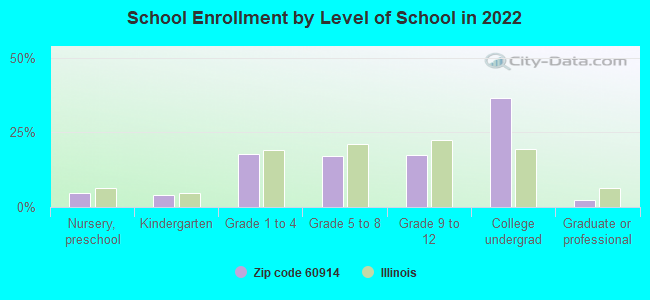
Private vs. public school enrollment:
Students in private schools in grades 1 to 8 (elementary and middle school): 574
Here:
20.4%
Illinois:
13.3%
Students in private schools in grades 9 to 12 (high school): 79
Here:
5.7%
Illinois:
9.9%
Students in private undergraduate colleges: 2,214
Here:
75.5%
Illinois:
27.4%
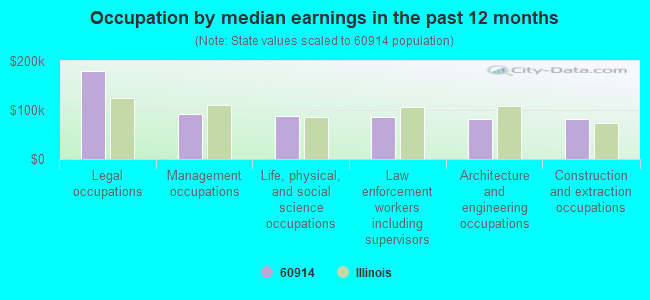
Occupation by median earnings in the past 12 months ($)
179,670Legal occupations
91,432Management occupations
86,988Life, physical, and social science occupations
86,574Law enforcement workers including supervisors
82,625Architecture and engineering occupations
81,849Construction and extraction occupations
Companies with federal contracts located in this zip code:
BRIAN TANNER (134 MOONEY DR in BOURBONNAIS, IL; small business)
$5,064 with Army for Clothing, Special Purpose. Signed on 2004-12-08. Completion date: 2004-12-23.
Top industries in this zip code by the number of employees in 2005:
Educational Services: Colleges, Universities, and Professional Schools (over 1000 employees: 1 establishment, 10-19 employees: 1 establishment)
Finance and Insurance: Direct Health and Medical Insurance Carriers (500-999: 1, 1-4: 1)
2002 - 2018 National Fire Incident Reporting System (NFIRS) incidents
According to the data from the years 2002 - 2018 the average number of fire incidents per year is 106. The highest number of reported fire incidents - 183 took place in 2010, and the least - 60 in 2015. The data has a rising trend.
When looking into fire subcategories, the most reports belonged to: Structure Fires (51.1%), and Outside Fires (31.0%).
Fire incident types reported to NFIRS in Zip Code 60914


 Nearest zip codes: 60915, 60950, 60901, 60910, 60468, 60964.


 According to the data from the years 2002 - 2018 the average number of fire incidents per year is 106. The highest number of reported fire incidents - 183 took place in 2010, and the least - 60 in 2015. The data has a rising trend.
 When looking into fire subcategories, the most reports belonged to: Structure Fires (51.1%), and Outside Fires (31.0%).