Estimated zip code population in 2022: 2,260 Zip code population in 2010: 2,205 Zip code population in 2000: 2,250
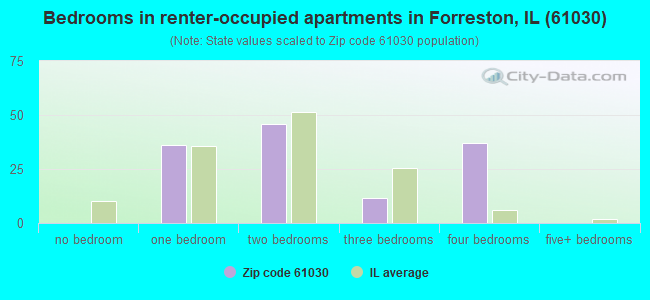
Houses and condos: 916 Renter-occupied apartments: 133
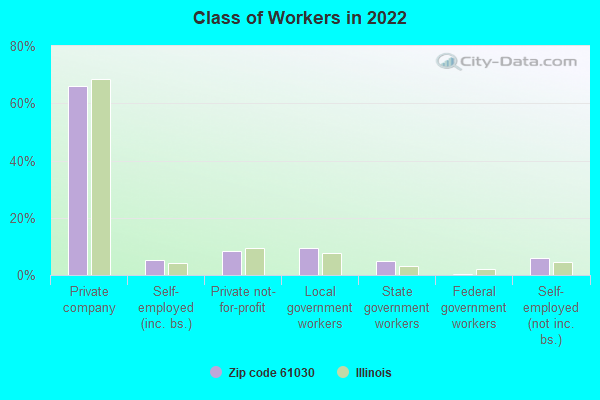
% of renters here:
15%
State:
33%
March 2022 cost of living index in zip code 61030: 84.7 (less than average, U.S. average is 100)
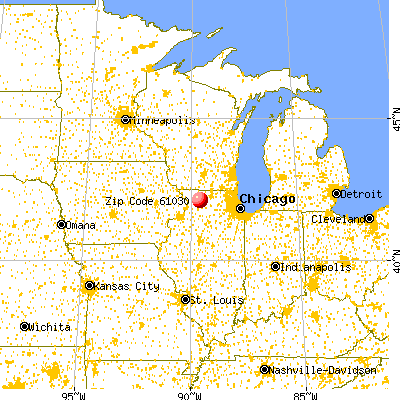
Land area: 59.7 sq. mi. Water area: 0.0 sq. mi.
Population density: 38 people per square mile
(very low).
OSM Map
General Map
Google Map
MSN Map
OSM Map
General Map
Google Map
MSN Map
OSM Map
General Map
Google Map
MSN Map
OSM Map
General Map
Google Map
MSN Map
Please wait while loading the map...
Real estate property taxes paid for housing units in 2022:
This zip code:
1.8% ($2,558)
Illinois:
2.0% ($4,912)
Median real estate property taxes paid for housing units with mortgages in 2022: $2,257 (1.7%) Median real estate property taxes paid for housing units with no mortgage in 2022: $2,883 (1.8%)
Business Search- 14 Million verified businesses
Males: 992
(43.9%)
Females: 1,267
(56.1%)
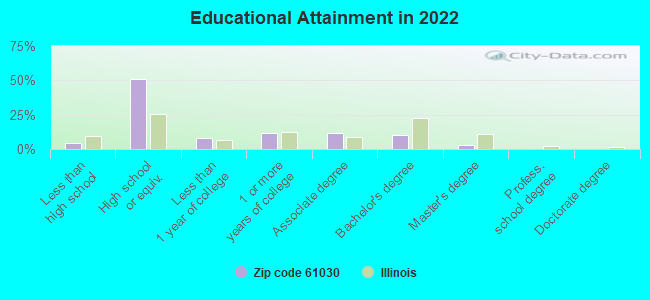
For population 25 years and over in 61030:
High school or higher: 94.3%
Bachelor's degree or higher: 13.6%
Graduate or professional degree: 3.1%
Unemployed: 1.9%
Mean travel time to work (commute): 24.4 minutes
For population 15 years and over in 61030:
Never married: 34.5%
Now married: 47.2%
Separated: 0.1%
Widowed: 7.6%
Divorced: 10.6%
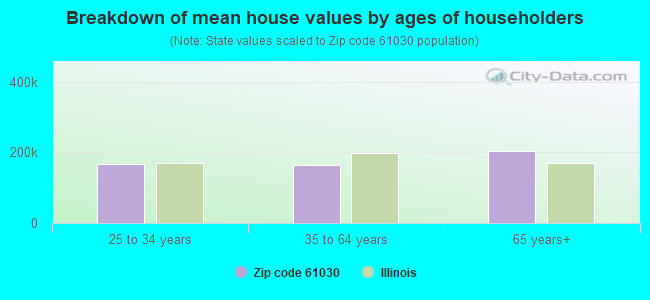
Zip code 61030 compared to state average:
Median house value below state average.
Unemployed percentage below state average.
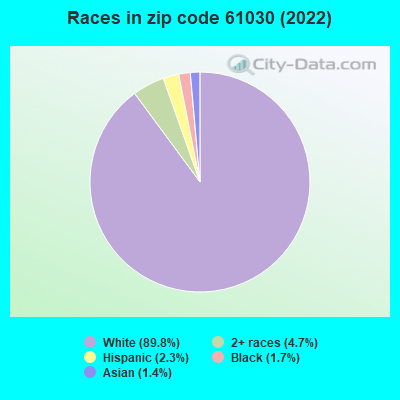
Black race population percentage significantly below state average.
Hispanic race population percentage significantly below state average.
Foreign-born population percentage significantly below state average.
Renting percentage below state average.
Length of stay since moving in significantly above state average.
Percentage of population with a bachelor's degree or higher significantly below state average.
Averages for the 2020 tax year for zip code 61030, filed in 2021:
Average Adjusted Gross Income (AGI) in 2020: $56,718 (Individual Income Tax Returns)
Here:
$56,718
State:
$82,626
Salary/wage: $46,788 (reported on 83.5% of returns)
Here:
$46,788
State:
$66,640
(% of AGI for various income ranges: 1140.9% for AGIs below $25k, 3476.5% for AGIs $25k-50k, 6465.7% for AGIs $50k-75k, 8675.6% for AGIs $75k-100k, 19878.6% for AGIs $100k-200k)
Taxable interest for individuals: $1,465 (reported on 35.9% of returns)
This zip code:
$1,465
Illinois:
$2,376
(% of AGI for various income ranges: 23.2% for AGIs below $25k, 62.0% for AGIs $25k-50k, 85.0% for AGIs $50k-75k, 58.9% for AGIs $75k-100k, 278.6% for AGIs $100k-200k)
Ordinary dividends: $3,671 (reported on 16.5% of returns)
Here:
$3,671
State:
$9,061
(% of AGI for various income ranges: 20.9% for AGIs below $25k, 47.5% for AGIs $25k-50k, 52.9% for AGIs $50k-75k, 93.3% for AGIs $75k-100k, 464.3% for AGIs $100k-200k)
Net capital gain/loss in AGI: +$6,638 (reported on 15.5% of returns)
Here:
+$6,638
State:
+$31,684
(% of AGI for various income ranges: 17.5% for AGIs $25k-50k, 65.7% for AGIs $50k-75k, 205.6% for AGIs $75k-100k, 1080.0% for AGIs $100k-200k)
Profit/loss from business: +$7,191 (reported on 10.7% of returns)
Here:
+$7,191
State:
+$12,175
(% of AGI for various income ranges: 173.6% for AGIs below $25k, 277.9% for AGIs $50k-75k, 28.6% for AGIs $100k-200k)
Taxable individual retirement arrangement distribution: $12,685 (reported on 12.6% of returns)
61030:
$12,685
Illinois:
$21,613
(% of AGI for various income ranges: 53.2% for AGIs below $25k, 163.5% for AGIs $25k-50k, 287.1% for AGIs $50k-75k, 892.2% for AGIs $75k-100k)
Total itemized deductions: $27,000 (reported on 3.9% of returns)
Here:
$27,000
State:
$34,948
(% of AGI for various income ranges: 771.4% for AGIs $50k-75k)
Charity contributions: $6,450 (reported on 1.9% of returns)
Here:
$6,450
State:
$13,122
(% of AGI for various income ranges: 58.6% for AGIs below $25k)
Taxes paid: $5,700 (reported on 3.9% of returns)
61030:
$5,700
State:
$8,563
(% of AGI for various income ranges: 162.9% for AGIs $50k-75k)
Earned income credit: $2,238 (reported on 12.6% of returns)
Here:
$2,238
State:
$2,311
(% of AGI for various income ranges: 75.0% for AGIs below $25k, 63.0% for AGIs $25k-50k)
Percentage of individuals using paid preparers for their 2020 taxes: 95.1%
Here:
95%
State:
93%
(% for various income ranges: 93.5% for AGIs below $25k, 96.0% for AGIs $25k-50k, 95.0% for AGIs $50k-75k, 100.0% for AGIs $75k-100k, 93.3% for AGIs $100k-200k)
Averages for the 2012 tax year for zip code 61030, filed in 2013:
Average Adjusted Gross Income (AGI) in 2012: $46,386 (Individual Income Tax Returns)
Here:
$46,386
State:
$68,058
Salary/wage: $37,610 (reported on 81.3% of returns)
Here:
$37,610
State:
$55,396
(% of AGI for various income ranges: 69.6% for AGIs below $25k, 71.9% for AGIs $25k-50k, 74.2% for AGIs $50k-75k, 74.4% for AGIs $75k-100k, 51.3% for AGIs $100k-200k)
Taxable interest for individuals: $1,344 (reported on 40.2% of returns)
This zip code:
$1,344
Illinois:
$1,969
(% of AGI for various income ranges: 2.1% for AGIs below $25k, 1.9% for AGIs $25k-50k, 1.5% for AGIs $50k-75k, 0.5% for AGIs $75k-100k, 0.5% for AGIs $100k-200k)
Ordinary dividends: $2,289 (reported on 17.8% of returns)
Here:
$2,289
State:
$7,786
(% of AGI for various income ranges: 1.3% for AGIs below $25k, 0.6% for AGIs $25k-50k, 0.9% for AGIs $50k-75k, 1.2% for AGIs $75k-100k, 0.7% for AGIs $100k-200k)
Net capital gain/loss in AGI: +$2,421 (reported on 13.1% of returns)
Here:
+$2,421
State:
+$22,183
(% of AGI for various income ranges: 0.9% for AGIs $25k-50k, 1.0% for AGIs $50k-75k, 0.8% for AGIs $75k-100k, 0.6% for AGIs $100k-200k)
Profit/loss from business: +$8,024 (reported on 15.9% of returns)
Here:
+$8,024
State:
+$12,903
(% of AGI for various income ranges: 7.0% for AGIs below $25k, 3.8% for AGIs $25k-50k, 4.1% for AGIs $50k-75k, 1.1% for AGIs $100k-200k)
Taxable individual retirement arrangement distribution: $6,518 (reported on 10.3% of returns)
61030:
$6,518
Illinois:
$17,929
(% of AGI for various income ranges: 2.0% for AGIs below $25k, 1.9% for AGIs $25k-50k, 0.9% for AGIs $50k-75k, 4.1% for AGIs $75k-100k)
Total itemized deductions: $19,743 (24% of AGI, reported on 26.2% of returns)
Here:
$19,743
State:
$26,433
Here:
24.1% of AGI
State:
19.2% of AGI
(% of AGI for various income ranges: 8.0% for AGIs below $25k, 12.2% for AGIs $25k-50k, 10.5% for AGIs $50k-75k, 12.9% for AGIs $75k-100k, 11.0% for AGIs $100k-200k)
Charity contributions: $4,387 (reported on 21.5% of returns)
Here:
$4,387
State:
$4,525
(% of AGI for various income ranges: 0.8% for AGIs below $25k, 1.7% for AGIs $25k-50k, 1.4% for AGIs $50k-75k, 2.0% for AGIs $75k-100k, 3.1% for AGIs $100k-200k)
Taxes paid: $6,807 (reported on 26.2% of returns)
61030:
$6,807
State:
$11,968
(% of AGI for various income ranges: 1.5% for AGIs below $25k, 3.3% for AGIs $25k-50k, 3.4% for AGIs $50k-75k, 4.5% for AGIs $75k-100k, 4.9% for AGIs $100k-200k)
Earned income credit: $2,200 (reported on 16.8% of returns)
Here:
$2,200
State:
$2,349
(% of AGI for various income ranges: 5.7% for AGIs below $25k, 0.9% for AGIs $25k-50k)
Percentage of individuals using paid preparers for their 2012 taxes: 64.5%
Here:
64%
State:
57%
(% for various income ranges: 58.1% for AGIs below $25k, 67.9% for AGIs $25k-50k, 70.6% for AGIs $50k-75k, 66.7% for AGIs $75k-100k, 70.0% for AGIs $100k-200k)
Averages for the 2004 tax year for zip code 61030, filed in 2005:
Average Adjusted Gross Income (AGI) in 2004: $38,277 (Individual Income Tax Returns)
Here:
$38,277
State:
$54,625
Salary/wage: $33,797 (reported on 81.3% of returns)
Here:
$33,797
State:
$46,811
(% of AGI for various income ranges: 329.5% for AGIs below $10k, 66.1% for AGIs $10k-25k, 79.1% for AGIs $25k-50k, 76.8% for AGIs $50k-75k, 75.0% for AGIs $75k-100k, 47.8% for AGIs over 100k)
Taxable interest for individuals: $1,891 (reported on 52.7% of returns)
This zip code:
$1,891
Illinois:
$2,101
(% of AGI for various income ranges: 30.8% for AGIs below $10k, 4.7% for AGIs $10k-25k, 1.8% for AGIs $25k-50k, 2.5% for AGIs $50k-75k, 2.9% for AGIs $75k-100k, 1.4% for AGIs over 100k)
Taxable dividends: $1,280 (reported on 21.5% of returns)
Here:
$1,280
State:
$4,306
(% of AGI for various income ranges: 5.9% for AGIs below $10k, 1.3% for AGIs $10k-25k, 0.8% for AGIs $25k-50k, 0.5% for AGIs $50k-75k, 0.7% for AGIs $75k-100k, 0.5% for AGIs over 100k)
Net capital gain/loss: +$5,438 (reported on 18.5% of returns)
Here:
+$5,438
State:
+$17,321
(% of AGI for various income ranges: 0.0% for AGIs below $10k, 0.7% for AGIs $10k-25k, 0.5% for AGIs $25k-50k, 1.3% for AGIs $50k-75k, 2.1% for AGIs $75k-100k, 8.9% for AGIs over 100k)
Profit/loss from business: +$3,111 (reported on 19.0% of returns)
Here:
+$3,111
State:
+$11,771
(% of AGI for various income ranges: -202.1% for AGIs below $10k, 9.7% for AGIs $10k-25k, 3.1% for AGIs $25k-50k, 2.6% for AGIs $50k-75k, -0.2% for AGIs $75k-100k, 1.0% for AGIs over 100k)
Profit/loss from farming: +$3,769 (reported on 7.4% of returns)
Here:
+$3,769
State:
+$2,327
(% of AGI for various income ranges: -42.2% for AGIs below $10k, -1.3% for AGIs $10k-25k, 0.7% for AGIs $25k-50k, 1.2% for AGIs $50k-75k, 3.7% for AGIs $75k-100k)
IRA payment deduction: $2,333 (reported on 2.9% of returns)
61030:
$2,333
Illinois:
$3,087
Total itemized deductions: $15,106 (24% of AGI, reported on 26.1% of returns)
Here:
$15,106
State:
$20,239
Here:
23.8% of AGI
State:
19.5% of AGI
(% of AGI for various income ranges: 44.7% for AGIs below $10k, 10.3% for AGIs $10k-25k, 10.4% for AGIs $25k-50k, 9.0% for AGIs $50k-75k, 11.2% for AGIs $75k-100k, 10.5% for AGIs over 100k)
Charity contributions deductions: $3,200 (5% of AGI, reported on 21.5% of returns)
Here:
$3,200
State:
$3,719
Here:
4.7% of AGI
State:
3.4% of AGI
(% of AGI for various income ranges: 1.7% for AGIs $10k-25k, 1.5% for AGIs $25k-50k, 1.5% for AGIs $50k-75k, 1.6% for AGIs $75k-100k, 3.0% for AGIs over 100k)
Total tax: $4,990 (reported on 74.9% of returns)
61030:
$4,990
State:
$9,882
(% of AGI for various income ranges: 9.3% for AGIs below $10k, 4.6% for AGIs $10k-25k, 6.4% for AGIs $25k-50k, 8.3% for AGIs $50k-75k, 10.9% for AGIs $75k-100k, 18.1% for AGIs over 100k)
Earned income credit: $1,710 (reported on 15.5% of returns)
Here:
$1,710
State:
$1,788
Percentage of individuals using paid preparers for their 2004 taxes: 66.3%
Here:
66%
State:
61%
(% for various income ranges: 51.9% for AGIs below $10k, 67.5% for AGIs $10k-25k, 71.4% for AGIs $25k-50k, 70.3% for AGIs $50k-75k, 66.2% for AGIs $75k-100k, 80.0% for AGIs over 100k)
Household received Food Stamps/SNAP in the past 12 months: 118 Household did not receive Food Stamps/SNAP in the past 12 months: 757
Women who had a birth in the past 12 months: 23 (5 now married, 17 unmarried) Women who did not have a birth in the past 12 months: 571 (204 now married, 368 unmarried)
Housing units in zip code 61030 with a mortgage: 433 (63 second mortgage, 50 both second mortgage and home equity loan) Houses without a mortgage: 21
Median monthly owner costs for units with a mortgage: $1,100 Median monthly owner costs for units without a mortgage: $500
Residents with income below the poverty level in 2022:
This zip code:
6.0%
Whole state:
11.9%
Residents with income below 50% of the poverty level in 2022:
This zip code:
4.7%
Whole state:
5.7%
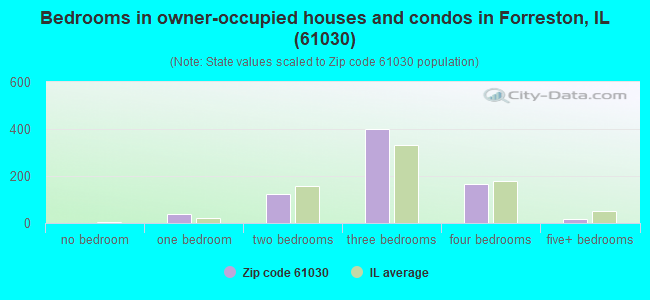
Median number of rooms in houses and condos:
Here:
6.5
State:
6.4
Median number of rooms in apartments:
Here:
4.8
State:
4.1
Notable locations in this zip code not listed on our city pages
Notable locations in zip code 61030: Forreston Station (A), B and E Farm (B), Forreston City Hall (C), Forreston Fire Protection District (D). Display/hide their locations on the map
Size of family households: 268 2-persons, 70 3-persons, 110 4-persons, 28 5-persons, 8 6-persons, 45 7-or-more-persons
Size of nonfamily households: 292 1-person, 51 2-persons, 5 3-persons
418 married couples with children.
129 single-parent households (76 men, 53 women).
98.4% of residents of 61030 zip code speak English at home.
1.0% of residents speak Spanish at home (81% very well, 19% well).
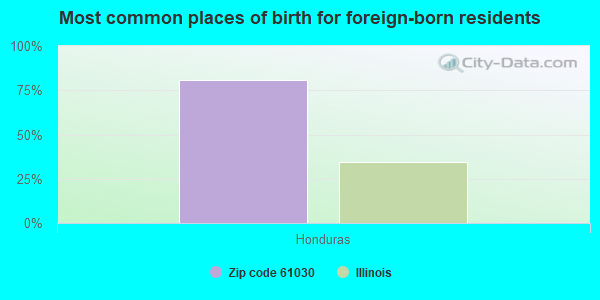
Foreign born population: 20 (0.9%) (14.4% of them are naturalized citizens)
This zip code:
0.9%
Whole state:
14.4%
81%Honduras
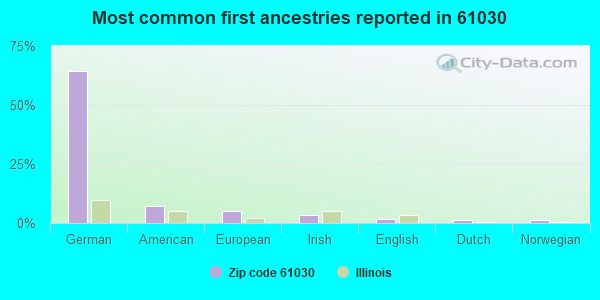
65%German
7%American
5%European
3%Irish
2%English
1%Dutch
1%Norwegian
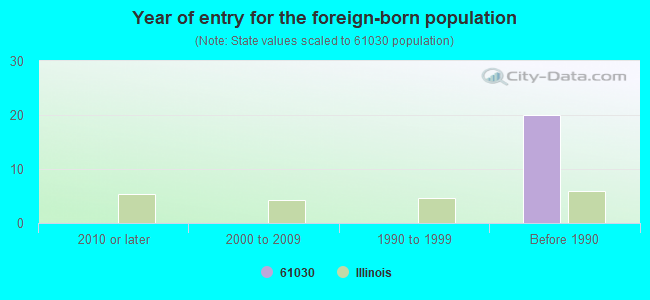
Year of entry for the foreign-born population
02010 or later
02000 to 2009
01990 to 1999
20Before 1990
Facilities with environmental interests located in this zip code:
MIDWEST TRANSPORTATION INC (11584 W. GROVE ROAD in FORRESTON, IL)
STATE MASTER (Illinois EPA Project) - National Pollutant Discharge Elimination System Permit National Pollutant Discharge Elimination System NON-MAJOR (Tracking pollutant discharge elimination systems) - permit Organizations: MIDWEST TRANSPORTATION, INC. (CONTACT/OWNER)
OGLE SERVICE CO (WHITE PINES RD in HALDANE, IL)
STATE MASTER (Illinois EPA Project) - AIR PROGRAM AIR MINOR (AIRS/AFS) Business SIC classification: PETROLEUM BULK STATIONS AND TERMINALS
MOBIL-JOHNS (302 FIRST AVE in FORRESTON, IL)
STATE MASTER (Illinois EPA Project) - SOLID WASTE PROGRAM, HAZARDOUS WASTE PROGRAM, SCRAP TIRE MANAGEMENT Conditionally Exempt Small Quantity Generators, less than 100 kg/month of hazardous waste (Resource Conservation and Recovery Act (tracking hazardous waste)) - notification Organizations: KELLEY WILLIAMSON CO (CONTACT/OWNER)
Alternative names: JOHNS MOBIL
BOCKER GRAIN INC (MAIN ST in FORRESTON, IL)
STATE MASTER (Illinois EPA Project) - AIR PROGRAM AIR MAJOR (AIRS/AFS) CRITERIA AND HAZARDOUS AIR POLLUTANT INVENTORY (Inventory of air pollution sources) Business SIC classification: GRAIN AND FIELD BEANS
OGLE SERVICE CO (ROUTE 26 NORTH in FORRESTON, IL)
(Resource Conservation and Recovery Act (tracking hazardous waste))
SAFETY CONSULTING ENGINEERS (9180 WHITE EAGLE RD in FORRESTON, IL)
ANDERSON TRANSPORTATION CO. (PO BOX 352 in FORRESTON, IL)
National Pollutant Discharge Elimination System NON-MAJOR (Tracking pollutant discharge elimination systems) - permit
MORING DISPOSAL (103 2ND AVE in FORRESTON, IL)
TRANSPORTER (Resource Conservation and Recovery Act (tracking hazardous waste)) Organizations: LARRY MORING (CONTACT/OWNER)
Housing units lacking complete plumbing facilities: 1.2% Housing units lacking complete kitchen facilities: 1.3%
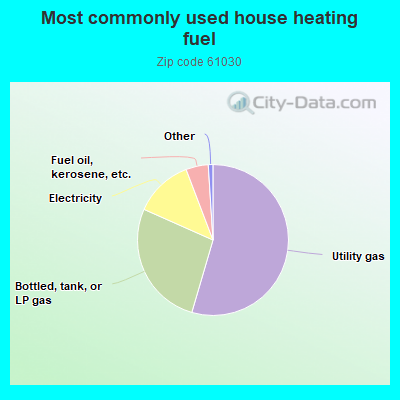
54.7%Utility gas
27.2%Bottled, tank, or LP gas
12.6%Electricity
4.8%Fuel oil, kerosene, etc.
Population in 1990: 2,261.
Place of birth for U.S.-born residents:
This state: 1,801
Northeast: 15
Midwest: 136
South: 256
West: 14
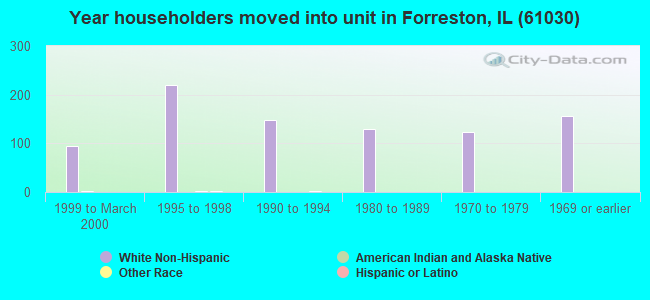
67% of the 61030 zip code residents lived in the same house 5 years ago. Out of people who lived in different houses, 49% lived in this county. Out of people who lived in different counties, 50% lived in Illinois.
96% of the 61030 zip code residents lived in the same house 1 year ago. Out of people who lived in different houses, 16% moved from this county. Out of people who lived in different houses, 87% moved from different county within same state. Out of people who lived in different houses, 4% moved from abroad.
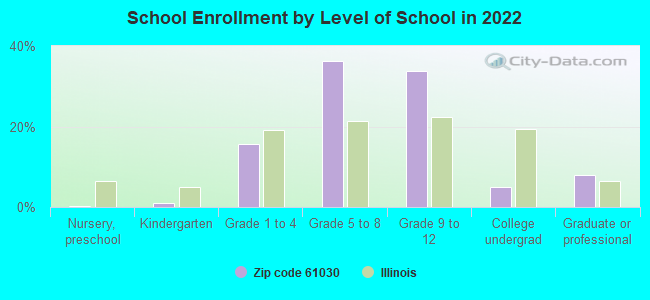
Private vs. public school enrollment:
Students in private schools in grades 1 to 8 (elementary and middle school): 17
Here:
6.2%
Illinois:
13.3%
Students in private schools in grades 9 to 12 (high school): 22
Here:
12.3%
Illinois:
9.9%
Students in private undergraduate colleges: 3
Here:
12.8%
Illinois:
27.4%
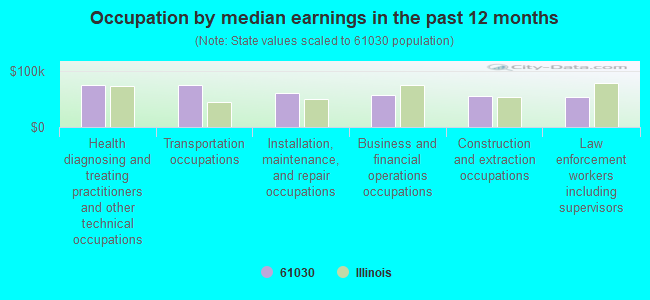
Occupation by median earnings in the past 12 months ($)
75,071Health diagnosing and treating practitioners and other technical occupations
74,858Transportation occupations
60,422Installation, maintenance, and repair occupations
57,562Business and financial operations occupations
55,477Construction and extraction occupations
54,332Law enforcement workers including supervisors
Top industries in this zip code by the number of employees in 2005:
Administrative and Support and Waste Management and Remediation Services: Solid Waste Collection (50-99 employees: 1 establishment)
Construction: Site Preparation Contractors (20-49: 1)
Wholesale Trade: Other Farm Product Raw Material Merchant Wholesalers (20-49: 1)
Health Care and Social Assistance: Offices of Dentists (10-19: 1, 1-4: 1)
Finance and Insurance: Commercial Banking (10-19: 1)
Other Services (except Public Administration): Religious Organizations (5-9: 1, 1-4: 3)
Accommodation and Food Services: Full-Service Restaurants (5-9: 1, 1-4: 2)
Fatal accident statistics in 2014:
Fatal accident count: 1
Vehicles involved in fatal accidents: 1
Fatal accidents caused by drunken drivers: 0
Fatalities: 1
Persons involved in fatal accidents: 1
Pedestrians involved in fatal accidents: 1
Fatal accident statistics in 2013:
Fatal accident count: 1
Vehicles involved in fatal accidents: 2
Fatal accidents caused by drunken drivers: 0
Fatalities: 1
Persons involved in fatal accidents: 4
Pedestrians involved in fatal accidents: 0
Home Mortgage Disclosure Act Aggregated Statistics For Year 2003 (Based on 2 partial tracts)
A) FHA, FSA/RHS & VA Home Purchase Loans
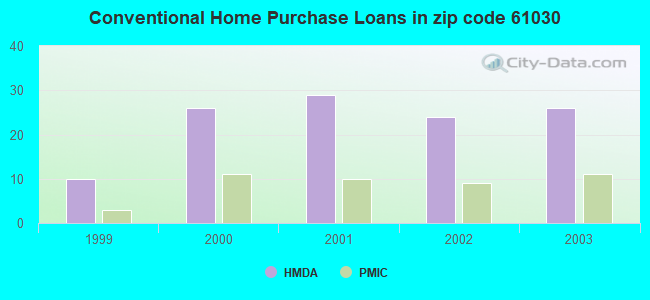
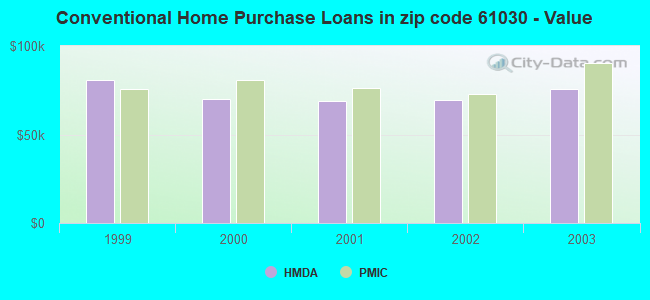
B) Conventional Home Purchase Loans
C) Refinancings
D) Home Improvement Loans
F) Non-occupant Loans on < 5 Family Dwellings (A B C & D)
Number
Average Value
Number
Average Value
Number
Average Value
Number
Average Value
Number
Average Value
LOANS ORIGINATED
7
$113,261
26
$75,680
150
$84,644
5
$14,478
14
$64,916
APPLICATIONS APPROVED, NOT ACCEPTED
0
$0
2
$61,490
8
$73,046
1
$11,340
0
$0
APPLICATIONS DENIED
0
$0
1
$118,620
31
$97,433
3
$25,293
1
$37,500
APPLICATIONS WITHDRAWN
0
$0
3
$89,257
14
$82,984
0
$0
2
$57,130
FILES CLOSED FOR INCOMPLETENESS
0
$0
1
$34,890
3
$104,373
0
$0
0
$0
Aggregated Statistics For Year 2002 (Based on 2 partial tracts)
A) FHA, FSA/RHS & VA Home Purchase Loans
B) Conventional Home Purchase Loans
C) Refinancings
D) Home Improvement Loans
E) Loans on Dwellings For 5+ Families
F) Non-occupant Loans on < 5 Family Dwellings (A B C & D)
Number
Average Value
Number
Average Value
Number
Average Value
Number
Average Value
Number
Average Value
Number
Average Value
LOANS ORIGINATED
3
$93,327
24
$69,304
146
$80,021
15
$20,933
1
$56,690
12
$41,575
APPLICATIONS APPROVED, NOT ACCEPTED
0
$0
0
$0
8
$46,336
1
$17,440
0
$0
1
$48,840
APPLICATIONS DENIED
0
$0
5
$62,972
23
$72,127
5
$18,316
0
$0
1
$33,140
APPLICATIONS WITHDRAWN
0
$0
3
$99,720
19
$89,653
0
$0
0
$0
2
$63,235
FILES CLOSED FOR INCOMPLETENESS
0
$0
0
$0
3
$80,243
1
$17,440
0
$0
0
$0
Aggregated Statistics For Year 2001 (Based on 2 partial tracts)
A) FHA, FSA/RHS & VA Home Purchase Loans
B) Conventional Home Purchase Loans
C) Refinancings
D) Home Improvement Loans
F) Non-occupant Loans on < 5 Family Dwellings (A B C & D)
Number
Average Value
Number
Average Value
Number
Average Value
Number
Average Value
Number
Average Value
LOANS ORIGINATED
4
$105,318
29
$68,753
108
$85,831
15
$14,304
8
$64,325
APPLICATIONS APPROVED, NOT ACCEPTED
1
$45,350
0
$0
4
$136,282
1
$6,110
0
$0
APPLICATIONS DENIED
0
$0
3
$39,830
24
$68,213
3
$15,700
0
$0
APPLICATIONS WITHDRAWN
0
$0
3
$102,920
11
$92,612
0
$0
0
$0
FILES CLOSED FOR INCOMPLETENESS
0
$0
0
$0
3
$75,010
0
$0
0
$0
Aggregated Statistics For Year 2000 (Based on 2 partial tracts)
A) FHA, FSA/RHS & VA Home Purchase Loans
B) Conventional Home Purchase Loans
C) Refinancings
D) Home Improvement Loans
F) Non-occupant Loans on < 5 Family Dwellings (A B C & D)
Number
Average Value
Number
Average Value
Number
Average Value
Number
Average Value
Number
Average Value
LOANS ORIGINATED
3
$58,437
26
$69,810
32
$70,130
17
$16,674
7
$38,003
APPLICATIONS APPROVED, NOT ACCEPTED
0
$0
1
$18,320
5
$51,808
4
$13,955
0
$0
APPLICATIONS DENIED
0
$0
10
$55,646
23
$80,660
7
$24,297
0
$0
APPLICATIONS WITHDRAWN
0
$0
3
$84,603
10
$68,293
0
$0
0
$0
FILES CLOSED FOR INCOMPLETENESS
0
$0
1
$16,570
3
$136,643
0
$0
0
$0
Aggregated Statistics For Year 1999 (Based on 1 partial tract)
A) FHA, FSA/RHS & VA Home Purchase Loans
B) Conventional Home Purchase Loans
C) Refinancings
D) Home Improvement Loans
F) Non-occupant Loans on < 5 Family Dwellings (A B C & D)
Detailed PMIC statistics for the following Tracts:9608.00
2002 - 2018 National Fire Incident Reporting System (NFIRS) incidents
According to the data from the years 2002 - 2018 the average number of fires per year is 13. The highest number of reported fire incidents - 25 took place in 2003, and the least - 0 in 2014. The data has an increasing trend.
When looking into fire subcategories, the most incidents belonged to: Structure Fires (44.9%), and Outside Fires (40.2%).
Fire incident types reported to NFIRS in Zip Code 61030


 Nearest zip codes: 61007, 61064, 61078, 61039, 61054, 61047.


 According to the data from the years 2002 - 2018 the average number of fires per year is 13. The highest number of reported fire incidents - 25 took place in 2003, and the least - 0 in 2014. The data has an increasing trend.
 When looking into fire subcategories, the most incidents belonged to: Structure Fires (44.9%), and Outside Fires (40.2%).