Estimated zip code population in 2022: 1,151 Zip code population in 2010: 1,460 Zip code population in 2000: 1,323
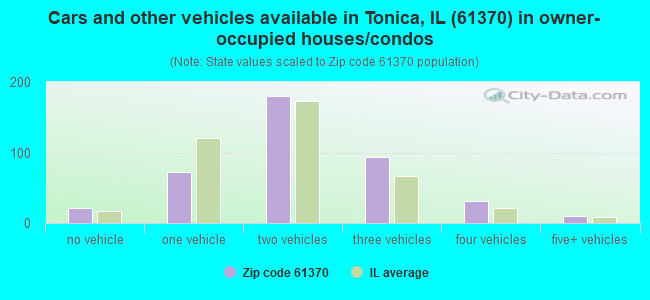
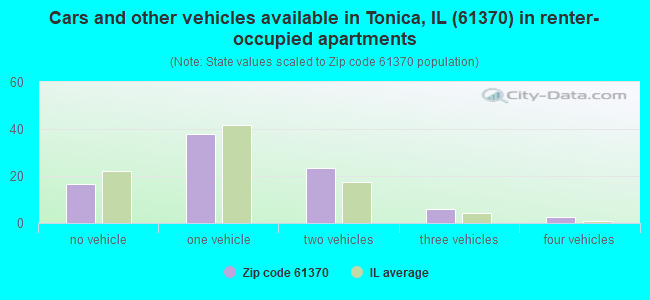
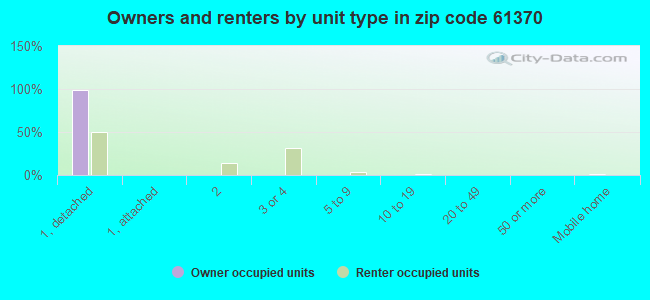
Houses and condos: 552 Renter-occupied apartments: 87
% of renters here:
18%
State:
33%
March 2022 cost of living index in zip code 61370: 84.1 (less than average, U.S. average is 100)
Land area: 52.5 sq. mi. Water area: 0.0 sq. mi.
Population density: 22 people per square mile
(very low).
OSM Map
General Map
Google Map
MSN Map
OSM Map
General Map
Google Map
MSN Map
OSM Map
General Map
Google Map
MSN Map
OSM Map
General Map
Google Map
MSN Map
Please wait while loading the map...
Real estate property taxes paid for housing units in 2022:
This zip code:
2.1% ($3,311)
Illinois:
2.0% ($4,912)
Median real estate property taxes paid for housing units with mortgages in 2022: $3,403 (2.0%) Median real estate property taxes paid for housing units with no mortgage in 2022: $3,237 (2.3%)
Business Search- 14 Million verified businesses
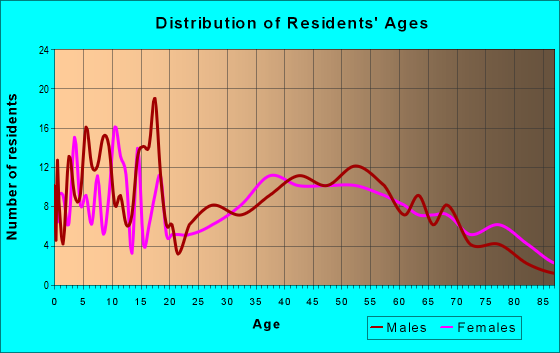
Males: 650
(56.4%)
Females: 501
(43.6%)
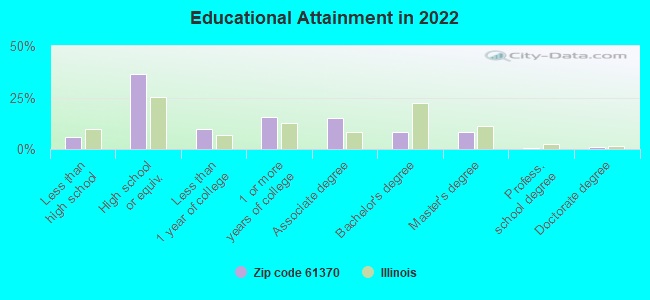
For population 25 years and over in 61370:
High school or higher: 93.2%
Bachelor's degree or higher: 17.7%
Graduate or professional degree: 9.5%
Unemployed: 1.0%
Mean travel time to work (commute): 32.7 minutes
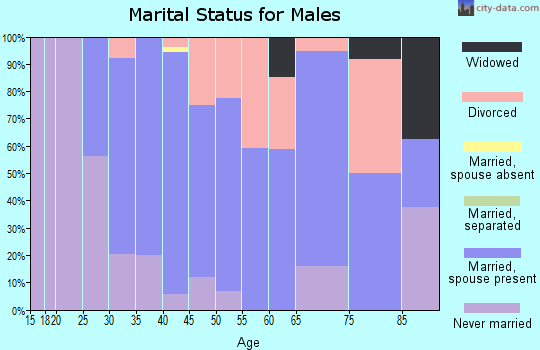
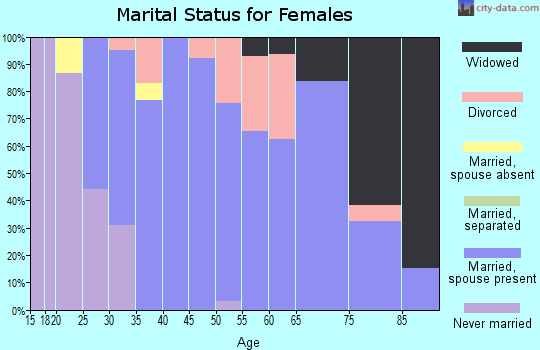
For population 15 years and over in 61370:
Never married: 30.5%
Now married: 54.0%
Separated: 1.4%
Widowed: 4.7%
Divorced: 9.4%
Zip code 61370 compared to state average:
Median house value below state average.
Unemployed percentage significantly below state average.
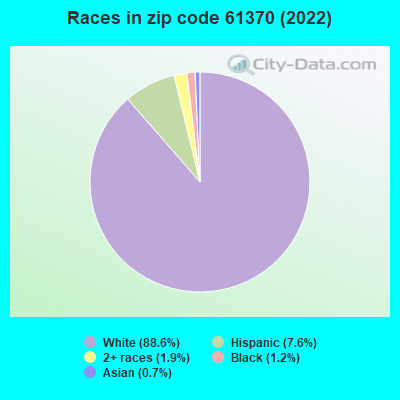
Black race population percentage significantly below state average.
Hispanic race population percentage below state average.
Foreign-born population percentage significantly below state average.
Renting percentage below state average.
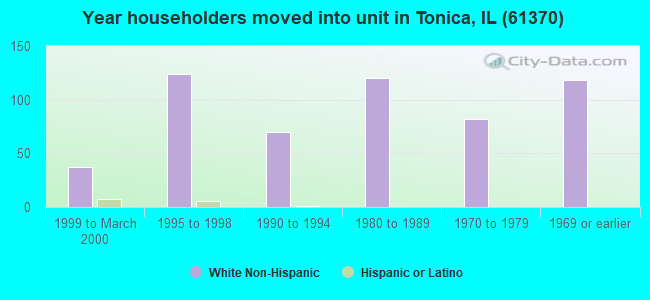
Length of stay since moving in significantly above state average.
Percentage of population with a bachelor's degree or higher below state average.
Estimated median house/condo value in 2022: $155,737
61370:
$155,737
Illinois:
$251,600
According to our research of Illinois and other state lists, there were 2 registered sex offenders living in 61370 zip code as of April 18, 2024. The ratio of all residents to sex offenders in zip code 61370 is 729 to 1. The ratio of registered sex offenders to all residents in this zip code is near the state average.
Median resident age:
This zip code:
42.2 years
Illinois median age:
39.1 years
Average household size:
This zip code:
2.3 people
Illinois:
2.4 people
Averages for the 2020 tax year for zip code 61370, filed in 2021:
Average Adjusted Gross Income (AGI) in 2020: $65,265 (Individual Income Tax Returns)
Here:
$65,265
State:
$82,626
Salary/wage: $56,932 (reported on 80.3% of returns)
Here:
$56,932
State:
$66,640
(% of AGI for various income ranges: 1410.0% for AGIs below $25k, 3084.6% for AGIs $25k-50k, 6552.9% for AGIs $50k-75k, 9076.7% for AGIs $75k-100k, 20718.8% for AGIs $100k-200k)
Taxable interest for individuals: $1,072 (reported on 45.1% of returns)
This zip code:
$1,072
Illinois:
$2,376
(% of AGI for various income ranges: 20.8% for AGIs below $25k, 19.2% for AGIs $25k-50k, 52.9% for AGIs $50k-75k, 60.0% for AGIs $75k-100k, 272.5% for AGIs $100k-200k)
Ordinary dividends: $2,841 (reported on 31.0% of returns)
Here:
$2,841
State:
$9,061
(% of AGI for various income ranges: 36.2% for AGIs below $25k, 34.6% for AGIs $25k-50k, 47.1% for AGIs $50k-75k, 195.0% for AGIs $75k-100k, 478.7% for AGIs $100k-200k)
Net capital gain/loss in AGI: +$3,319 (reported on 22.5% of returns)
Here:
+$3,319
State:
+$31,684
(% of AGI for various income ranges: 15.4% for AGIs below $25k, 16.9% for AGIs $25k-50k, 80.0% for AGIs $50k-75k, 86.7% for AGIs $75k-100k, 476.2% for AGIs $100k-200k)
Profit/loss from business: +$7,475 (reported on 11.3% of returns)
Here:
+$7,475
State:
+$12,175
(% of AGI for various income ranges: 209.2% for AGIs below $25k, 17.1% for AGIs $50k-75k, 392.5% for AGIs $100k-200k)
Taxable individual retirement arrangement distribution: $11,914 (reported on 9.9% of returns)
61370:
$11,914
Illinois:
$21,613
(% of AGI for various income ranges: 402.3% for AGIs $25k-50k, 388.8% for AGIs $100k-200k)
Earned income credit: $2,100 (reported on 11.3% of returns)
Here:
$2,100
State:
$2,311
(% of AGI for various income ranges: 73.1% for AGIs below $25k, 56.2% for AGIs $25k-50k)
Percentage of individuals using paid preparers for their 2020 taxes: 94.4%
Here:
94%
State:
93%
(% for various income ranges: 90.5% for AGIs below $25k, 93.8% for AGIs $25k-50k, 100.0% for AGIs $50k-75k, 87.5% for AGIs $75k-100k, 100.0% for AGIs $100k-200k)
Averages for the 2012 tax year for zip code 61370, filed in 2013:
Average Adjusted Gross Income (AGI) in 2012: $56,016 (Individual Income Tax Returns)
Here:
$56,016
State:
$68,058
Salary/wage: $45,302 (reported on 82.4% of returns)
Here:
$45,302
State:
$55,396
(% of AGI for various income ranges: 65.3% for AGIs below $25k, 65.8% for AGIs $25k-50k, 75.2% for AGIs $50k-75k, 72.2% for AGIs $75k-100k, 59.9% for AGIs $100k-200k)
Taxable interest for individuals: $794 (reported on 51.5% of returns)
This zip code:
$794
Illinois:
$1,969
(% of AGI for various income ranges: 1.1% for AGIs below $25k, 1.5% for AGIs $25k-50k, 0.7% for AGIs $50k-75k, 0.7% for AGIs $75k-100k, 0.5% for AGIs $100k-200k)
Ordinary dividends: $2,050 (reported on 32.4% of returns)
Here:
$2,050
State:
$7,786
(% of AGI for various income ranges: 3.6% for AGIs below $25k, 1.9% for AGIs $25k-50k, 1.3% for AGIs $50k-75k, 0.4% for AGIs $75k-100k, 0.8% for AGIs $100k-200k)
Net capital gain/loss in AGI: +$5,200 (reported on 17.6% of returns)
Here:
+$5,200
State:
+$22,183
(% of AGI for various income ranges: 4.2% for AGIs $100k-200k)
Profit/loss from business: +$5,989 (reported on 13.2% of returns)
Here:
+$5,989
State:
+$12,903
(% of AGI for various income ranges: 6.4% for AGIs below $25k, 3.8% for AGIs $25k-50k, 2.2% for AGIs $75k-100k)
Taxable individual retirement arrangement distribution: $8,100 (reported on 13.2% of returns)
61370:
$8,100
Illinois:
$17,929
(% of AGI for various income ranges: 10.0% for AGIs below $25k, 3.5% for AGIs $50k-75k, 2.1% for AGIs $75k-100k)
Total itemized deductions: $17,433 (19% of AGI, reported on 26.5% of returns)
Here:
$17,433
State:
$26,433
Here:
19.1% of AGI
State:
19.2% of AGI
(% of AGI for various income ranges: 10.6% for AGIs $25k-50k, 10.2% for AGIs $50k-75k, 6.9% for AGIs $75k-100k, 8.9% for AGIs $100k-200k)
Charity contributions: $1,607 (reported on 20.6% of returns)
Here:
$1,607
State:
$4,525
(% of AGI for various income ranges: 0.9% for AGIs below $25k, 0.6% for AGIs $50k-75k, 0.3% for AGIs $75k-100k, 0.8% for AGIs $100k-200k)
Taxes paid: $7,844 (reported on 26.5% of returns)
61370:
$7,844
State:
$11,968
(% of AGI for various income ranges: 3.5% for AGIs $25k-50k, 4.0% for AGIs $50k-75k, 3.3% for AGIs $75k-100k, 4.6% for AGIs $100k-200k)
Earned income credit: $1,738 (reported on 11.8% of returns)
Here:
$1,738
State:
$2,349
(% of AGI for various income ranges: 3.3% for AGIs below $25k, 0.9% for AGIs $25k-50k)
Percentage of individuals using paid preparers for their 2012 taxes: 66.2%
Here:
66%
State:
57%
(% for various income ranges: 54.2% for AGIs below $25k, 69.2% for AGIs $25k-50k, 75.0% for AGIs $50k-75k, 77.8% for AGIs $75k-100k, 70.0% for AGIs $100k-200k)
Averages for the 2004 tax year for zip code 61370, filed in 2005:
Average Adjusted Gross Income (AGI) in 2004: $43,684 (Individual Income Tax Returns)
Here:
$43,684
State:
$54,625
Salary/wage: $38,954 (reported on 78.4% of returns)
Here:
$38,954
State:
$46,811
(% of AGI for various income ranges: 145.2% for AGIs below $10k, 66.6% for AGIs $10k-25k, 70.3% for AGIs $25k-50k, 78.9% for AGIs $50k-75k, 79.6% for AGIs $75k-100k, 50.3% for AGIs over 100k)
Taxable interest for individuals: $1,448 (reported on 66.5% of returns)
This zip code:
$1,448
Illinois:
$2,101
(% of AGI for various income ranges: 7.2% for AGIs below $10k, 6.1% for AGIs $10k-25k, 2.4% for AGIs $25k-50k, 1.1% for AGIs $50k-75k, 1.1% for AGIs $75k-100k, 2.3% for AGIs over 100k)
Taxable dividends: $2,734 (reported on 37.1% of returns)
Here:
$2,734
State:
$4,306
(% of AGI for various income ranges: 14.0% for AGIs below $10k, 5.3% for AGIs $10k-25k, 1.9% for AGIs $25k-50k, 2.6% for AGIs $50k-75k, 1.0% for AGIs $75k-100k, 1.7% for AGIs over 100k)
Net capital gain/loss: +$2,430 (reported on 20.2% of returns)
Here:
+$2,430
State:
+$17,321
(% of AGI for various income ranges: -0.6% for AGIs below $10k, -0.5% for AGIs $10k-25k, 0.9% for AGIs $25k-50k, 0.5% for AGIs $50k-75k, -0.1% for AGIs $75k-100k, 3.6% for AGIs over 100k)
Profit/loss from business: +$5,674 (reported on 13.3% of returns)
Here:
+$5,674
State:
+$11,771
(% of AGI for various income ranges: -0.8% for AGIs $10k-25k, 2.9% for AGIs $25k-50k, 3.5% for AGIs $50k-75k, 1.5% for AGIs $75k-100k)
Profit/loss from farming: +$1,519 (reported on 8.1% of returns)
Here:
+$1,519
State:
+$2,327
(% of AGI for various income ranges: -28.4% for AGIs below $10k, 0.0% for AGIs $10k-25k, 1.3% for AGIs $25k-50k, 1.9% for AGIs $75k-100k)
IRA payment deduction: $2,680 (reported on 3.7% of returns)
61370:
$2,680
Illinois:
$3,087
Total itemized deductions: $13,391 (22% of AGI, reported on 23.4% of returns)
Here:
$13,391
State:
$20,239
Here:
22.3% of AGI
State:
19.5% of AGI
(% of AGI for various income ranges: 10.6% for AGIs $10k-25k, 8.9% for AGIs $25k-50k, 7.0% for AGIs $50k-75k, 7.7% for AGIs $75k-100k, 4.4% for AGIs over 100k)
Charity contributions deductions: $1,496 (2% of AGI, reported on 19.9% of returns)
Here:
$1,496
State:
$3,719
Here:
2.4% of AGI
State:
3.4% of AGI
(% of AGI for various income ranges: 1.4% for AGIs $10k-25k, 0.7% for AGIs $25k-50k, 0.5% for AGIs $50k-75k, 0.5% for AGIs $75k-100k, 0.7% for AGIs over 100k)
Total tax: $6,619 (reported on 76.2% of returns)
61370:
$6,619
State:
$9,882
(% of AGI for various income ranges: 3.3% for AGIs below $10k, 3.7% for AGIs $10k-25k, 7.2% for AGIs $25k-50k, 8.9% for AGIs $50k-75k, 11.1% for AGIs $75k-100k, 21.9% for AGIs over 100k)
Earned income credit: $1,441 (reported on 10.2% of returns)
Here:
$1,441
State:
$1,788
Percentage of individuals using paid preparers for their 2004 taxes: 66.2%
Here:
66%
State:
61%
(% for various income ranges: 57.1% for AGIs below $10k, 65.2% for AGIs $10k-25k, 68.3% for AGIs $25k-50k, 70.8% for AGIs $50k-75k, 70.3% for AGIs $75k-100k, 69.4% for AGIs over 100k)
Household received Food Stamps/SNAP in the past 12 months: 33 Household did not receive Food Stamps/SNAP in the past 12 months: 457
Women who had a birth in the past 12 months: 9 (6 now married, 2 unmarried) Women who did not have a birth in the past 12 months: 221 (113 now married, 107 unmarried)
Housing units in zip code 61370 with a mortgage: 236 (26 second mortgage, 3 home equity loan, 15 both second mortgage and home equity loan) Houses without a mortgage: 11
Median monthly owner costs for units with a mortgage: $1,331 Median monthly owner costs for units without a mortgage: $641
Residents with income below the poverty level in 2022:
This zip code:
8.4%
Whole state:
11.9%
Residents with income below 50% of the poverty level in 2022:
This zip code:
3.4%
Whole state:
5.7%
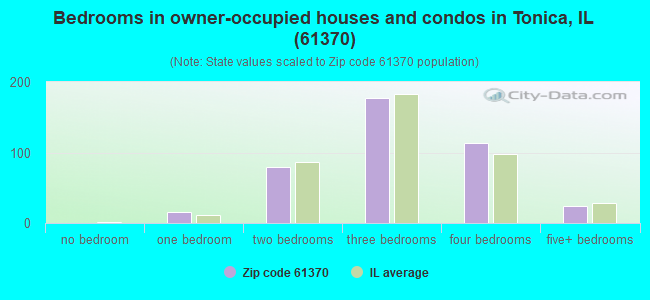
Median number of rooms in houses and condos:
Here:
6.8
State:
6.4
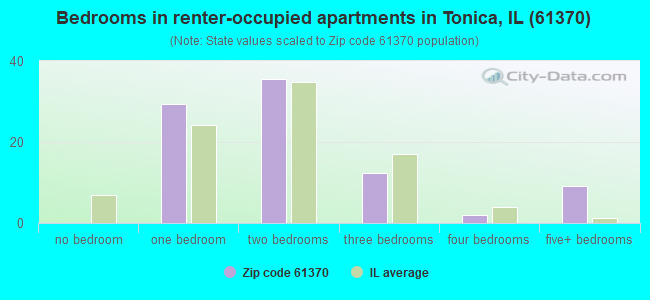
Median number of rooms in apartments:
Here:
4.6
State:
4.1
Notable locations in this zip code not listed on our city pages
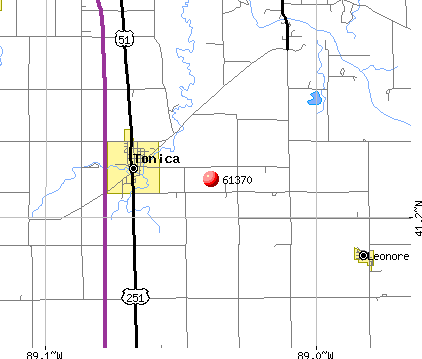
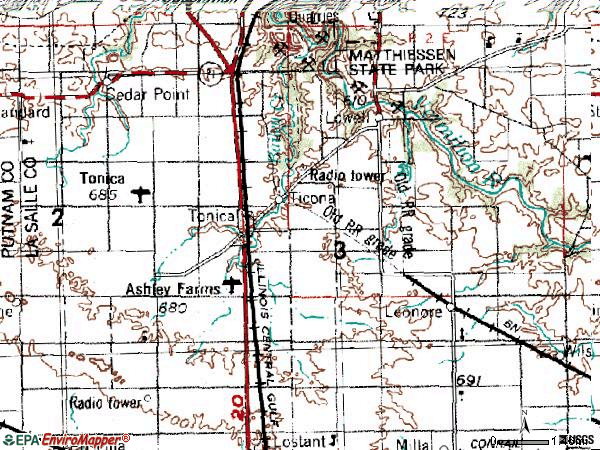
Notable locations in zip code 61370: Camp Ki Shau Wau (A), Tonica Volunteer Fire Department (B), Leonore Volunteer Fire Department (C). Display/hide their locations on the map
179 married couples with children.
50 single-parent households (18 men, 32 women).
93.5% of residents of 61370 zip code speak English at home.
4.4% of residents speak Spanish at home (80% very well, 8% well, 10% not well, 2% not at all).
0.5% of residents speak other Indo-European language at home (100% very well).
0.5% of residents speak Asian or Pacific Island language at home (83% very well, 17% well).
0.4% of residents speak other language at home (100% very well).
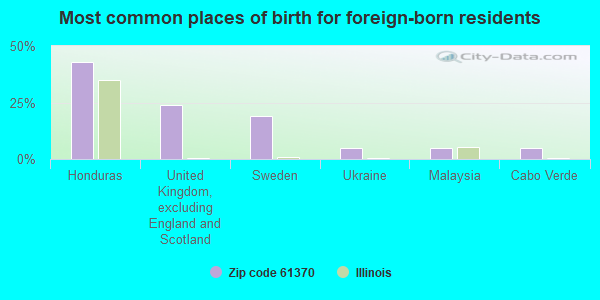
Foreign born population: 21 (1.8%) (57.4% of them are naturalized citizens)
This zip code:
1.8%
Whole state:
14.4%
43%Honduras
24%United Kingdom, excluding England and Scotland
19%Sweden
5%Ukraine
5%Malaysia
5%Cabo Verde
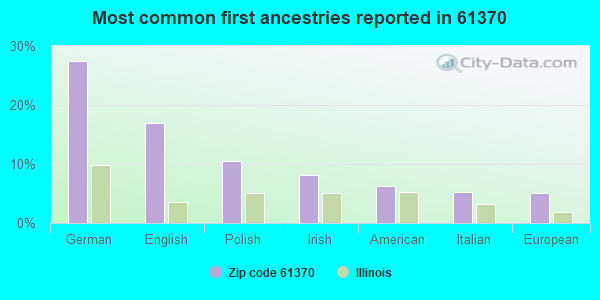
27%German
17%English
11%Polish
8%Irish
6%American
5%Italian
5%European
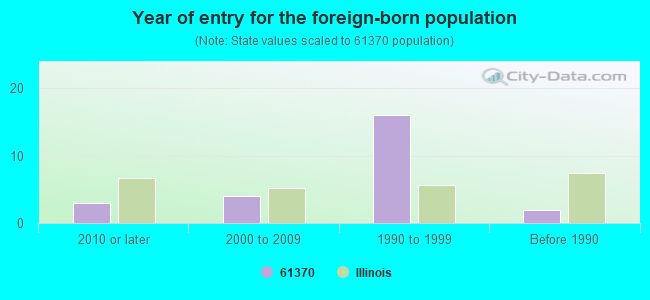
Year of entry for the foreign-born population
32010 or later
42000 to 2009
161990 to 1999
2Before 1990
Facilities with environmental interests located in this zip code:
LASALLE COUNTY FARM SUPPLY CO (502 NORTH 21ST ROAD in TONICA, IL)
STATE MASTER (Illinois EPA Project) - AIR PROGRAM AIR MINOR (AIRS/AFS) CRITERIA AND HAZARDOUS AIR POLLUTANT INVENTORY (Inventory of air pollution sources) Business SIC classification: PETROLEUM BULK STATIONS AND TERMINALS
MCCARTHY IMPROVEMENT CENTER (I-39 AND HWY 54 in TONICA, IL)
STATE MASTER (Illinois EPA Project) - AIR PROGRAM AIR MINOR (AIRS/AFS) Business SIC classification: READY-MIXED CONCRETE
RIVERSTONE GROUP INC (2273 NORTH ILLINOIS 178 in LOWELL, IL)
STATE MASTER (Illinois EPA Project) - AIR PROGRAM AIR MINOR (AIRS/AFS) CRITERIA AND HAZARDOUS AIR POLLUTANT INVENTORY (Inventory of air pollution sources) Business SIC and NAICS classification: CRUSHED AND BROKEN LIMESTONE Alternative names: MOLINE CONSUMERS COMPANY
DAUBER CO (ROUTE 1 in TONICA, IL)
STATE MASTER (Illinois EPA Project) - AIR PROGRAM AIR MINOR (AIRS/AFS) Business SIC classification: NONCLASSIFIABLE ESTABLISHMENTS
LASALLE COUNTY FARM SUPPLY COMPANY (RTE 51 in TONICA, IL)
AIR MINOR (AIRS/AFS) (Resource Conservation and Recovery Act (tracking hazardous waste)) Business SIC classification: FARM SUPPLIES
JAEGLE?WILLIAM (650 NORTH 17TH ROAD in TONICA, IL)
National Pollutant Discharge Elimination System NON-MAJOR (Tracking pollutant discharge elimination systems) - permit Alternative names: JAEGLE, WILLIAM
ICM FERTILIZER INC (HWY 51 in TONICA, IL)
Small Quantity Generators, between 100 kg and 1000 kg of hazardous waste/month (Resource Conservation and Recovery Act (tracking hazardous waste)) - notification Organizations: INTL MINLS AND CHEM (CONTACT/OWNER)
Housing units lacking complete plumbing facilities: 0.3% Housing units lacking complete kitchen facilities: 0.3%
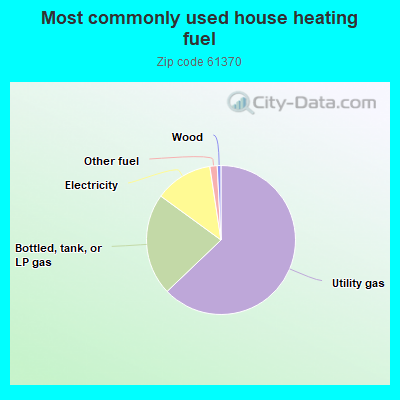
63.0%Utility gas
22.2%Bottled, tank, or LP gas
12.6%Electricity
1.6%Other fuel
0.8%Wood
Population in 1990: 1,409.
Place of birth for U.S.-born residents:
This state: 1,039
Northeast: 5
Midwest: 33
South: 27
West: 12
71% of the 61370 zip code residents lived in the same house 5 years ago. Out of people who lived in different houses, 69% lived in this county. Out of people who lived in different counties, 50% lived in Illinois.
94% of the 61370 zip code residents lived in the same house 1 year ago. Out of people who lived in different houses, 88% moved from this county. Out of people who lived in different houses, 4% moved from different county within same state. Out of people who lived in different houses, 2% moved from different state.
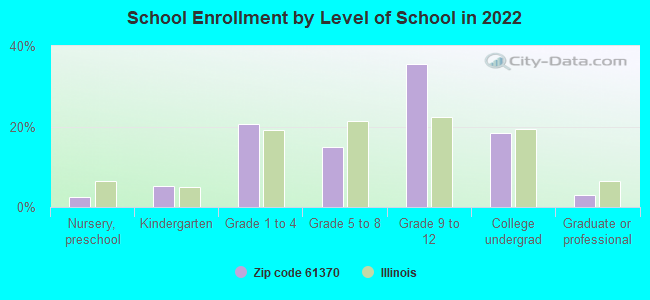
Private vs. public school enrollment:
Students in private schools in grades 1 to 8 (elementary and middle school): 11
Here:
11.0%
Illinois:
13.3%
Students in private schools in grades 9 to 12 (high school):
Here:
0.0%
Illinois:
9.9%
Students in private undergraduate colleges: 8
Here:
16.7%
Illinois:
27.4%
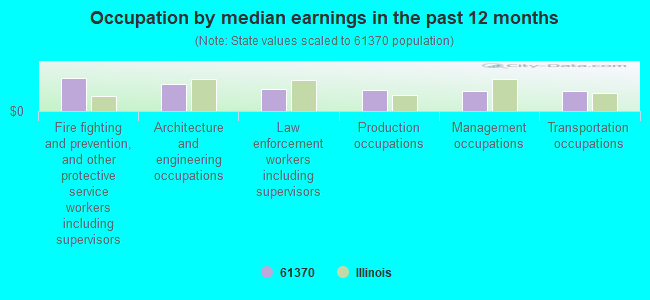
Occupation by median earnings in the past 12 months ($)
131,369Fire fighting and prevention, and other protective service workers including supervisors
105,804Architecture and engineering occupations
85,157Law enforcement workers including supervisors
82,149Production occupations
80,182Management occupations
80,174Transportation occupations
Top industries in this zip code by the number of employees in 2005:
Administrative and Support and Waste Management and Remediation Services: Landscaping Services (10-19: 1, 1-4: 1)
Health Care and Social Assistance: Offices of Dentists (5-9: 1)
Fatal accident statistics in 2014:
Fatal accident count: 1
Vehicles involved in fatal accidents: 1
Fatal accidents caused by drunken drivers: 0
Fatalities: 1
Persons involved in fatal accidents: 1
Pedestrians involved in fatal accidents: 0
Fatal accident statistics in 2010:
Fatal accident count: 1
Vehicles involved in fatal accidents: 2
Fatal accidents caused by drunken drivers: 0
Fatalities: 1
Persons involved in fatal accidents: 3
Pedestrians involved in fatal accidents: 0
2002 - 2018 National Fire Incident Reporting System (NFIRS) incidents
According to the data from the years 2002 - 2018 the average number of fire incidents per year is 13. The highest number of reported fires - 31 took place in 2012, and the least - 0 in 2005. The data has a growing trend.
When looking into fire subcategories, the most reports belonged to: Structure Fires (38.8%), and Outside Fires (34.8%).
Fire incident types reported to NFIRS in Zip Code 61370
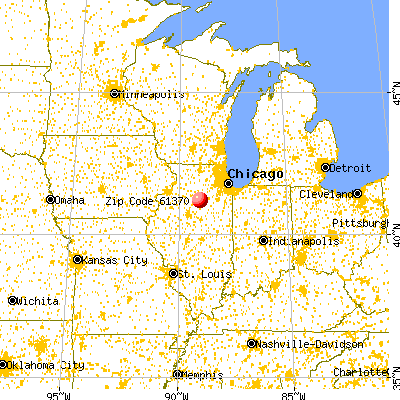


 Nearest zip codes: 61332, 61334, 61348, 61316, 61377, 61363.


 According to the data from the years 2002 - 2018 the average number of fire incidents per year is 13. The highest number of reported fires - 31 took place in 2012, and the least - 0 in 2005. The data has a growing trend.
 When looking into fire subcategories, the most reports belonged to: Structure Fires (38.8%), and Outside Fires (34.8%).