Estimated zip code population in 2022: 1,731 Zip code population in 2010: 1,742 Zip code population in 2000: 1,838
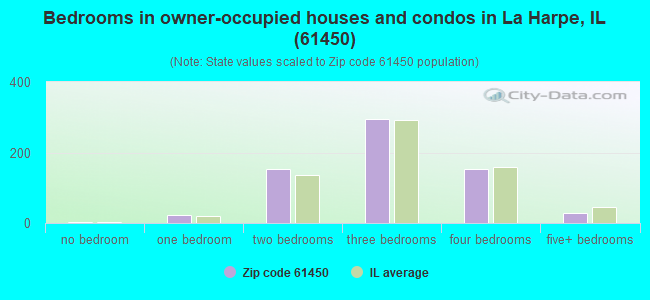
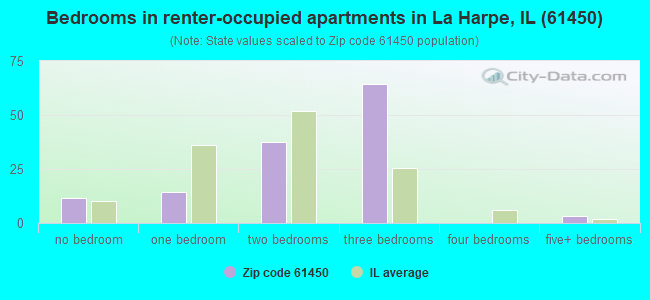
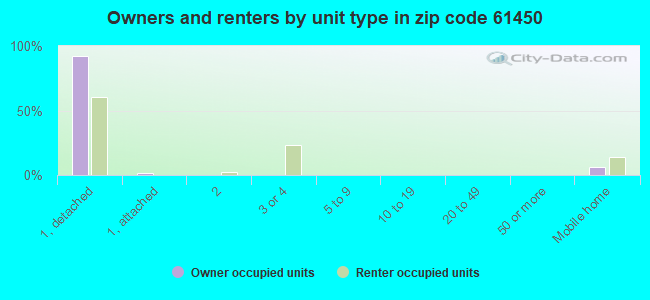
Houses and condos: 870 Renter-occupied apartments: 132
% of renters here:
17%
State:
33%
March 2022 cost of living index in zip code 61450: 83.7 (less than average, U.S. average is 100)
Land area: 83.8 sq. mi. Water area: 0.0 sq. mi.
Population density: 21 people per square mile
(very low).
OSM Map
General Map
Google Map
MSN Map
OSM Map
General Map
Google Map
MSN Map
OSM Map
General Map
Google Map
MSN Map
OSM Map
General Map
Google Map
MSN Map
Please wait while loading the map...
Real estate property taxes paid for housing units in 2022:
This zip code:
1.9% ($1,908)
Illinois:
2.0% ($4,912)
Median real estate property taxes paid for housing units with mortgages in 2022: $2,172 (2.2%) Median real estate property taxes paid for housing units with no mortgage in 2022: $1,671 (1.7%)
Business Search- 14 Million verified businesses
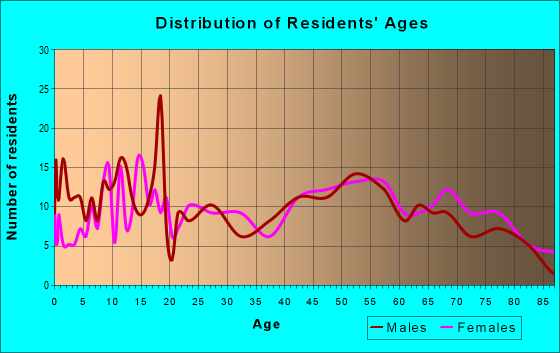
Males: 913
(52.8%)
Females: 818
(47.2%)
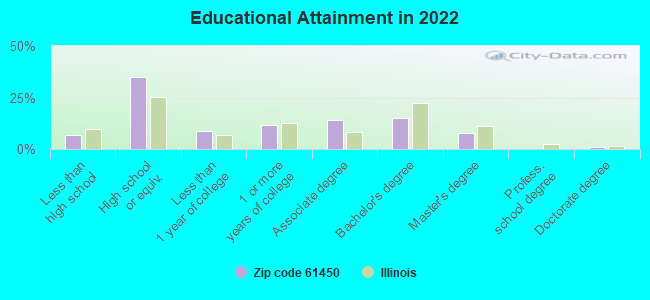
For population 25 years and over in 61450:
High school or higher: 92.1%
Bachelor's degree or higher: 23.2%
Graduate or professional degree: 8.4%
Unemployed: 3.0%
Mean travel time to work (commute): 26.0 minutes
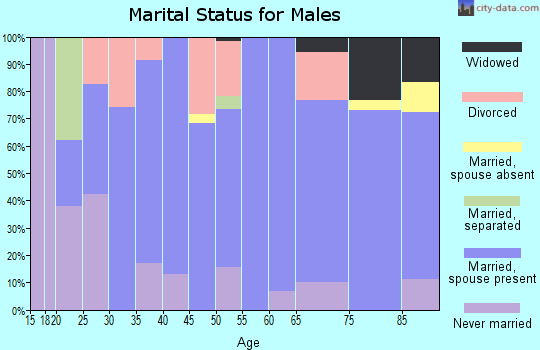
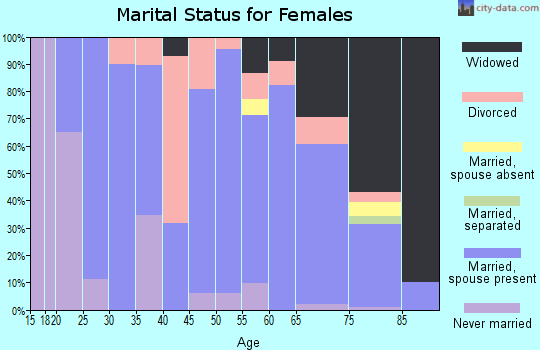
For population 15 years and over in 61450:
Never married: 15.5%
Now married: 59.7%
Separated: 0.1%
Widowed: 7.5%
Divorced: 17.2%
Zip code 61450 compared to state average:
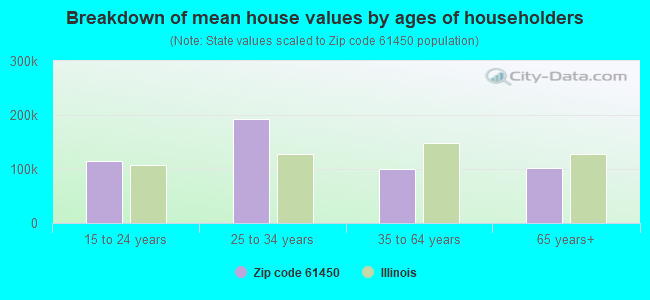
Median house value significantly below state average.
Black race population percentage significantly below state average.
Hispanic race population percentage significantly below state average.
Median age significantly above state average.
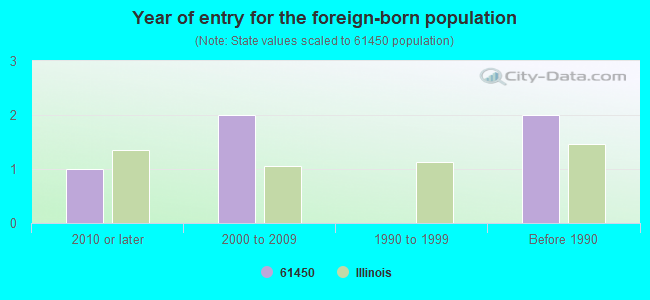
Foreign-born population percentage significantly below state average.
Renting percentage below state average.
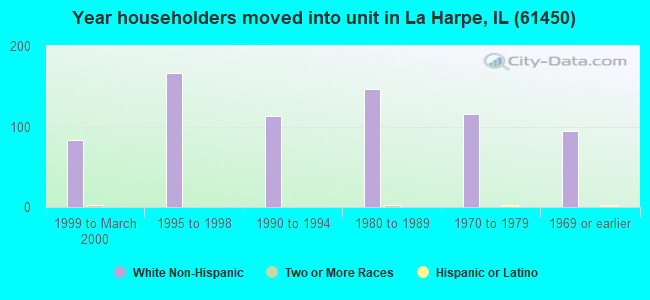
Length of stay since moving in significantly above state average.
Number of college students below state average.
Percentage of population with a bachelor's degree or higher below state average.
Averages for the 2020 tax year for zip code 61450, filed in 2021:
Average Adjusted Gross Income (AGI) in 2020: $53,888 (Individual Income Tax Returns)
Here:
$53,888
State:
$82,626
Salary/wage: $44,198 (reported on 76.3% of returns)
Here:
$44,198
State:
$66,640
(% of AGI for various income ranges: 1021.8% for AGIs below $25k, 3535.6% for AGIs $25k-50k, 5970.0% for AGIs $50k-75k, 9085.0% for AGIs $75k-100k, 16028.0% for AGIs $100k-200k)
Taxable interest for individuals: $1,250 (reported on 39.5% of returns)
This zip code:
$1,250
Illinois:
$2,376
(% of AGI for various income ranges: 24.1% for AGIs below $25k, 66.2% for AGIs $25k-50k, 98.8% for AGIs $50k-75k, 115.0% for AGIs $75k-100k, 160.0% for AGIs $100k-200k)
Ordinary dividends: $2,786 (reported on 18.4% of returns)
Here:
$2,786
State:
$9,061
(% of AGI for various income ranges: 45.0% for AGIs $25k-50k, 66.2% for AGIs $50k-75k, 96.7% for AGIs $75k-100k, 414.0% for AGIs $100k-200k)
Net capital gain/loss in AGI: +$5,900 (reported on 14.5% of returns)
Here:
+$5,900
State:
+$31,684
(% of AGI for various income ranges: 106.9% for AGIs $25k-50k, 181.7% for AGIs $75k-100k, 738.0% for AGIs $100k-200k)
Profit/loss from business: +$5,564 (reported on 14.5% of returns)
Here:
+$5,564
State:
+$12,175
(% of AGI for various income ranges: 142.9% for AGIs below $25k, 157.5% for AGIs $25k-50k, 195.0% for AGIs $75k-100k)
Taxable individual retirement arrangement distribution: $11,767 (reported on 11.8% of returns)
61450:
$11,767
Illinois:
$21,613
(% of AGI for various income ranges: 69.4% for AGIs below $25k, 170.6% for AGIs $25k-50k, 1113.3% for AGIs $75k-100k)
Earned income credit: $2,167 (reported on 15.8% of returns)
Here:
$2,167
State:
$2,311
(% of AGI for various income ranges: 78.2% for AGIs below $25k, 79.4% for AGIs $25k-50k)
Percentage of individuals using paid preparers for their 2020 taxes: 90.8%
Here:
91%
State:
93%
(% for various income ranges: 91.7% for AGIs below $25k, 90.9% for AGIs $25k-50k, 90.9% for AGIs $50k-75k, 88.9% for AGIs $75k-100k, 90.0% for AGIs $100k-200k)
Averages for the 2012 tax year for zip code 61450, filed in 2013:
Average Adjusted Gross Income (AGI) in 2012: $46,784 (Individual Income Tax Returns)
Here:
$46,784
State:
$68,058
Salary/wage: $35,398 (reported on 81.0% of returns)
Here:
$35,398
State:
$55,396
(% of AGI for various income ranges: 70.2% for AGIs below $25k, 76.0% for AGIs $25k-50k, 72.2% for AGIs $50k-75k, 71.1% for AGIs $75k-100k, 34.3% for AGIs $100k-200k)
Taxable interest for individuals: $964 (reported on 41.8% of returns)
This zip code:
$964
Illinois:
$1,969
(% of AGI for various income ranges: 2.1% for AGIs below $25k, 0.8% for AGIs $25k-50k, 0.6% for AGIs $50k-75k, 0.6% for AGIs $75k-100k, 0.8% for AGIs $100k-200k)
Ordinary dividends: $1,546 (reported on 16.5% of returns)
Here:
$1,546
State:
$7,786
(% of AGI for various income ranges: 0.8% for AGIs below $25k, 0.7% for AGIs $25k-50k, 0.6% for AGIs $50k-75k, 0.6% for AGIs $100k-200k)
Net capital gain/loss in AGI: +$4,870 (reported on 12.7% of returns)
Here:
+$4,870
State:
+$22,183
(% of AGI for various income ranges: 0.2% for AGIs $50k-75k, 4.3% for AGIs $100k-200k)
Profit/loss from business: +$5,282 (reported on 13.9% of returns)
Here:
+$5,282
State:
+$12,903
(% of AGI for various income ranges: 3.7% for AGIs below $25k, 1.0% for AGIs $25k-50k, 4.2% for AGIs $50k-75k)
Taxable individual retirement arrangement distribution: $6,389 (reported on 11.4% of returns)
61450:
$6,389
Illinois:
$17,929
(% of AGI for various income ranges: 4.1% for AGIs below $25k, 1.7% for AGIs $25k-50k, 3.3% for AGIs $50k-75k)
Total itemized deductions: $17,538 (20% of AGI, reported on 16.5% of returns)
Here:
$17,538
State:
$26,433
Here:
19.5% of AGI
State:
19.2% of AGI
(% of AGI for various income ranges: 6.9% for AGIs $25k-50k, 10.3% for AGIs $50k-75k, 7.6% for AGIs $100k-200k)
Charity contributions: $6,312 (reported on 10.1% of returns)
Here:
$6,312
State:
$4,525
(% of AGI for various income ranges: 2.0% for AGIs below $25k, 1.4% for AGIs $50k-75k, 2.8% for AGIs $100k-200k)
Taxes paid: $5,892 (reported on 16.5% of returns)
61450:
$5,892
State:
$11,968
(% of AGI for various income ranges: 1.8% for AGIs $25k-50k, 3.1% for AGIs $50k-75k, 3.2% for AGIs $100k-200k)
Earned income credit: $2,285 (reported on 16.5% of returns)
Here:
$2,285
State:
$2,349
(% of AGI for various income ranges: 5.2% for AGIs below $25k, 1.3% for AGIs $25k-50k)
Percentage of individuals using paid preparers for their 2012 taxes: 75.9%
Here:
76%
State:
57%
(% for various income ranges: 71.0% for AGIs below $25k, 71.4% for AGIs $25k-50k, 78.6% for AGIs $50k-75k, 85.7% for AGIs $75k-100k, 100.0% for AGIs $100k-200k)
Averages for the 2004 tax year for zip code 61450, filed in 2005:
Average Adjusted Gross Income (AGI) in 2004: $32,431 (Individual Income Tax Returns)
Here:
$32,431
State:
$54,625
Salary/wage: $28,279 (reported on 83.8% of returns)
Here:
$28,279
State:
$46,811
(% of AGI for various income ranges: 105.3% for AGIs below $10k, 68.3% for AGIs $10k-25k, 77.9% for AGIs $25k-50k, 76.7% for AGIs $50k-75k, 80.0% for AGIs $75k-100k, 47.8% for AGIs over 100k)
Taxable interest for individuals: $1,355 (reported on 48.7% of returns)
This zip code:
$1,355
Illinois:
$2,101
(% of AGI for various income ranges: 8.8% for AGIs below $10k, 3.6% for AGIs $10k-25k, 1.9% for AGIs $25k-50k, 1.8% for AGIs $50k-75k, 0.4% for AGIs $75k-100k, 1.2% for AGIs over 100k)
Taxable dividends: $1,333 (reported on 21.2% of returns)
Here:
$1,333
State:
$4,306
(% of AGI for various income ranges: 4.4% for AGIs below $10k, 1.1% for AGIs $10k-25k, 0.3% for AGIs $25k-50k, 0.7% for AGIs $50k-75k, 0.6% for AGIs $75k-100k, 1.7% for AGIs over 100k)
Net capital gain/loss: +$4,443 (reported on 15.7% of returns)
Here:
+$4,443
State:
+$17,321
(% of AGI for various income ranges: -1.4% for AGIs below $10k, -0.2% for AGIs $10k-25k, 0.9% for AGIs $25k-50k, -0.1% for AGIs $50k-75k, 0.1% for AGIs $75k-100k, 14.5% for AGIs over 100k)
Profit/loss from business: +$3,053 (reported on 18.1% of returns)
Here:
+$3,053
State:
+$11,771
(% of AGI for various income ranges: 2.0% for AGIs below $10k, 2.6% for AGIs $10k-25k, 3.2% for AGIs $25k-50k, 1.2% for AGIs $50k-75k, -0.1% for AGIs $75k-100k)
IRA payment deduction: $2,812 (reported on 1.9% of returns)
61450:
$2,812
Illinois:
$3,087
Total itemized deductions: $15,989 (23% of AGI, reported on 10.7% of returns)
Here:
$15,989
State:
$20,239
Here:
23.3% of AGI
State:
19.5% of AGI
(% of AGI for various income ranges: 5.8% for AGIs $10k-25k, 3.3% for AGIs $25k-50k, 5.1% for AGIs $50k-75k, 9.0% for AGIs $75k-100k, 6.9% for AGIs over 100k)
Charity contributions deductions: $4,901 (6% of AGI, reported on 8.5% of returns)
Here:
$4,901
State:
$3,719
Here:
6.5% of AGI
State:
3.4% of AGI
(% of AGI for various income ranges: 1.0% for AGIs $25k-50k, 1.8% for AGIs $50k-75k, 1.9% for AGIs $75k-100k, 2.0% for AGIs over 100k)
Total tax: $3,804 (reported on 72.3% of returns)
61450:
$3,804
State:
$9,882
(% of AGI for various income ranges: 2.6% for AGIs below $10k, 3.8% for AGIs $10k-25k, 6.1% for AGIs $25k-50k, 8.8% for AGIs $50k-75k, 10.7% for AGIs $75k-100k, 17.2% for AGIs over 100k)
Earned income credit: $1,504 (reported on 16.0% of returns)
Here:
$1,504
State:
$1,788
Percentage of individuals using paid preparers for their 2004 taxes: 78.0%
Here:
78%
State:
61%
(% for various income ranges: 72.3% for AGIs below $10k, 77.4% for AGIs $10k-25k, 79.7% for AGIs $25k-50k, 81.8% for AGIs $50k-75k, 79.5% for AGIs $75k-100k, 92.3% for AGIs over 100k)
Household received Food Stamps/SNAP in the past 12 months: 93 Household did not receive Food Stamps/SNAP in the past 12 months: 689
Women who had a birth in the past 12 months: 35 (35 now married, 0 unmarried) Women who did not have a birth in the past 12 months: 274 (108 now married, 166 unmarried)
Housing units in zip code 61450 with a mortgage: 287 (19 second mortgage, 20 both second mortgage and home equity loan) Median monthly owner costs for units with a mortgage: $864 Median monthly owner costs for units without a mortgage: $448
Residents with income below the poverty level in 2022:
This zip code:
9.2%
Whole state:
11.9%
Residents with income below 50% of the poverty level in 2022:
This zip code:
1.0%
Whole state:
5.7%
Median number of rooms in houses and condos:
Here:
6.7
State:
6.4
Median number of rooms in apartments:
Here:
5.4
State:
4.1
Notable locations in this zip code not listed on our city pages
Notable locations in zip code 61450: La Harpe Ambulance Service (A), La Harpe Fire Protection District Station 1 (B). Display/hide their locations on the map
Cemeteries: Vandruff Cemetery (1), McConnell Cemetery (2), Hillsborough Cemetery (3), LaHarpe City Cemetery (4), Old Bedford Cemetery (5), Chapel Cemetery (6). Display/hide their locations on the map
Rivers and creeks: Baptist Creek (A), Rock Creek (B), Little Creek (C), Voel Creek (D), South Branch La Moine River (E), Wildcat Creek (F), Spring Creek (G). Display/hide their locations on the map
In group quarters: 26 (-1 institutionalized population)
Size of family households: 331 2-persons, 83 3-persons, 56 4-persons, 40 5-persons, 2 6-persons, 6 7-or-more-persons
Size of nonfamily households: 264 1-person
201 married couples with children.
112 single-parent households (13 men, 99 women).
99.1% of residents of 61450 zip code speak English at home.
0.5% of residents speak Spanish at home (62% very well, 38% not well).
0.4% of residents speak other Indo-European language at home (50% very well, 50% well).
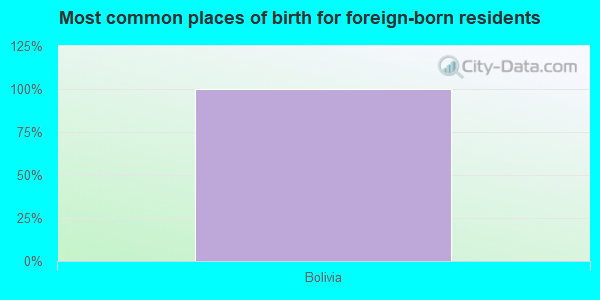
Foreign born population: 4 (0.2%) (75.2% of them are naturalized citizens)
This zip code:
0.2%
Whole state:
14.4%
100%Bolivia
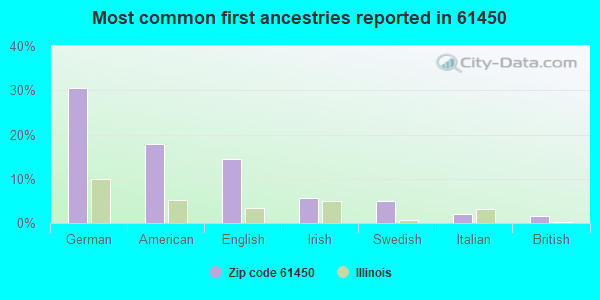
31%German
18%American
14%English
6%Irish
5%Swedish
2%Italian
2%British
Year of entry for the foreign-born population
12010 or later
22000 to 2009
01990 to 1999
2Before 1990
Facilities with environmental interests located in this zip code:
LA HARPE CUSD #335 (205 N D ST in LAHARPE, IL)
STATE MASTER (Illinois EPA Project) - SOLID WASTE PROGRAM, AIR PROGRAM AIR MINOR (AIRS/AFS) CRITERIA AND HAZARDOUS AIR POLLUTANT INVENTORY (Inventory of air pollution sources) Business SIC classification: ELEMENTARY AND SECONDARY SCHOOLS Alternative names: LA HARPE CUSD 335
HANCOCK SERVICE CO (CITY OF LAHARPE in LAHARPE, IL)
STATE MASTER (Illinois EPA Project) - AIR PROGRAM AIR MINOR (AIRS/AFS) Business SIC classification: FERTILIZERS, MIXING ONLY
HILLYER INC (RT 94 N in LAHARPE, IL)
STATE MASTER (Illinois EPA Project) - AIR PROGRAM AIR MINOR (AIRS/AFS) Business SIC classification: READY-MIXED CONCRETE Alternative names: LAHARPE READY MIX PLT
LAHARPE STP (2702 NORTH COUNTY ROAD 2730 in LAHARPE, IL)
STATE MASTER (Illinois EPA Project) - National Pollutant Discharge Elimination System Permit National Pollutant Discharge Elimination System NON-MAJOR (Tracking pollutant discharge elimination systems) - permit Business SIC classification: SEWERAGE SYSTEMS Alternative names: LAHARPE STP, CITY OF
LAHARPE WTP (NORTH OF LAHARPE in LAHARPE, IL)
STATE MASTER (Illinois EPA Project) - National Pollutant Discharge Elimination System Permit National Pollutant Discharge Elimination System NON-MAJOR (Tracking pollutant discharge elimination systems) - permit Business SIC classification: WATER SUPPLY Alternative names: LAHARPE WTP, CITY OF
LA HARPE CUSD 335 (404 W MAIN ST in LA HARPE, IL)
STATE MASTER (Illinois EPA Project) - SOLID WASTE PROGRAM Small Quantity Generators, between 100 kg and 1000 kg of hazardous waste/month (Resource Conservation and Recovery Act (tracking hazardous waste)) - notification Organizations: LAHARPE COMMUNITY UNIT SCHOOL DIST (CONTACT/OWNER)
Alternative names: LAHARPE CUSD #335
LA HARPE HIGH SCHOOL (404 W MAIN in LA HARPE, IL)
(Geographic Names Information System) (National Center for Education Statistics) - STATE ID-2603433500001 Organizations: LAHARPE COMM UNIT SCH DIST 335 (SCHOOL DISTRICT)
LAHARPE ELEMENTARY SCHOOL (404 W MAIN in LA HARPE, IL)
(National Center for Education Statistics) - STATE ID-2603433502005 Organizations: LAHARPE COMM UNIT SCH DIST 335 (SCHOOL DISTRICT)
LAHARPE JUNIOR HIGH SCHOOL (404 W MAIN in LA HARPE, IL)
(National Center for Education Statistics) - STATE ID-2603433501001 Organizations: LAHARPE COMM UNIT SCH DIST 335 (SCHOOL DISTRICT)
HANCOCK SERVICE CO (RR 2 in LA HARPE, IL)
(Resource Conservation and Recovery Act (tracking hazardous waste)) Organizations: HANCOCK SERVICE COMPANY (CONTACT/OWNER)
LA HARPE HOSPITAL (101 NORTH B STREET in LA HARPE, IL)
AIR MINOR (AIRS/AFS) CRITERIA AND HAZARDOUS AIR POLLUTANT INVENTORY (Inventory of air pollution sources) Business SIC and NAICS classification: GENERAL MEDICAL AND SURGICAL HOSPITALS Alternative names: LA HARPE HOSPITAL ASSOCIATION
LA HARPE ELEVATOR (PO BOX 559 in LA HARPE, IL)
AIR MINOR (AIRS/AFS) CRITERIA AND HAZARDOUS AIR POLLUTANT INVENTORY (Inventory of air pollution sources) Business SIC classification: GRAIN AND FIELD BEANS
LAHARPE COMM UNIT SCH DIST 335 (BOX 545 in LA HARPE, IL)
COMPLIANCE ACTIVITY (Tracking inspections of insecticide, fungicide, and rodenticide, and toxic substances)
Housing units lacking complete kitchen facilities: 2.8%
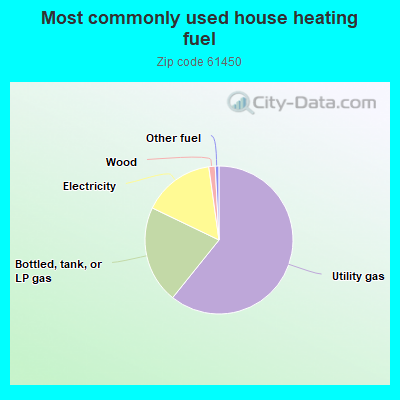
60.9%Utility gas
21.4%Bottled, tank, or LP gas
15.7%Electricity
1.4%Wood
0.8%Other fuel
Population in 1990: 1,686. Population change in the 1990s: +152 (+9.0%).
Place of birth for U.S.-born residents:
This state: 1,073
Northeast: 9
Midwest: 517
South: 43
West: 84
66% of the 61450 zip code residents lived in the same house 5 years ago. Out of people who lived in different houses, 63% lived in this county. Out of people who lived in different counties, 50% lived in Illinois.
94% of the 61450 zip code residents lived in the same house 1 year ago. Out of people who lived in different houses, 53% moved from this county. Out of people who lived in different houses, 47% moved from different state.
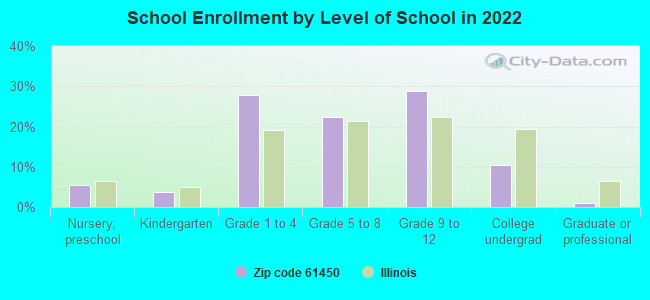
Private vs. public school enrollment:
Students in private schools in grades 1 to 8 (elementary and middle school): 6
Here:
4.4%
Illinois:
13.3%
Students in private schools in grades 9 to 12 (high school): 4
Here:
6.0%
Illinois:
9.9%
Students in private undergraduate colleges:
Here:
0.0%
Illinois:
27.4%
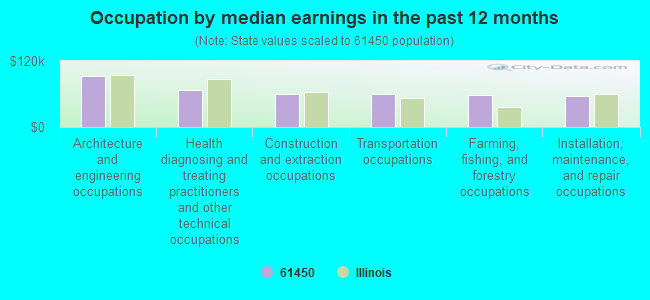
Occupation by median earnings in the past 12 months ($)
93,145Architecture and engineering occupations
67,262Health diagnosing and treating practitioners and other technical occupations
60,896Construction and extraction occupations
59,335Transportation occupations
58,617Farming, fishing, and forestry occupations
56,572Installation, maintenance, and repair occupations
Companies with federal contracts located in this zip code:
HOUSEWRIGHT LUMBER CO (301 E MAIN STREET in LA HARPE, IL; small business) : $1,320,373 in 13 contractsfrom 2000 to 2004
Contracts for Construction of Structures and Facilities -- Other Administrative Facilities and Service Buildings, Construction of Structures and Facilities -- Other Conservation and Development Facilities, Maintenance, Repair or Alteration of Real Property -- Other Non-Building Facilities, Maintenance, Repair or Alteration of Real Property -- Other Warehouse Buildings, and moreby Army, U.S. Army Corps of Engineers - civil program financing only Signed by year:2000: $413,416; 2001: $37,330; 2002: $128,301; 2003: $608,430; 2004: $132,896; 2005: $0; 2006: $0.
Biggest contracts:
$607,730 with Army for Construction of Structures and Facilities -- Other Administrative Facilities and Service Buildings. Taking place in IA. Signed on 2003-09-24. Completion date: 2004-04-21.
$341,479 with Army for Construction of Structures and Facilities -- Other Conservation and Development Facilities. Taking place in IA. Signed on 2000-03-31. Completion date: 2000-11-30.
$128,301 with U.S. Army Corps of Engineers - civil program financing only for Maintenance, Repair or Alteration of Real Property -- Other Non-Building Facilities. Signed on 2002-10-07. Completion date: 2002-12-16.
$71,937 with Army for Maintenance, Repair or Alteration of Real Property -- Other Warehouse Buildings. Taking place in IA. Signed on 2000-06-01. Completion date: 1999-12-31.
Top industries in this zip code by the number of employees in 2005:
Health Care and Social Assistance: Nursing Care Facilities (20-49: 1, 1-4: 1)
Accommodation and Food Services: Limited-Service Restaurants (10-19: 1, 1-4: 1)
Construction: Commercial and Institutional Building Construction (10-19: 1)
Other Services (except Public Administration): Religious Organizations (5-9: 1, 1-4: 2)
Construction: Plumbing, Heating, and Air-Conditioning Contractors (5-9: 1, 1-4: 2)
People in group quarters in 2010:
35 people in nursing facilities/skilled-nursing facilities
People in group quarters in 2000:
44 people in nursing homes
Fatal accident statistics in 2013:
Fatal accident count: 1
Vehicles involved in fatal accidents: 2
Fatal accidents caused by drunken drivers: 0
Fatalities: 1
Persons involved in fatal accidents: 2
Pedestrians involved in fatal accidents: 0
2002 - 2018 National Fire Incident Reporting System (NFIRS) incidents
Based on the data from the years 2002 - 2018 the average number of fires per year is 15. The highest number of fires - 31 took place in 2006, and the least - 7 in 2002. The data has a growing trend.
When looking into fire subcategories, the most incidents belonged to: Outside Fires (62.5%), and Structure Fires (22.1%).
Fire incident types reported to NFIRS in Zip Code 61450
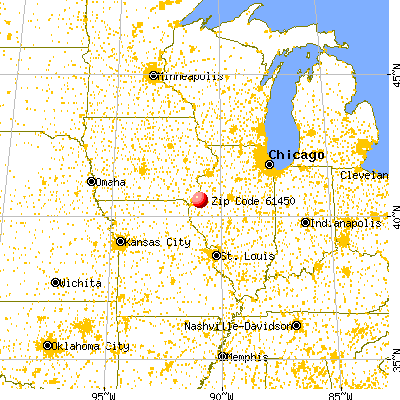


 Nearest zip codes: 61420, 61454, 62330, 61480, 62374, 61471.


 Based on the data from the years 2002 - 2018 the average number of fires per year is 15. The highest number of fires - 31 took place in 2006, and the least - 7 in 2002. The data has a growing trend.
 When looking into fire subcategories, the most incidents belonged to: Outside Fires (62.5%), and Structure Fires (22.1%).