Estimated zip code population in 2022: 1,289 Zip code population in 2010: 1,667 Zip code population in 2000: 1,772
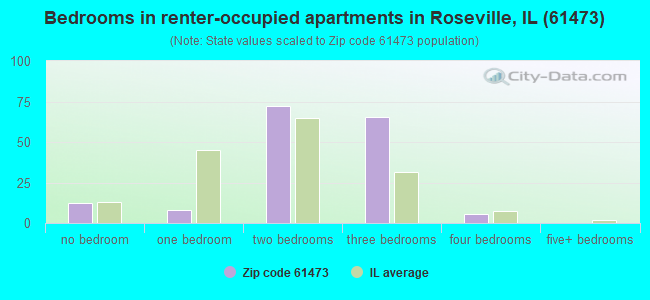
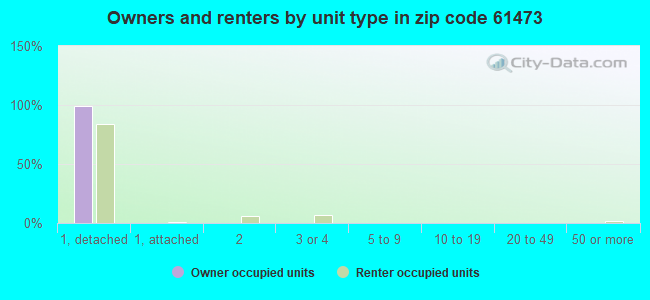
Houses and condos: 665 Renter-occupied apartments: 165
% of renters here:
29%
State:
33%
March 2022 cost of living index in zip code 61473: 84.2 (less than average, U.S. average is 100)
Land area: 103.9 sq. mi. Water area: 0.0 sq. mi.
Population density: 12 people per square mile
(very low).
OSM Map
General Map
Google Map
MSN Map
OSM Map
General Map
Google Map
MSN Map
OSM Map
General Map
Google Map
MSN Map
OSM Map
General Map
Google Map
MSN Map
Please wait while loading the map...
Real estate property taxes paid for housing units in 2022:
This zip code:
1.7% ($1,758)
Illinois:
2.0% ($4,912)
Median real estate property taxes paid for housing units with mortgages in 2022: $1,813 (1.9%) Median real estate property taxes paid for housing units with no mortgage in 2022: $1,686 (1.5%)
Business Search- 14 Million verified businesses
Males: 693
(53.8%)
Females: 595
(46.2%)
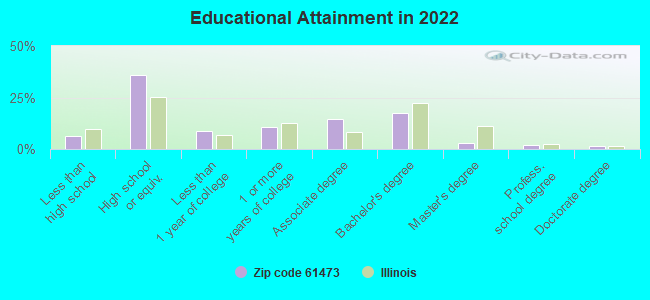
For population 25 years and over in 61473:
High school or higher: 93.0%
Bachelor's degree or higher: 24.1%
Graduate or professional degree: 6.6%
Unemployed: 6.7%
Mean travel time to work (commute): 33.0 minutes
For population 15 years and over in 61473:
Never married: 22.6%
Now married: 53.2%
Separated: 3.5%
Widowed: 10.2%
Divorced: 10.5%
Zip code 61473 compared to state average:
Median house value significantly below state average.
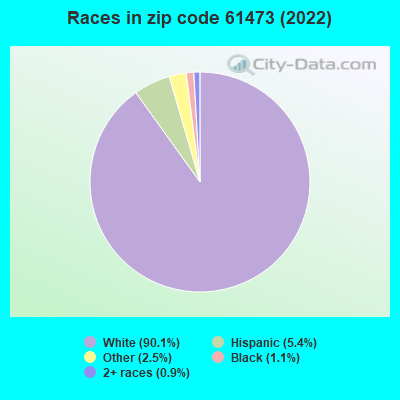
Black race population percentage significantly below state average.
Hispanic race population percentage significantly below state average.
Foreign-born population percentage significantly below state average.
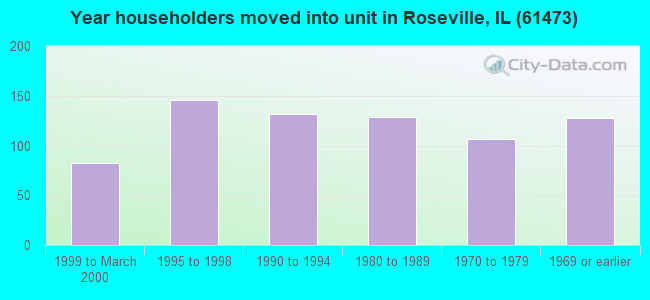
Length of stay since moving in above state average.
House age above state average.
Percentage of population with a bachelor's degree or higher below state average.
Averages for the 2020 tax year for zip code 61473, filed in 2021:
Average Adjusted Gross Income (AGI) in 2020: $56,478 (Individual Income Tax Returns)
Here:
$56,478
State:
$82,626
Salary/wage: $40,871 (reported on 75.7% of returns)
Here:
$40,871
State:
$66,640
(% of AGI for various income ranges: 1300.0% for AGIs below $25k, 3262.9% for AGIs $25k-50k, 6062.5% for AGIs $50k-75k, 8844.0% for AGIs $75k-100k, 17745.0% for AGIs $100k-200k)
Taxable interest for individuals: $1,470 (reported on 40.5% of returns)
This zip code:
$1,470
Illinois:
$2,376
(% of AGI for various income ranges: 37.3% for AGIs below $25k, 40.7% for AGIs $25k-50k, 46.2% for AGIs $50k-75k, 160.0% for AGIs $75k-100k, 527.5% for AGIs $100k-200k)
Ordinary dividends: $3,800 (reported on 23.0% of returns)
Here:
$3,800
State:
$9,061
(% of AGI for various income ranges: 43.3% for AGIs below $25k, 12.9% for AGIs $25k-50k, 121.2% for AGIs $50k-75k, 58.0% for AGIs $75k-100k, 1092.5% for AGIs $100k-200k)
Net capital gain/loss in AGI: +$5,054 (reported on 17.6% of returns)
Here:
+$5,054
State:
+$31,684
(% of AGI for various income ranges: 68.0% for AGIs below $25k, 162.5% for AGIs $50k-75k, 268.0% for AGIs $75k-100k, 727.5% for AGIs $100k-200k)
Profit/loss from business: +$17,545 (reported on 14.9% of returns)
Here:
+$17,545
State:
+$12,175
(% of AGI for various income ranges: 117.3% for AGIs below $25k, 487.9% for AGIs $25k-50k, 360.0% for AGIs $50k-75k, 1957.5% for AGIs $100k-200k)
Taxable individual retirement arrangement distribution: $9,556 (reported on 12.2% of returns)
61473:
$9,556
Illinois:
$21,613
(% of AGI for various income ranges: 133.3% for AGIs below $25k, 241.2% for AGIs $50k-75k, 1167.5% for AGIs $100k-200k)
Total itemized deductions: $30,100 (reported on 2.7% of returns)
Here:
$30,100
State:
$34,948
(% of AGI for various income ranges: 401.3% for AGIs below $25k)
Earned income credit: $2,133 (reported on 16.2% of returns)
Here:
$2,133
State:
$2,311
(% of AGI for various income ranges: 122.0% for AGIs below $25k, 52.1% for AGIs $25k-50k)
Percentage of individuals using paid preparers for their 2020 taxes: 93.2%
Here:
93%
State:
93%
(% for various income ranges: 91.7% for AGIs below $25k, 94.7% for AGIs $25k-50k, 91.7% for AGIs $50k-75k, 87.5% for AGIs $75k-100k, 100.0% for AGIs $100k-200k)
Averages for the 2012 tax year for zip code 61473, filed in 2013:
Average Adjusted Gross Income (AGI) in 2012: $86,379 (Individual Income Tax Returns)
Here:
$86,379
State:
$68,058
Salary/wage: $34,839 (reported on 78.2% of returns)
Here:
$34,839
State:
$55,396
(% of AGI for various income ranges: 71.2% for AGIs below $25k, 71.0% for AGIs $25k-50k, 69.0% for AGIs $50k-75k, 69.8% for AGIs $75k-100k, 53.0% for AGIs $100k-200k)
Taxable interest for individuals: $1,595 (reported on 47.4% of returns)
This zip code:
$1,595
Illinois:
$1,969
(% of AGI for various income ranges: 1.5% for AGIs below $25k, 1.5% for AGIs $25k-50k, 0.4% for AGIs $50k-75k, 1.2% for AGIs $75k-100k, 1.6% for AGIs $100k-200k, 0.5% for AGIs over 200k)
Ordinary dividends: $3,784 (reported on 24.4% of returns)
Here:
$3,784
State:
$7,786
(% of AGI for various income ranges: 0.7% for AGIs below $25k, 1.4% for AGIs $25k-50k, 0.2% for AGIs $50k-75k, 0.6% for AGIs $75k-100k, 1.0% for AGIs $100k-200k, 1.3% for AGIs over 200k)
Net capital gain/loss in AGI: +$159,200 (reported on 16.7% of returns)
Here:
+$159,200
State:
+$22,183
(% of AGI for various income ranges: 0.1% for AGIs below $25k, 0.3% for AGIs $25k-50k, 0.9% for AGIs $50k-75k, 1.9% for AGIs $100k-200k, 58.7% for AGIs over 200k)
Profit/loss from business: +$12,071 (reported on 17.9% of returns)
Here:
+$12,071
State:
+$12,903
(% of AGI for various income ranges: 7.1% for AGIs below $25k, 2.9% for AGIs $25k-50k, 8.0% for AGIs $50k-75k, 7.1% for AGIs $100k-200k)
Taxable individual retirement arrangement distribution: $5,467 (reported on 11.5% of returns)
61473:
$5,467
Illinois:
$17,929
(% of AGI for various income ranges: 2.6% for AGIs below $25k, 2.6% for AGIs $25k-50k, 4.0% for AGIs $75k-100k)
Total itemized deductions: $23,933 (8% of AGI, reported on 19.2% of returns)
Here:
$23,933
State:
$26,433
Here:
8.4% of AGI
State:
19.2% of AGI
(% of AGI for various income ranges: 8.8% for AGIs $25k-50k, 6.0% for AGIs $50k-75k, 9.1% for AGIs $75k-100k, 8.7% for AGIs $100k-200k, 3.6% for AGIs over 200k)
Charity contributions: $7,082 (reported on 14.1% of returns)
Here:
$7,082
State:
$4,525
(% of AGI for various income ranges: 1.8% for AGIs $25k-50k, 1.1% for AGIs $75k-100k, 6.4% for AGIs $100k-200k)
Taxes paid: $6,807 (reported on 19.2% of returns)
61473:
$6,807
State:
$11,968
(% of AGI for various income ranges: 2.2% for AGIs $25k-50k, 1.0% for AGIs $50k-75k, 2.5% for AGIs $75k-100k, 3.1% for AGIs $100k-200k, 1.1% for AGIs over 200k)
Earned income credit: $2,092 (reported on 16.7% of returns)
Here:
$2,092
State:
$2,349
(% of AGI for various income ranges: 5.7% for AGIs below $25k, 1.0% for AGIs $25k-50k)
Percentage of individuals using paid preparers for their 2012 taxes: 71.8%
Here:
72%
State:
57%
(% for various income ranges: 64.5% for AGIs below $25k, 72.2% for AGIs $25k-50k, 75.0% for AGIs $50k-75k, 71.4% for AGIs $75k-100k, 85.7% for AGIs $100k-200k, 100.0% for AGIs over 200k)
Averages for the 2004 tax year for zip code 61473, filed in 2005:
Average Adjusted Gross Income (AGI) in 2004: $35,462 (Individual Income Tax Returns)
Here:
$35,462
State:
$54,625
Salary/wage: $27,686 (reported on 75.9% of returns)
Here:
$27,686
State:
$46,811
(% of AGI for various income ranges: 103.9% for AGIs below $10k, 57.8% for AGIs $10k-25k, 75.0% for AGIs $25k-50k, 69.7% for AGIs $50k-75k, 59.5% for AGIs $75k-100k, 24.1% for AGIs over 100k)
Taxable interest for individuals: $2,240 (reported on 53.9% of returns)
This zip code:
$2,240
Illinois:
$2,101
(% of AGI for various income ranges: 11.1% for AGIs below $10k, 5.5% for AGIs $10k-25k, 1.8% for AGIs $25k-50k, 1.8% for AGIs $50k-75k, 2.0% for AGIs $75k-100k, 6.1% for AGIs over 100k)
Taxable dividends: $1,448 (reported on 27.5% of returns)
Here:
$1,448
State:
$4,306
(% of AGI for various income ranges: 2.5% for AGIs below $10k, 1.1% for AGIs $10k-25k, 0.7% for AGIs $25k-50k, 0.6% for AGIs $50k-75k, 1.5% for AGIs $75k-100k, 1.9% for AGIs over 100k)
Net capital gain/loss: +$4,538 (reported on 19.4% of returns)
Here:
+$4,538
State:
+$17,321
(% of AGI for various income ranges: 4.4% for AGIs below $10k, 1.9% for AGIs $10k-25k, 1.0% for AGIs $25k-50k, 0.9% for AGIs $50k-75k, 1.0% for AGIs $75k-100k, 7.0% for AGIs over 100k)
Profit/loss from business: +$7,328 (reported on 16.6% of returns)
Here:
+$7,328
State:
+$11,771
(% of AGI for various income ranges: 5.2% for AGIs below $10k, 4.1% for AGIs $10k-25k, 2.0% for AGIs $25k-50k, 2.8% for AGIs $50k-75k, 7.4% for AGIs over 100k)
Profit/loss from farming: +$9,807 (reported on 13.5% of returns)
Here:
+$9,807
State:
+$2,327
(% of AGI for various income ranges: 13.5% for AGIs below $10k, 1.3% for AGIs $10k-25k, 3.1% for AGIs $25k-50k, 4.1% for AGIs $50k-75k, 9.0% for AGIs $75k-100k, 1.5% for AGIs over 100k)
IRA payment deduction: $2,917 (reported on 3.0% of returns)
61473:
$2,917
Illinois:
$3,087
Total itemized deductions: $15,527 (22% of AGI, reported on 13.7% of returns)
Here:
$15,527
State:
$20,239
Here:
22.4% of AGI
State:
19.5% of AGI
(% of AGI for various income ranges: 9.6% for AGIs $10k-25k, 5.7% for AGIs $25k-50k, 4.0% for AGIs $50k-75k, 8.0% for AGIs $75k-100k, 6.0% for AGIs over 100k)
Charity contributions deductions: $3,644 (5% of AGI, reported on 11.2% of returns)
Here:
$3,644
State:
$3,719
Here:
4.9% of AGI
State:
3.4% of AGI
(% of AGI for various income ranges: 0.9% for AGIs $10k-25k, 1.3% for AGIs $25k-50k, 0.5% for AGIs $50k-75k, 1.7% for AGIs $75k-100k, 1.6% for AGIs over 100k)
Total tax: $5,200 (reported on 72.7% of returns)
61473:
$5,200
State:
$9,882
(% of AGI for various income ranges: 4.4% for AGIs below $10k, 3.8% for AGIs $10k-25k, 6.8% for AGIs $25k-50k, 9.4% for AGIs $50k-75k, 12.1% for AGIs $75k-100k, 20.4% for AGIs over 100k)
Earned income credit: $1,543 (reported on 13.0% of returns)
Here:
$1,543
State:
$1,788
Percentage of individuals using paid preparers for their 2004 taxes: 72.9%
Here:
73%
State:
61%
(% for various income ranges: 71.0% for AGIs below $10k, 70.1% for AGIs $10k-25k, 69.8% for AGIs $25k-50k, 76.9% for AGIs $50k-75k, 85.7% for AGIs $75k-100k, 88.9% for AGIs over 100k)
Household received Food Stamps/SNAP in the past 12 months: 104 Household did not receive Food Stamps/SNAP in the past 12 months: 470
Women who had a birth in the past 12 months: 11 (2 now married, 8 unmarried) Women who did not have a birth in the past 12 months: 185 (107 now married, 76 unmarried)
Housing units in zip code 61473 with a mortgage: 172 (5 second mortgage, 5 both second mortgage and home equity loan) Houses without a mortgage: 3
Median monthly owner costs for units with a mortgage: $865 Median monthly owner costs for units without a mortgage: $451
Residents with income below the poverty level in 2022:
This zip code:
12.4%
Whole state:
11.9%
Residents with income below 50% of the poverty level in 2022:
This zip code:
9.2%
Whole state:
5.7%
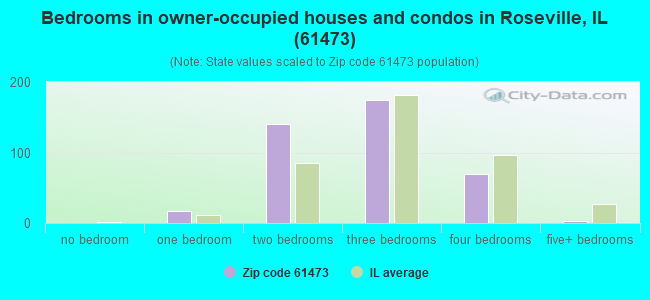
Median number of rooms in houses and condos:
Here:
6.5
State:
6.4
Median number of rooms in apartments:
Here:
5.1
State:
4.1
Notable locations in this zip code not listed on our city pages
Notable locations in zip code 61473: Swan Hills Country Club (A), Point Pleasant Townhall (B), Roseville Area Ambulance Service (C), Roseville Fire Department (D). Display/hide their locations on the map
Cemeteries: Asbury Cemetery (1), Bond Cemetery (2), Roseville Memorial Cemetery (3), Point Pleasant Cemetery (4), Stice Cemetery (5). Display/hide their locations on the map
In group quarters: 79 (-1 institutionalized population)
Size of family households: 182 2-persons, 76 3-persons, 41 4-persons, 27 5-persons, 6 7-or-more-persons
Size of nonfamily households: 206 1-person, 32 2-persons
171 married couples with children.
80 single-parent households (28 men, 52 women).
97.0% of residents of 61473 zip code speak English at home.
1.9% of residents speak Spanish at home (100% very well).
1.2% of residents speak other Indo-European language at home (93% very well, 7% not well).
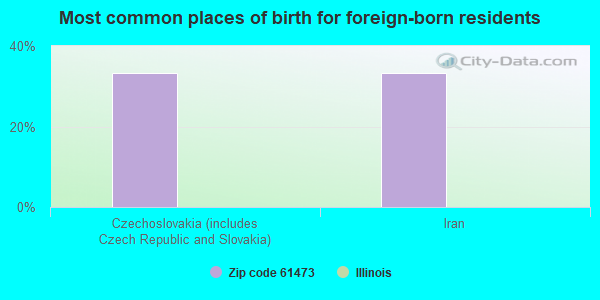
Foreign born population: 3 (0.2%) (33.5% of them are naturalized citizens)
This zip code:
0.2%
Whole state:
14.4%
33%Czechoslovakia (includes Czech Republic and Slovakia)
33%Iran
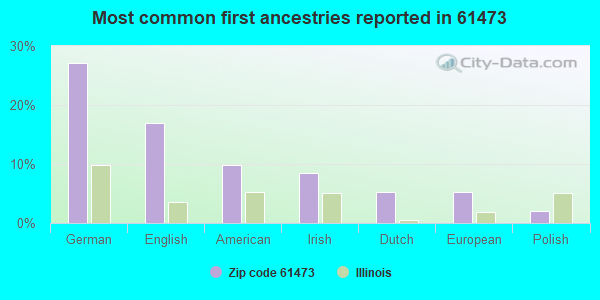
27%German
17%English
10%American
8%Irish
5%Dutch
5%European
2%Polish
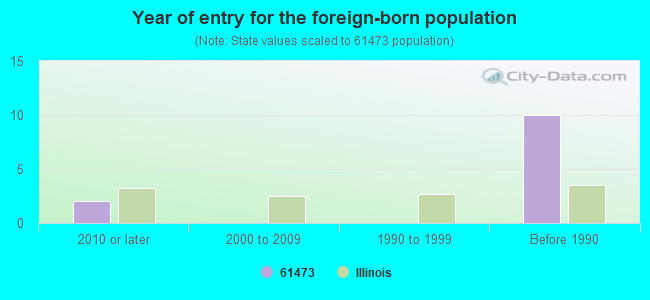
Year of entry for the foreign-born population
22010 or later
02000 to 2009
01990 to 1999
10Before 1990
Facilities with environmental interests located in this zip code:
LARRY S SALES & SERVICE (200 N MAIN in ROSEVILLE, IL)
STATE MASTER (Illinois EPA Project) - AIR PROGRAM AIR MINOR (AIRS/AFS) Business SIC classification: NONCLASSIFIABLE ESTABLISHMENTS Alternative names: LARRYS SALES & SERVICE
ROSEVILLE STP (VILLAGE HALL in ROSEVILLE, IL)
STATE MASTER (Illinois EPA Project) - National Pollutant Discharge Elimination System Permit, National Pollutant Discharge Elimination System NON-MAJOR (Tracking pollutant discharge elimination systems) - permit Business SIC classification: SEWERAGE SYSTEMS Alternative names: ROSEVILLE, VILLAGE OF
ROSEVILLE HIGH SCHOOL (200 EAST GOSSETT ST in ROSEVILLE, IL)
(Geographic Names Information System) (National Center for Education Statistics) - STATE ID-2709420000003 Organizations: ROSEVILLE C U SCH DIST 200 (SCHOOL DISTRICT)
ROSEVILLE ELEM SCHOOL (265 W PENN AVE in ROSEVILLE, IL)
(National Center for Education Statistics) - STATE ID-2709420002002 Organizations: ROSEVILLE C U SCH DIST 200 (SCHOOL DISTRICT)
AMOCO FERTILIZER PLANT (RR 1 in ROSEVILLE, IL)
(Resource Conservation and Recovery Act (tracking hazardous waste))
ROSEVILLE SCHOOL DISTRICT (200 E GOSSETT in ROSEVILLE, IL)
Large Quantity Generators, more that 1000 kg of hazardous waste/month (Resource Conservation and Recovery Act (tracking hazardous waste)) - notification Organizations: ROSEVILLE SCHOOL DISTRCT (CONTACT/OWNER)
HAWK CO (1 AND A FOURTH MLS N ON RTE 67 in ROSEVILLE, IL)
Conditionally Exempt Small Quantity Generators, less than 100 kg/month of hazardous waste (Resource Conservation and Recovery Act (tracking hazardous waste)) - notification Organizations: HAWK MARVIN (CONTACT/OWNER)
NERGE CLEANERS (810 NERGE RD in ROSEVILLE, IL)
Small Quantity Generators, between 100 kg and 1000 kg of hazardous waste/month (Resource Conservation and Recovery Act (tracking hazardous waste)) - notification Organizations: LEE BOK KI (CONTACT/OWNER)
DALE LYBARGER OIL COMPANY, INC. (HIGHWAY 116 in ROSEVILLE, IL)
AIR MINOR (AIRS/AFS) Business SIC classification: PETROLEUM BULK STATIONS AND TERMINALS
ROSEVILLE STP, VILLAGE OF (185 WEST PENN in ROSEVILLE, IL)
National Pollutant Discharge Elimination System NON-MAJOR (Tracking pollutant discharge elimination systems) - permit Business SIC classification: SEWERAGE SYSTEMS
Housing units lacking complete plumbing facilities: 6.0% Housing units lacking complete kitchen facilities: 8.1%
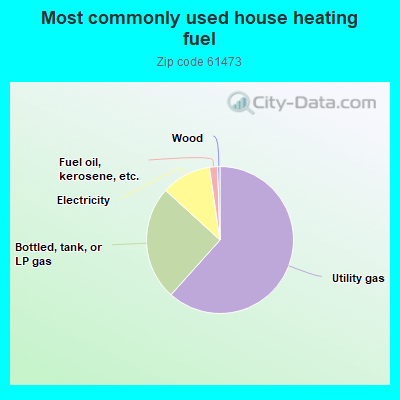
61.5%Utility gas
25.1%Bottled, tank, or LP gas
10.9%Electricity
1.8%Fuel oil, kerosene, etc.
0.5%Wood
Population in 1990: 1,734. Population change in the 1990s: +38 (+2.2%).
Place of birth for U.S.-born residents:
This state: 1,042
Northeast: 12
Midwest: 139
South: 54
West: 22
64% of the 61473 zip code residents lived in the same house 5 years ago. Out of people who lived in different houses, 50% lived in this county. Out of people who lived in different counties, 50% lived in Illinois.
90% of the 61473 zip code residents lived in the same house 1 year ago. Out of people who lived in different houses, 37% moved from this county. Out of people who lived in different houses, 46% moved from different county within same state. Out of people who lived in different houses, 16% moved from different state.
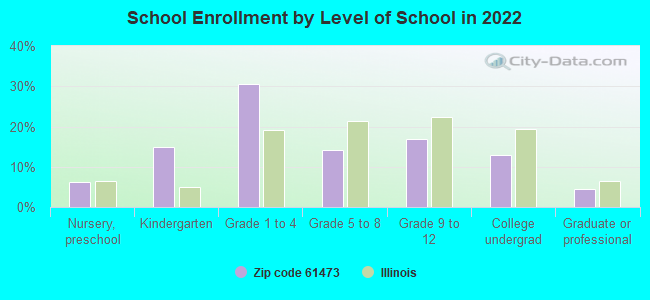
Private vs. public school enrollment:
Students in private schools in grades 1 to 8 (elementary and middle school):
Here:
0.0%
Illinois:
13.3%
Students in private schools in grades 9 to 12 (high school): 11
Here:
27.9%
Illinois:
9.9%
Students in private undergraduate colleges: 1
Here:
6.0%
Illinois:
27.4%
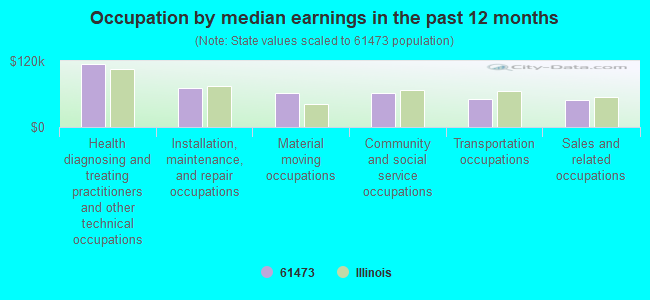
Occupation by median earnings in the past 12 months ($)
114,225Health diagnosing and treating practitioners and other technical occupations
71,363Installation, maintenance, and repair occupations
62,227Material moving occupations
61,177Community and social service occupations
51,328Transportation occupations
49,611Sales and related occupations
Top industries in this zip code by the number of employees in 2005:
Health Care and Social Assistance: Nursing Care Facilities (50-99 employees: 1 establishment, 1-4 employees: 1 establishment)
Arts, Entertainment, and Recreation: Bowling Centers (10-19: 1)
Health Care and Social Assistance: Ambulance Services (10-19: 1)
Wholesale Trade: Grain and Field Bean Merchant Wholesalers (10-19: 1)
Professional, Scientific, and Technical Services: Veterinary Services (5-9: 2)
Other Services (except Public Administration): Religious Organizations (5-9: 1, 1-4: 2)
Health Care and Social Assistance: Child Day Care Services (5-9: 1, 1-4: 1)
71 people in nursing facilities/skilled-nursing facilities
People in group quarters in 2000:
71 people in nursing homes
Fatal accident statistics in 2013:
Fatal accident count: 1
Vehicles involved in fatal accidents: 2
Fatal accidents caused by drunken drivers: 1
Fatalities: 1
Persons involved in fatal accidents: 2
Pedestrians involved in fatal accidents: 0
Fatal accident statistics in 2012:
Fatal accident count: 1
Vehicles involved in fatal accidents: 1
Fatal accidents caused by drunken drivers: 0
Fatalities: 1
Persons involved in fatal accidents: 1
Pedestrians involved in fatal accidents: 0
2006 - 2018 National Fire Incident Reporting System (NFIRS) incidents
According to the data from the years 2006 - 2018 the average number of fires per year is 8. The highest number of fires - 19 took place in 2006, and the least - 1 in 2013. The data has a dropping trend.
When looking into fire subcategories, the most incidents belonged to: Outside Fires (45.5%), and Structure Fires (34.5%).
Fire incident types reported to NFIRS in Zip Code 61473

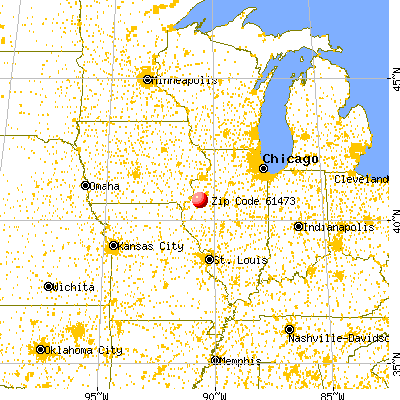


 Nearest zip codes: 61417, 61438, 61478, 61475, 61470, 61460.
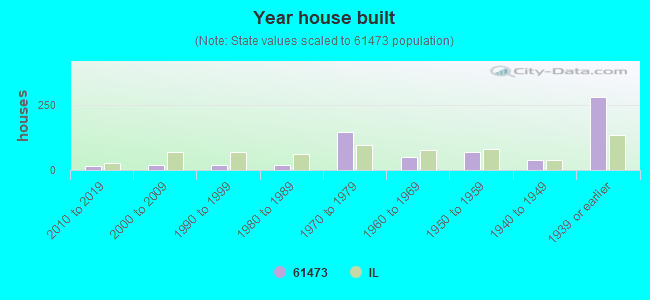


 According to the data from the years 2006 - 2018 the average number of fires per year is 8. The highest number of fires - 19 took place in 2006, and the least - 1 in 2013. The data has a dropping trend.
 When looking into fire subcategories, the most incidents belonged to: Outside Fires (45.5%), and Structure Fires (34.5%).