Estimated zip code population in 2022: 2,133 Zip code population in 2010: 1,629 Zip code population in 2000: 1,398
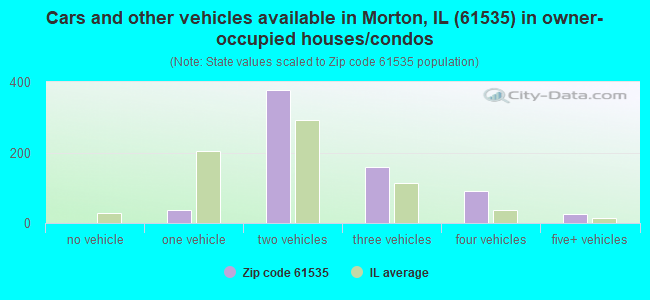
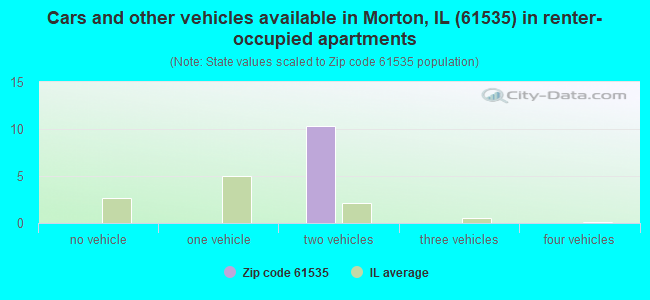
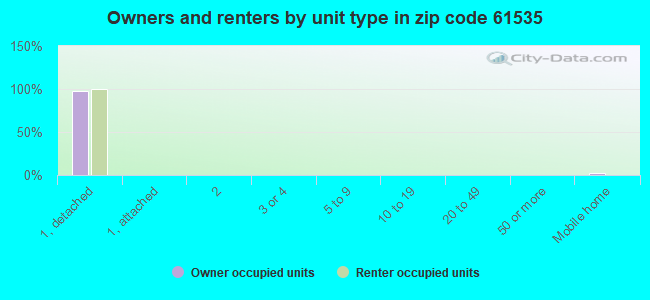
Houses and condos: 720 Renter-occupied apartments: 11
% of renters here:
2%
State:
33%
March 2022 cost of living index in zip code 61535: 82.6 (low, U.S. average is 100)
Land area: 8.7 sq. mi. Water area: 0.1 sq. mi.
Population density: 246 people per square mile
(very low).
OSM Map
General Map
Google Map
MSN Map
OSM Map
General Map
Google Map
MSN Map
OSM Map
General Map
Google Map
MSN Map
OSM Map
General Map
Google Map
MSN Map
Please wait while loading the map...
Real estate property taxes paid for housing units in 2022:
This zip code:
1.9% ($4,785)
Illinois:
2.0% ($4,912)
Median real estate property taxes paid for housing units with mortgages in 2022: $5,067 (2.0%) Median real estate property taxes paid for housing units with no mortgage in 2022: $3,646 (1.8%)
Business Search- 14 Million verified businesses
Males: 1,120
(52.5%)
Females: 1,012
(47.5%)
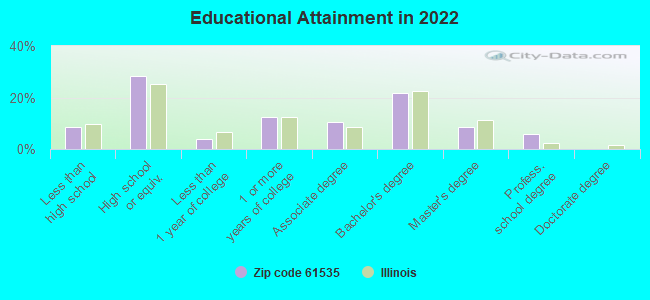
For population 25 years and over in 61535:
High school or higher: 90.8%
Bachelor's degree or higher: 36.0%
Graduate or professional degree: 14.5%
Unemployed: 4.5%
Mean travel time to work (commute): 17.5 minutes
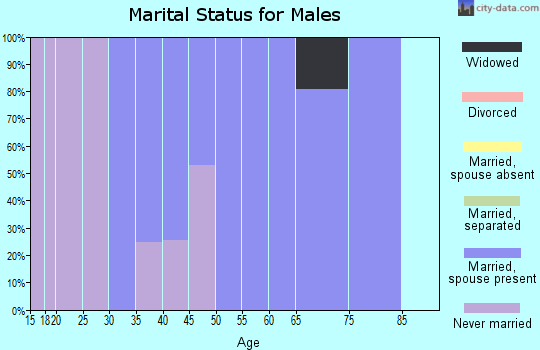
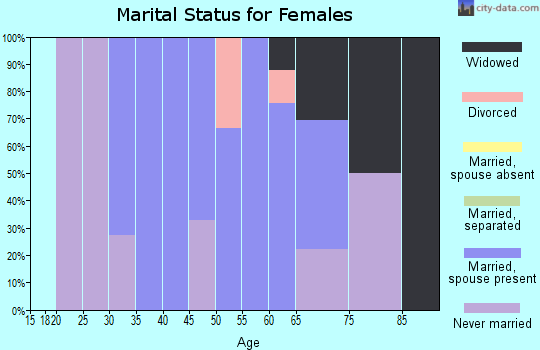
For population 15 years and over in 61535:
Never married: 20.4%
Now married: 69.4%
Separated: 0.0%
Widowed: 6.4%
Divorced: 3.8%
Zip code 61535 compared to state average:
Median household income above state average.
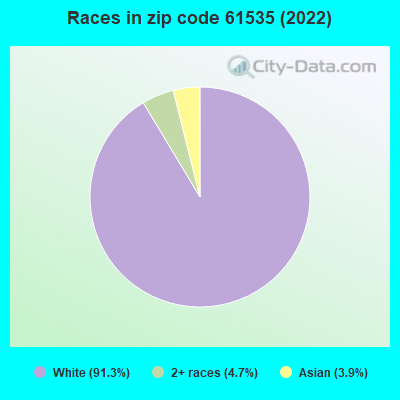
Black race population percentage significantly below state average.
Hispanic race population percentage significantly below state average.
Foreign-born population percentage significantly below state average.
Renting percentage significantly below state average.
Length of stay since moving in significantly above state average.
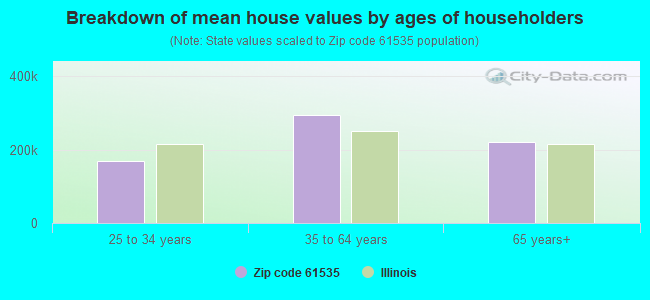
Estimated median house/condo value in 2022: $248,338
61535:
$248,338
Illinois:
$251,600
According to our research of Illinois and other state lists, there was 1 registered sex offender living in 61535 zip code as of April 23, 2024. The ratio of all residents to sex offenders in zip code 61535 is 1,378 to 1. The ratio of registered sex offenders to all residents in this zip code is lower than the state average.
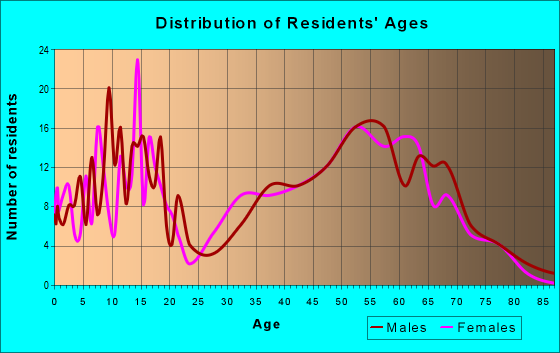
Median resident age:
This zip code:
41.3 years
Illinois median age:
39.1 years
Average household size:
This zip code:
3.0 people
Illinois:
2.4 people
Averages for the 2020 tax year for zip code 61535, filed in 2021:
Average Adjusted Gross Income (AGI) in 2020: $95,478 (Individual Income Tax Returns)
Here:
$95,478
State:
$82,626
Salary/wage: $78,442 (reported on 79.3% of returns)
Here:
$78,442
State:
$66,640
(% of AGI for various income ranges: 1037.3% for AGIs below $25k, 3171.0% for AGIs $25k-50k, 6037.5% for AGIs $50k-75k, 6708.6% for AGIs $75k-100k, 15975.0% for AGIs $100k-200k, 51755.0% for AGIs over 200k)
Taxable interest for individuals: $1,222 (reported on 63.2% of returns)
This zip code:
$1,222
Illinois:
$2,376
(% of AGI for various income ranges: 12.0% for AGIs below $25k, 79.0% for AGIs $25k-50k, 73.8% for AGIs $50k-75k, 147.1% for AGIs $75k-100k, 166.7% for AGIs $100k-200k, 532.5% for AGIs over 200k)
Ordinary dividends: $5,912 (reported on 27.6% of returns)
Here:
$5,912
State:
$9,061
(% of AGI for various income ranges: 17.3% for AGIs below $25k, 60.0% for AGIs $25k-50k, 178.8% for AGIs $50k-75k, 135.7% for AGIs $75k-100k, 304.2% for AGIs $100k-200k, 1825.0% for AGIs over 200k)
Net capital gain/loss in AGI: +$10,288 (reported on 28.7% of returns)
Here:
+$10,288
State:
+$31,684
(% of AGI for various income ranges: 80.0% for AGIs below $25k, 321.2% for AGIs $50k-75k, 151.4% for AGIs $75k-100k, 346.7% for AGIs $100k-200k, 4182.5% for AGIs over 200k)
Profit/loss from business: +$29,310 (reported on 11.5% of returns)
Here:
+$29,310
State:
+$12,175
(% of AGI for various income ranges: 107.3% for AGIs below $25k, 150.0% for AGIs $50k-75k, 720.8% for AGIs $100k-200k, 4462.5% for AGIs over 200k)
Taxable individual retirement arrangement distribution: $18,371 (reported on 16.1% of returns)
61535:
$18,371
Illinois:
$21,613
(% of AGI for various income ranges: 180.0% for AGIs $25k-50k, 440.0% for AGIs $50k-75k, 628.6% for AGIs $75k-100k, 1333.3% for AGIs $100k-200k)
Total itemized deductions: $37,543 (reported on 8.0% of returns)
Here:
$37,543
State:
$34,948
(% of AGI for various income ranges: 1822.9% for AGIs $75k-100k, 3380.0% for AGIs over 200k)
Charity contributions: $20,900 (reported on 5.7% of returns)
Here:
$20,900
State:
$13,122
(% of AGI for various income ranges: 291.2% for AGIs $50k-75k, 2030.0% for AGIs over 200k)
Taxes paid: $8,057 (reported on 8.0% of returns)
61535:
$8,057
State:
$8,563
(% of AGI for various income ranges: 444.3% for AGIs $75k-100k, 632.5% for AGIs over 200k)
Earned income credit: $2,120 (reported on 5.7% of returns)
Here:
$2,120
State:
$2,311
(% of AGI for various income ranges: 70.7% for AGIs below $25k)
Percentage of individuals using paid preparers for their 2020 taxes: 94.3%
Here:
94%
State:
93%
(% for various income ranges: 95.2% for AGIs below $25k, 92.3% for AGIs $25k-50k, 91.7% for AGIs $50k-75k, 100.0% for AGIs $75k-100k, 95.2% for AGIs $100k-200k, 90.0% for AGIs over 200k)
Averages for the 2012 tax year for zip code 61535, filed in 2013:
Average Adjusted Gross Income (AGI) in 2012: $88,117 (Individual Income Tax Returns)
Here:
$88,117
State:
$68,058
Salary/wage: $71,699 (reported on 87.7% of returns)
Here:
$71,699
State:
$55,396
(% of AGI for various income ranges: 70.8% for AGIs below $25k, 63.8% for AGIs $25k-50k, 70.8% for AGIs $50k-75k, 71.7% for AGIs $75k-100k, 72.0% for AGIs $100k-200k, 72.3% for AGIs over 200k)
Taxable interest for individuals: $1,095 (reported on 67.9% of returns)
This zip code:
$1,095
Illinois:
$1,969
(% of AGI for various income ranges: 1.1% for AGIs below $25k, 0.9% for AGIs $25k-50k, 0.9% for AGIs $50k-75k, 1.0% for AGIs $75k-100k, 0.4% for AGIs $100k-200k, 1.2% for AGIs over 200k)
Ordinary dividends: $3,237 (reported on 33.3% of returns)
Here:
$3,237
State:
$7,786
(% of AGI for various income ranges: 1.6% for AGIs below $25k, 1.3% for AGIs $25k-50k, 1.4% for AGIs $50k-75k, 1.1% for AGIs $75k-100k, 1.0% for AGIs $100k-200k, 1.4% for AGIs over 200k)
Net capital gain/loss in AGI: +$2,855 (reported on 24.7% of returns)
Here:
+$2,855
State:
+$22,183
(% of AGI for various income ranges: 0.8% for AGIs $100k-200k, 1.9% for AGIs over 200k)
Profit/loss from business: +$6,425 (reported on 14.8% of returns)
Here:
+$6,425
State:
+$12,903
(% of AGI for various income ranges: 5.8% for AGIs below $25k, 2.1% for AGIs $50k-75k, 2.0% for AGIs $100k-200k)
Taxable individual retirement arrangement distribution: $19,164 (reported on 13.6% of returns)
61535:
$19,164
Illinois:
$17,929
(% of AGI for various income ranges: 7.0% for AGIs $25k-50k, 2.6% for AGIs $75k-100k, 6.1% for AGIs $100k-200k)
Total itemized deductions: $23,045 (17% of AGI, reported on 46.9% of returns)
Here:
$23,045
State:
$26,433
Here:
16.6% of AGI
State:
19.2% of AGI
(% of AGI for various income ranges: 15.9% for AGIs $25k-50k, 14.3% for AGIs $50k-75k, 12.4% for AGIs $75k-100k, 12.7% for AGIs $100k-200k, 11.5% for AGIs over 200k)
Charity contributions: $5,138 (reported on 39.5% of returns)
Here:
$5,138
State:
$4,525
(% of AGI for various income ranges: 2.1% for AGIs $25k-50k, 1.8% for AGIs $50k-75k, 2.7% for AGIs $75k-100k, 2.3% for AGIs $100k-200k, 2.6% for AGIs over 200k)
Taxes paid: $10,711 (reported on 46.9% of returns)
61535:
$10,711
State:
$11,968
(% of AGI for various income ranges: 4.9% for AGIs $25k-50k, 5.1% for AGIs $50k-75k, 5.3% for AGIs $75k-100k, 5.9% for AGIs $100k-200k, 6.5% for AGIs over 200k)
Earned income credit: $2,000 (reported on 6.2% of returns)
Here:
$2,000
State:
$2,349
(% of AGI for various income ranges: 4.4% for AGIs below $25k)
Percentage of individuals using paid preparers for their 2012 taxes: 56.8%
Here:
57%
State:
57%
(% for various income ranges: 52.4% for AGIs below $25k, 53.8% for AGIs $25k-50k, 63.6% for AGIs $50k-75k, 54.5% for AGIs $75k-100k, 61.1% for AGIs $100k-200k, 57.1% for AGIs over 200k)
Averages for the 2004 tax year for zip code 61535, filed in 2005:
Average Adjusted Gross Income (AGI) in 2004: $61,000 (Individual Income Tax Returns)
Here:
$61,000
State:
$54,625
Salary/wage: $53,729 (reported on 84.3% of returns)
Here:
$53,729
State:
$46,811
(% of AGI for various income ranges: 105.1% for AGIs below $10k, 68.7% for AGIs $10k-25k, 66.1% for AGIs $25k-50k, 68.6% for AGIs $50k-75k, 78.7% for AGIs $75k-100k, 76.2% for AGIs over 100k)
Taxable interest for individuals: $1,868 (reported on 65.7% of returns)
This zip code:
$1,868
Illinois:
$2,101
(% of AGI for various income ranges: 7.6% for AGIs below $10k, 5.7% for AGIs $10k-25k, 2.7% for AGIs $25k-50k, 2.9% for AGIs $50k-75k, 0.8% for AGIs $75k-100k, 1.6% for AGIs over 100k)
Taxable dividends: $1,821 (reported on 36.4% of returns)
Here:
$1,821
State:
$4,306
(% of AGI for various income ranges: 5.4% for AGIs below $10k, 2.0% for AGIs $10k-25k, 1.5% for AGIs $25k-50k, 1.3% for AGIs $50k-75k, 0.6% for AGIs $75k-100k, 1.0% for AGIs over 100k)
Net capital gain/loss: +$2,733 (reported on 26.5% of returns)
Here:
+$2,733
State:
+$17,321
(% of AGI for various income ranges: 2.8% for AGIs below $10k, 0.3% for AGIs $10k-25k, -0.0% for AGIs $25k-50k, 1.8% for AGIs $50k-75k, 0.8% for AGIs $75k-100k, 1.6% for AGIs over 100k)
Profit/loss from business: +$4,500 (reported on 14.7% of returns)
Here:
+$4,500
State:
+$11,771
(% of AGI for various income ranges: 11.8% for AGIs below $10k, 3.2% for AGIs $10k-25k, 0.6% for AGIs $25k-50k, 1.1% for AGIs $50k-75k, 0.2% for AGIs $75k-100k, 1.3% for AGIs over 100k)
IRA payment deduction: $2,167 (reported on 1.6% of returns)
61535:
$2,167
Illinois:
$3,087
Total itemized deductions: $16,917 (18% of AGI, reported on 44.2% of returns)
Here:
$16,917
State:
$20,239
Here:
18.1% of AGI
State:
19.5% of AGI
(% of AGI for various income ranges: 14.1% for AGIs $10k-25k, 14.1% for AGIs $25k-50k, 14.9% for AGIs $50k-75k, 12.1% for AGIs $75k-100k, 10.9% for AGIs over 100k)
Charity contributions deductions: $3,912 (4% of AGI, reported on 40.2% of returns)
Here:
$3,912
State:
$3,719
Here:
4.0% of AGI
State:
3.4% of AGI
(% of AGI for various income ranges: 1.3% for AGIs $10k-25k, 2.4% for AGIs $25k-50k, 2.5% for AGIs $50k-75k, 2.5% for AGIs $75k-100k, 2.9% for AGIs over 100k)
Total tax: $9,209 (reported on 83.2% of returns)
61535:
$9,209
State:
$9,882
(% of AGI for various income ranges: 3.4% for AGIs below $10k, 4.3% for AGIs $10k-25k, 7.0% for AGIs $25k-50k, 8.5% for AGIs $50k-75k, 10.6% for AGIs $75k-100k, 17.6% for AGIs over 100k)
Earned income credit: $1,421 (reported on 5.2% of returns)
Here:
$1,421
State:
$1,788
Percentage of individuals using paid preparers for their 2004 taxes: 55.2%
Here:
55%
State:
61%
(% for various income ranges: 49.6% for AGIs below $10k, 47.5% for AGIs $10k-25k, 58.6% for AGIs $25k-50k, 57.8% for AGIs $50k-75k, 61.0% for AGIs $75k-100k, 56.1% for AGIs over 100k)
Household received Food Stamps/SNAP in the past 12 months: 27 Household did not receive Food Stamps/SNAP in the past 12 months: 672
Women who did not have a birth in the past 12 months: 422 (302 now married, 115 unmarried)
Housing units in zip code 61535 with a mortgage: 529 (95 second mortgage, 95 both second mortgage and home equity loan) Median monthly owner costs for units with a mortgage: $1,880 Median monthly owner costs for units without a mortgage: $645
Residents with income below the poverty level in 2022:
This zip code:
3.7%
Whole state:
11.9%
Residents with income below 50% of the poverty level in 2022:
This zip code:
3.7%
Whole state:
5.7%
Median number of rooms in houses and condos:
Here:
7.0
State:
6.4
Notable locations in this zip code not listed on our city pages
Cemeteries: Landes Cemetery (1), Spring Valley Cemetery (2), Deacon Cemetery (3), Evangelical Mennonite Cemetery (4). Display/hide their locations on the map
Lakes and reservoirs: Bessler Lakes (A), Bessler Lake (B), Northern Oaks Lake (C), Lake Wildwood (D), Lake of the Whispering Oaks (E), Grand Oaks Lake (F). Display/hide their locations on the map
Size of family households: 269 2-persons, 131 3-persons, 163 4-persons, 36 5-persons, 23 7-or-more-persons
Size of nonfamily households: 52 1-person, 27 2-persons
617 married couples with children.
13 single-parent households (13 men).
94.0% of residents of 61535 zip code speak English at home.
1.0% of residents speak Spanish at home (100% very well).
4.0% of residents speak Asian or Pacific Island language at home (5% very well, 95% not well).
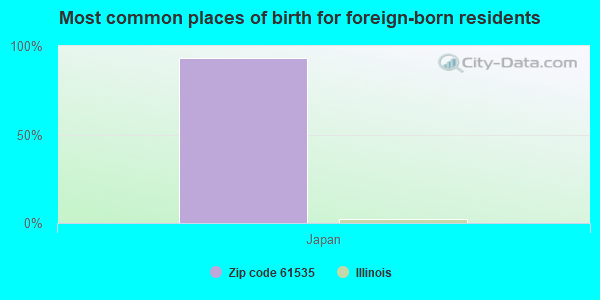
Foreign born population: 86 (4.1%) (100.0% of them are naturalized citizens)
This zip code:
4.1%
Whole state:
14.4%
93%Japan
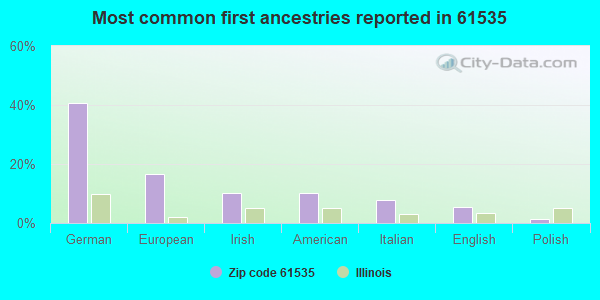
41%German
17%European
10%Irish
10%American
8%Italian
6%English
1%Polish
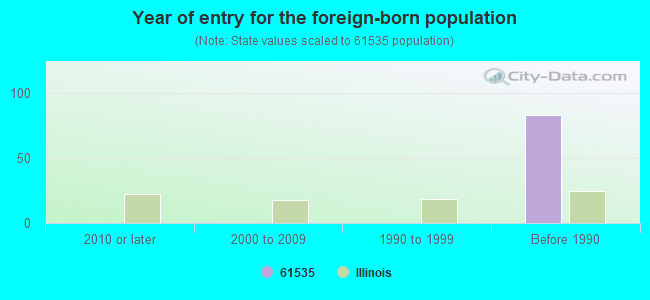
Year of entry for the foreign-born population
02010 or later
02000 to 2009
01990 to 1999
83Before 1990
Facilities with environmental interests located in this zip code:
AT&T LONG LINES GROVELAND (APPROX 2.5MI NW OF GROVELAND in GROVELAND, IL)
(Resource Conservation and Recovery Act (tracking hazardous waste))
ILDOT BRG 090 0117 (MULLER RD OVER I74 in GROVELAND, IL)
Small Quantity Generators, between 100 kg and 1000 kg of hazardous waste/month (Resource Conservation and Recovery Act (tracking hazardous waste)) - notification
Housing units lacking complete plumbing facilities: 1.8% Housing units lacking complete kitchen facilities: 1.8%
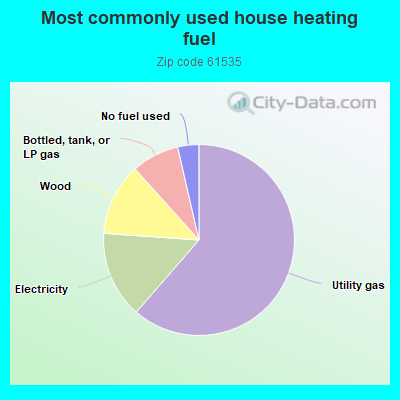
61.7%Utility gas
14.8%Electricity
12.3%Wood
8.1%Bottled, tank, or LP gas
3.6%No fuel used
Place of birth for U.S.-born residents:
This state: 1,759
Northeast: 50
Midwest: 80
South: 83
West: 66
59% of the 61535 zip code residents lived in the same house 5 years ago. Out of people who lived in different houses, 66% lived in this county. Out of people who lived in different counties, 50% lived in Illinois.
93% of the 61535 zip code residents lived in the same house 1 year ago. Out of people who lived in different houses, 93% moved from this county.
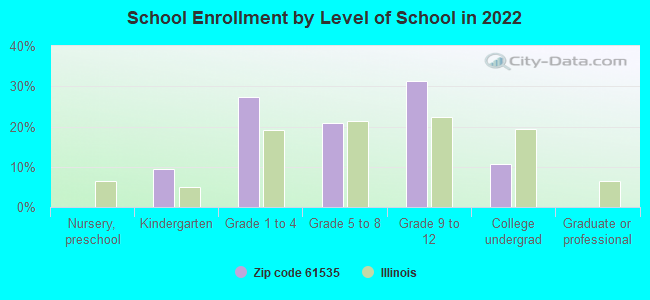
Private vs. public school enrollment:
Students in private schools in grades 1 to 8 (elementary and middle school): 40
Here:
12.2%
Illinois:
13.3%
Students in private schools in grades 9 to 12 (high school): 23
Here:
11.1%
Illinois:
9.9%
Students in private undergraduate colleges: 32
Here:
44.5%
Illinois:
27.4%
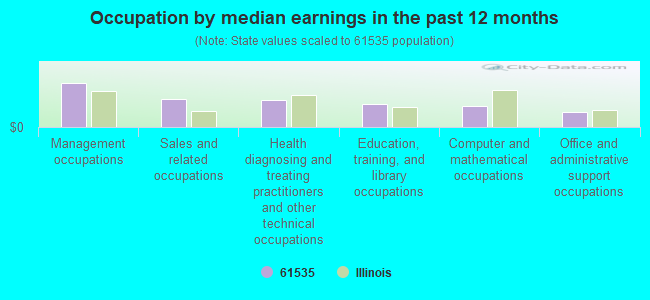
Occupation by median earnings in the past 12 months ($)
118,119Management occupations
74,727Sales and related occupations
72,485Health diagnosing and treating practitioners and other technical occupations
62,179Education, training, and library occupations
56,785Computer and mathematical occupations
39,586Office and administrative support occupations
Top industries in this zip code by the number of employees in 2005:
Wholesale Trade: Other Electronic Parts and Equipment Merchant Wholesalers (10-19 employees: 1 establishment)
Accommodation and Food Services: Full-Service Restaurants (10-19: 1)
Administrative and Support and Waste Management and Remediation Services: Janitorial Services (5-9: 1, 1-4: 1)
Construction: New Single-Family Housing Construction (except Operative Builders) (5-9: 1, 1-4: 1)
Real Estate and Rental and Leasing: Other Activities Related to Real Estate (5-9: 1)
Professional, Scientific, and Technical Services: Administrative Management and General Management Consulting Services (5-9: 1)
Administrative and Support and Waste Management and Remediation Services: Landscaping Services (1-4: 1)
Home Mortgage Disclosure Act Aggregated Statistics For Year 2009 (Based on 2 partial tracts)
A) FHA, FSA/RHS & VA Home Purchase Loans
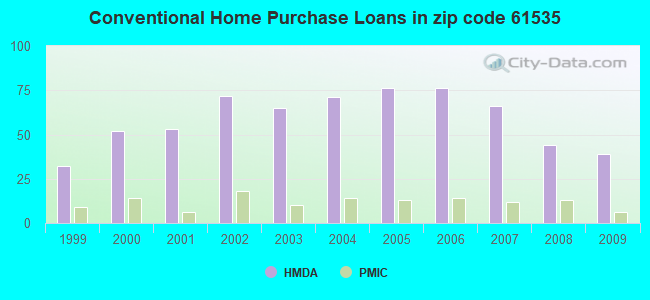
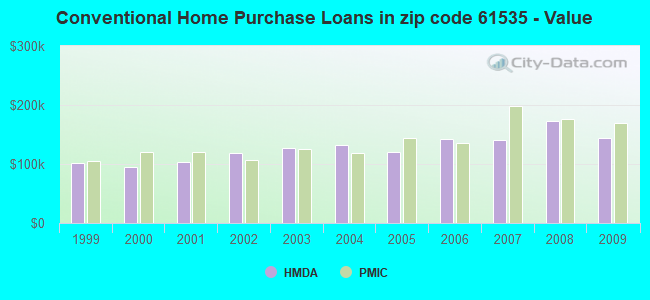
B) Conventional Home Purchase Loans
C) Refinancings
D) Home Improvement Loans
E) Loans on Dwellings For 5+ Families
F) Non-occupant Loans on < 5 Family Dwellings (A B C & D)
G) Loans On Manufactured Home Dwelling (A B C & D)
Number
Average Value
Number
Average Value
Number
Average Value
Number
Average Value
Number
Average Value
Number
Average Value
Number
Average Value
LOANS ORIGINATED
13
$135,415
39
$143,682
149
$159,097
6
$58,860
1
$162,000
5
$108,540
3
$21,600
APPLICATIONS APPROVED, NOT ACCEPTED
1
$70,740
2
$76,680
8
$214,650
1
$385,560
0
$0
0
$0
1
$20,520
APPLICATIONS DENIED
4
$101,655
3
$65,880
16
$163,249
3
$20,340
0
$0
1
$10,800
1
$11,340
APPLICATIONS WITHDRAWN
2
$145,800
2
$89,910
17
$175,786
1
$9,180
0
$0
1
$73,980
1
$28,080
FILES CLOSED FOR INCOMPLETENESS
1
$122,580
0
$0
2
$135,270
0
$0
0
$0
0
$0
0
$0
Aggregated Statistics For Year 2008 (Based on 2 partial tracts)
A) FHA, FSA/RHS & VA Home Purchase Loans
B) Conventional Home Purchase Loans
C) Refinancings
D) Home Improvement Loans
E) Loans on Dwellings For 5+ Families
F) Non-occupant Loans on < 5 Family Dwellings (A B C & D)
G) Loans On Manufactured Home Dwelling (A B C & D)
Number
Average Value
Number
Average Value
Number
Average Value
Number
Average Value
Number
Average Value
Number
Average Value
Number
Average Value
LOANS ORIGINATED
15
$137,988
44
$172,358
75
$144,288
8
$84,780
1
$137,160
6
$138,870
2
$18,090
APPLICATIONS APPROVED, NOT ACCEPTED
0
$0
2
$115,560
5
$165,564
1
$92,340
0
$0
0
$0
0
$0
APPLICATIONS DENIED
1
$151,200
5
$75,708
21
$174,394
4
$132,705
0
$0
0
$0
2
$17,550
APPLICATIONS WITHDRAWN
2
$112,860
3
$96,660
9
$148,680
2
$106,110
0
$0
0
$0
0
$0
FILES CLOSED FOR INCOMPLETENESS
0
$0
0
$0
1
$64,260
0
$0
0
$0
0
$0
0
$0
Aggregated Statistics For Year 2007 (Based on 2 partial tracts)
A) FHA, FSA/RHS & VA Home Purchase Loans
B) Conventional Home Purchase Loans
C) Refinancings
D) Home Improvement Loans
E) Loans on Dwellings For 5+ Families
F) Non-occupant Loans on < 5 Family Dwellings (A B C & D)
G) Loans On Manufactured Home Dwelling (A B C & D)
Number
Average Value
Number
Average Value
Number
Average Value
Number
Average Value
Number
Average Value
Number
Average Value
Number
Average Value
LOANS ORIGINATED
3
$145,800
66
$139,885
49
$128,112
8
$46,508
1
$72,900
2
$78,300
4
$13,905
APPLICATIONS APPROVED, NOT ACCEPTED
0
$0
6
$109,530
5
$150,552
2
$18,090
0
$0
1
$14,580
1
$3,780
APPLICATIONS DENIED
0
$0
5
$134,568
15
$131,508
6
$53,640
1
$216,000
1
$60,480
1
$20,520
APPLICATIONS WITHDRAWN
0
$0
2
$168,750
11
$125,427
1
$21,600
0
$0
0
$0
0
$0
FILES CLOSED FOR INCOMPLETENESS
0
$0
1
$259,200
4
$179,415
0
$0
0
$0
0
$0
0
$0
Aggregated Statistics For Year 2006 (Based on 2 partial tracts)
A) FHA, FSA/RHS & VA Home Purchase Loans
B) Conventional Home Purchase Loans
C) Refinancings
D) Home Improvement Loans
E) Loans on Dwellings For 5+ Families
F) Non-occupant Loans on < 5 Family Dwellings (A B C & D)
G) Loans On Manufactured Home Dwelling (A B C & D)
Number
Average Value
Number
Average Value
Number
Average Value
Number
Average Value
Number
Average Value
Number
Average Value
Number
Average Value
LOANS ORIGINATED
3
$160,740
76
$141,842
37
$121,296
10
$55,404
1
$102,600
9
$90,240
3
$13,140
APPLICATIONS APPROVED, NOT ACCEPTED
0
$0
4
$64,260
6
$136,800
2
$9,180
0
$0
0
$0
2
$18,360
APPLICATIONS DENIED
0
$0
7
$58,397
18
$114,330
8
$74,385
0
$0
1
$1,080
2
$2,970
APPLICATIONS WITHDRAWN
1
$76,680
1
$58,860
11
$132,889
2
$155,520
0
$0
0
$0
0
$0
FILES CLOSED FOR INCOMPLETENESS
0
$0
0
$0
3
$193,500
0
$0
0
$0
0
$0
0
$0
Aggregated Statistics For Year 2005 (Based on 2 partial tracts)
A) FHA, FSA/RHS & VA Home Purchase Loans
B) Conventional Home Purchase Loans
C) Refinancings
D) Home Improvement Loans
E) Loans on Dwellings For 5+ Families
F) Non-occupant Loans on < 5 Family Dwellings (A B C & D)
G) Loans On Manufactured Home Dwelling (A B C & D)
Number
Average Value
Number
Average Value
Number
Average Value
Number
Average Value
Number
Average Value
Number
Average Value
Number
Average Value
LOANS ORIGINATED
5
$130,356
76
$120,676
61
$133,964
13
$39,711
1
$239,220
6
$122,760
4
$19,440
APPLICATIONS APPROVED, NOT ACCEPTED
0
$0
1
$60,480
10
$119,664
2
$42,120
0
$0
1
$28,080
0
$0
APPLICATIONS DENIED
0
$0
12
$60,390
24
$122,445
5
$23,436
0
$0
1
$138,240
6
$15,930
APPLICATIONS WITHDRAWN
0
$0
5
$111,024
19
$130,367
2
$27,810
0
$0
1
$106,920
1
$5,940
FILES CLOSED FOR INCOMPLETENESS
0
$0
1
$71,280
6
$151,290
0
$0
0
$0
0
$0
0
$0
Aggregated Statistics For Year 2004 (Based on 2 partial tracts)
A) FHA, FSA/RHS & VA Home Purchase Loans
B) Conventional Home Purchase Loans
C) Refinancings
D) Home Improvement Loans
E) Loans on Dwellings For 5+ Families
F) Non-occupant Loans on < 5 Family Dwellings (A B C & D)
G) Loans On Manufactured Home Dwelling (A B C & D)
Number
Average Value
Number
Average Value
Number
Average Value
Number
Average Value
Number
Average Value
Number
Average Value
Number
Average Value
LOANS ORIGINATED
9
$103,260
71
$132,886
73
$111,617
8
$23,760
1
$91,800
8
$90,045
2
$16,200
APPLICATIONS APPROVED, NOT ACCEPTED
1
$72,360
4
$128,115
6
$104,310
1
$24,300
1
$44,820
0
$0
0
$0
APPLICATIONS DENIED
1
$90,180
5
$71,064
19
$192,240
8
$48,195
0
$0
1
$540
2
$19,980
APPLICATIONS WITHDRAWN
0
$0
3
$83,700
15
$94,824
1
$81,540
0
$0
0
$0
0
$0
FILES CLOSED FOR INCOMPLETENESS
0
$0
1
$73,980
3
$89,640
1
$15,120
0
$0
0
$0
1
$10,800
Aggregated Statistics For Year 2003 (Based on 2 partial tracts)
A) FHA, FSA/RHS & VA Home Purchase Loans
B) Conventional Home Purchase Loans
C) Refinancings
D) Home Improvement Loans
F) Non-occupant Loans on < 5 Family Dwellings (A B C & D)
Number
Average Value
Number
Average Value
Number
Average Value
Number
Average Value
Number
Average Value
LOANS ORIGINATED
4
$111,105
65
$127,124
209
$113,803
9
$31,500
5
$88,884
APPLICATIONS APPROVED, NOT ACCEPTED
0
$0
2
$181,170
12
$110,430
2
$6,750
1
$59,940
APPLICATIONS DENIED
0
$0
7
$48,986
23
$98,937
3
$29,160
1
$28,080
APPLICATIONS WITHDRAWN
0
$0
3
$98,640
24
$112,455
0
$0
0
$0
FILES CLOSED FOR INCOMPLETENESS
0
$0
2
$96,120
2
$121,770
1
$13,500
0
$0
Aggregated Statistics For Year 2002 (Based on 2 partial tracts)
A) FHA, FSA/RHS & VA Home Purchase Loans
B) Conventional Home Purchase Loans
C) Refinancings
D) Home Improvement Loans
F) Non-occupant Loans on < 5 Family Dwellings (A B C & D)
Number
Average Value
Number
Average Value
Number
Average Value
Number
Average Value
Number
Average Value
LOANS ORIGINATED
5
$107,244
72
$118,732
173
$111,905
13
$23,137
5
$60,912
APPLICATIONS APPROVED, NOT ACCEPTED
0
$0
4
$137,835
11
$91,555
2
$9,720
0
$0
APPLICATIONS DENIED
0
$0
6
$23,490
27
$107,480
2
$8,910
2
$12,690
APPLICATIONS WITHDRAWN
0
$0
3
$120,960
21
$103,577
1
$11,340
0
$0
FILES CLOSED FOR INCOMPLETENESS
0
$0
1
$3,780
2
$155,790
0
$0
1
$3,780
Aggregated Statistics For Year 2001 (Based on 2 partial tracts)
A) FHA, FSA/RHS & VA Home Purchase Loans
B) Conventional Home Purchase Loans
C) Refinancings
D) Home Improvement Loans
E) Loans on Dwellings For 5+ Families
F) Non-occupant Loans on < 5 Family Dwellings (A B C & D)
Number
Average Value
Number
Average Value
Number
Average Value
Number
Average Value
Number
Average Value
Number
Average Value
LOANS ORIGINATED
3
$72,180
53
$103,028
156
$106,255
16
$23,591
1
$934,200
5
$60,480
APPLICATIONS APPROVED, NOT ACCEPTED
1
$58,860
4
$71,820
10
$84,726
2
$5,400
0
$0
1
$9,180
APPLICATIONS DENIED
1
$36,720
7
$24,686
15
$88,416
2
$7,020
0
$0
1
$20,520
APPLICATIONS WITHDRAWN
0
$0
3
$85,680
11
$103,827
1
$9,180
0
$0
0
$0
FILES CLOSED FOR INCOMPLETENESS
0
$0
1
$35,100
2
$115,830
0
$0
0
$0
0
$0
Aggregated Statistics For Year 2000 (Based on 2 partial tracts)
A) FHA, FSA/RHS & VA Home Purchase Loans
B) Conventional Home Purchase Loans
C) Refinancings
D) Home Improvement Loans
E) Loans on Dwellings For 5+ Families
F) Non-occupant Loans on < 5 Family Dwellings (A B C & D)
Number
Average Value
Number
Average Value
Number
Average Value
Number
Average Value
Number
Average Value
Number
Average Value
LOANS ORIGINATED
6
$98,640
52
$95,725
39
$93,143
16
$13,061
1
$862,920
3
$81,900
APPLICATIONS APPROVED, NOT ACCEPTED
0
$0
1
$51,300
2
$57,240
2
$18,900
0
$0
0
$0
APPLICATIONS DENIED
0
$0
8
$56,295
7
$121,963
5
$4,428
0
$0
0
$0
APPLICATIONS WITHDRAWN
0
$0
3
$83,700
5
$107,136
0
$0
0
$0
0
$0
FILES CLOSED FOR INCOMPLETENESS
0
$0
0
$0
1
$52,920
0
$0
0
$0
0
$0
Aggregated Statistics For Year 1999 (Based on 1 partial tract)
A) FHA, FSA/RHS & VA Home Purchase Loans
B) Conventional Home Purchase Loans
C) Refinancings
D) Home Improvement Loans
F) Non-occupant Loans on < 5 Family Dwellings (A B C & D)
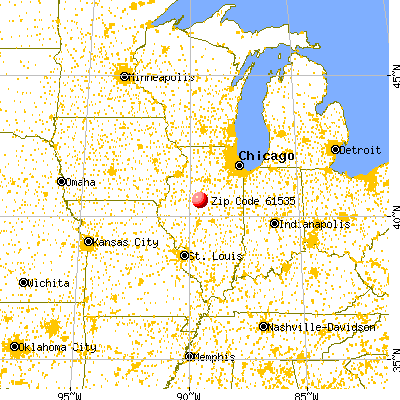


 Nearest zip codes: 61568, 61550, 61610, 61554, 61602, 61611.