Estimated zip code population in 2022: 1,621 Zip code population in 2010: 1,547 Zip code population in 2000: 1,268
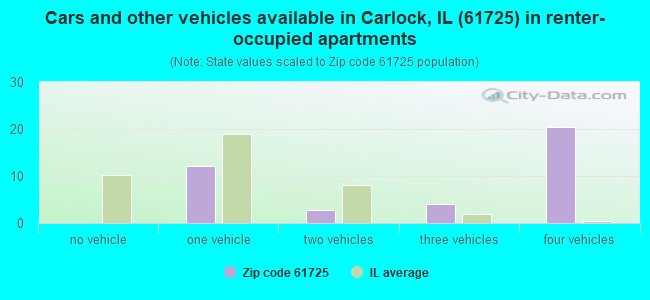
Houses and condos: 630 Renter-occupied apartments: 42
% of renters here:
7%
State:
33%
March 2022 cost of living index in zip code 61725: 86.2 (less than average, U.S. average is 100)
Land area: 48.1 sq. mi. Water area: 0.0 sq. mi.
Population density: 34 people per square mile
(very low).
OSM Map
General Map
Google Map
MSN Map
OSM Map
General Map
Google Map
MSN Map
OSM Map
General Map
Google Map
MSN Map
OSM Map
General Map
Google Map
MSN Map
Please wait while loading the map...
Real estate property taxes paid for housing units in 2022:
This zip code:
1.9% ($4,378)
Illinois:
2.0% ($4,912)
Median real estate property taxes paid for housing units with mortgages in 2022: $4,766 (1.9%) Median real estate property taxes paid for housing units with no mortgage in 2022: $4,249 (1.9%)
Business Search- 14 Million verified businesses
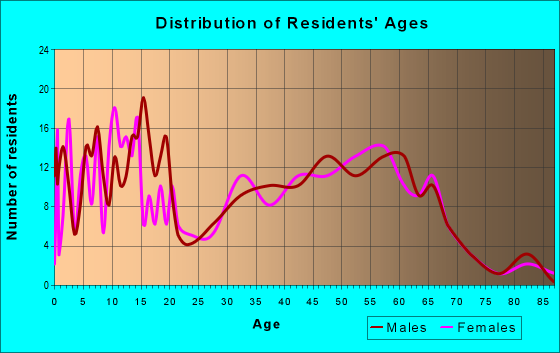
Males: 761
(47.0%)
Females: 859
(53.0%)
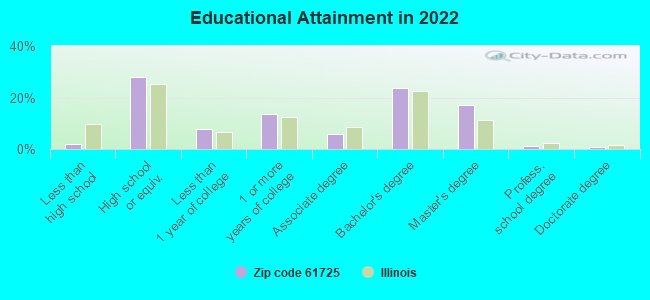
For population 25 years and over in 61725:
High school or higher: 97.8%
Bachelor's degree or higher: 42.7%
Graduate or professional degree: 19.1%
Unemployed: 0.9%
Mean travel time to work (commute): 24.1 minutes
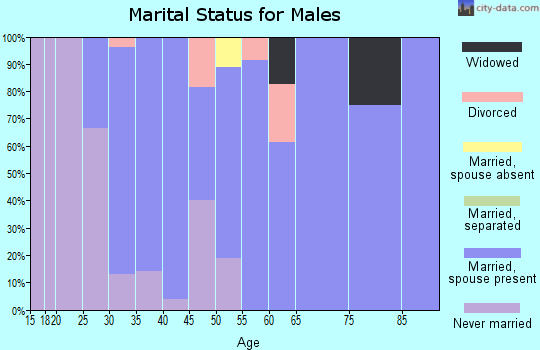
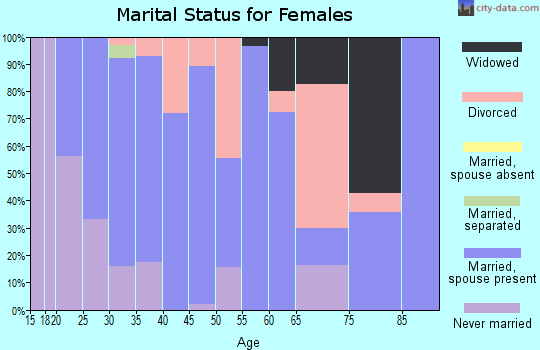
For population 15 years and over in 61725:
Never married: 26.0%
Now married: 62.1%
Separated: 1.0%
Widowed: 3.1%
Divorced: 7.9%
Zip code 61725 compared to state average:
Median household income above state average.
Unemployed percentage significantly below state average.
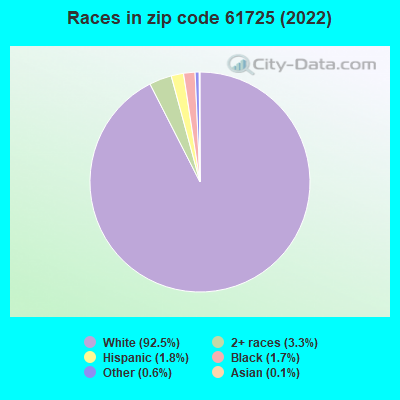
Black race population percentage significantly below state average.
Hispanic race population percentage significantly below state average.
Foreign-born population percentage significantly below state average.
Renting percentage significantly below state average.
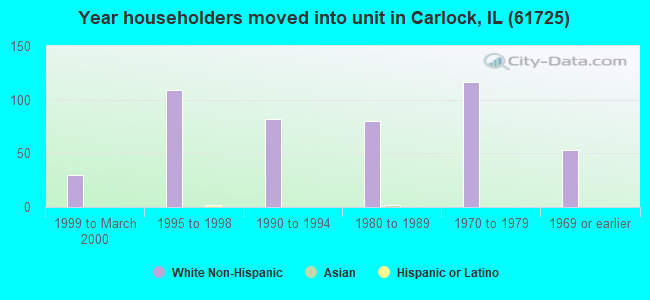
Length of stay since moving in significantly above state average.
Averages for the 2020 tax year for zip code 61725, filed in 2021:
Average Adjusted Gross Income (AGI) in 2020: $95,463 (Individual Income Tax Returns)
Here:
$95,463
State:
$82,626
Salary/wage: $65,455 (reported on 81.6% of returns)
Here:
$65,455
State:
$66,640
(% of AGI for various income ranges: 1104.2% for AGIs below $25k, 3587.3% for AGIs $25k-50k, 5728.8% for AGIs $50k-75k, 8630.0% for AGIs $75k-100k, 12810.0% for AGIs $100k-200k)
Taxable interest for individuals: $1,344 (reported on 56.6% of returns)
This zip code:
$1,344
Illinois:
$2,376
(% of AGI for various income ranges: 22.5% for AGIs below $25k, 22.7% for AGIs $25k-50k, 30.0% for AGIs $50k-75k, 78.3% for AGIs $75k-100k, 185.0% for AGIs $100k-200k)
Ordinary dividends: $4,878 (reported on 30.3% of returns)
Here:
$4,878
State:
$9,061
(% of AGI for various income ranges: 68.3% for AGIs below $25k, 25.5% for AGIs $25k-50k, 75.0% for AGIs $50k-75k, 256.7% for AGIs $75k-100k, 272.5% for AGIs $100k-200k)
Net capital gain/loss in AGI: +$5,657 (reported on 27.6% of returns)
Here:
+$5,657
State:
+$31,684
(% of AGI for various income ranges: 6.7% for AGIs below $25k, 136.2% for AGIs $50k-75k, 81.7% for AGIs $75k-100k, 438.3% for AGIs $100k-200k)
Profit/loss from business: +$12,308 (reported on 15.8% of returns)
Here:
+$12,308
State:
+$12,175
(% of AGI for various income ranges: 104.2% for AGIs below $25k, 58.2% for AGIs $25k-50k, 315.0% for AGIs $50k-75k, 863.3% for AGIs $100k-200k)
Taxable individual retirement arrangement distribution: $22,982 (reported on 14.5% of returns)
61725:
$22,982
Illinois:
$21,613
(% of AGI for various income ranges: 179.1% for AGIs $25k-50k, 661.2% for AGIs $50k-75k, 1501.7% for AGIs $100k-200k)
Total itemized deductions: $40,850 (reported on 7.9% of returns)
Here:
$40,850
State:
$34,948
(% of AGI for various income ranges: 2042.5% for AGIs $100k-200k)
Charity contributions: $20,660 (reported on 6.6% of returns)
Here:
$20,660
State:
$13,122
(% of AGI for various income ranges: 860.8% for AGIs $100k-200k)
Taxes paid: $9,133 (reported on 7.9% of returns)
61725:
$9,133
State:
$8,563
(% of AGI for various income ranges: 110.9% for AGIs $25k-50k, 355.0% for AGIs $100k-200k)
Earned income credit: $2,317 (reported on 7.9% of returns)
Here:
$2,317
State:
$2,311
(% of AGI for various income ranges: 50.0% for AGIs below $25k, 71.8% for AGIs $25k-50k)
Percentage of individuals using paid preparers for their 2020 taxes: 92.1%
Here:
92%
State:
93%
(% for various income ranges: 94.1% for AGIs below $25k, 93.3% for AGIs $25k-50k, 90.9% for AGIs $50k-75k, 88.9% for AGIs $75k-100k, 88.9% for AGIs $100k-200k, 100.0% for AGIs over 200k)
Averages for the 2012 tax year for zip code 61725, filed in 2013:
Average Adjusted Gross Income (AGI) in 2012: $69,961 (Individual Income Tax Returns)
Here:
$69,961
State:
$68,058
Salary/wage: $54,066 (reported on 86.1% of returns)
Here:
$54,066
State:
$55,396
(% of AGI for various income ranges: 74.3% for AGIs below $25k, 85.1% for AGIs $25k-50k, 76.7% for AGIs $50k-75k, 67.4% for AGIs $75k-100k, 66.2% for AGIs $100k-200k, 48.7% for AGIs over 200k)
Taxable interest for individuals: $822 (reported on 51.9% of returns)
This zip code:
$822
Illinois:
$1,969
(% of AGI for various income ranges: 1.2% for AGIs below $25k, 0.4% for AGIs $25k-50k, 0.8% for AGIs $50k-75k, 0.6% for AGIs $75k-100k, 0.6% for AGIs $100k-200k, 0.4% for AGIs over 200k)
Ordinary dividends: $4,529 (reported on 26.6% of returns)
Here:
$4,529
State:
$7,786
(% of AGI for various income ranges: 2.7% for AGIs below $25k, 0.4% for AGIs $25k-50k, 0.4% for AGIs $50k-75k, 0.7% for AGIs $75k-100k, 4.1% for AGIs $100k-200k)
Net capital gain/loss in AGI: +$10,873 (reported on 19.0% of returns)
Here:
+$10,873
State:
+$22,183
(% of AGI for various income ranges: 0.2% for AGIs $50k-75k, 8.6% for AGIs $100k-200k)
Profit/loss from business: +$10,658 (reported on 15.2% of returns)
Here:
+$10,658
State:
+$12,903
(% of AGI for various income ranges: 5.9% for AGIs $25k-50k, 1.2% for AGIs $75k-100k, 4.4% for AGIs $100k-200k)
Taxable individual retirement arrangement distribution: $14,825 (reported on 10.1% of returns)
61725:
$14,825
Illinois:
$17,929
(% of AGI for various income ranges: 4.9% for AGIs below $25k, 5.5% for AGIs $50k-75k, 3.3% for AGIs $100k-200k)
Total itemized deductions: $22,842 (19% of AGI, reported on 39.2% of returns)
Here:
$22,842
State:
$26,433
Here:
19.1% of AGI
State:
19.2% of AGI
(% of AGI for various income ranges: 12.5% for AGIs below $25k, 9.5% for AGIs $25k-50k, 12.6% for AGIs $50k-75k, 12.7% for AGIs $75k-100k, 13.8% for AGIs $100k-200k, 13.2% for AGIs over 200k)
Charity contributions: $5,854 (reported on 30.4% of returns)
Here:
$5,854
State:
$4,525
(% of AGI for various income ranges: 1.5% for AGIs $25k-50k, 1.0% for AGIs $50k-75k, 2.1% for AGIs $75k-100k, 2.2% for AGIs $100k-200k, 5.4% for AGIs over 200k)
Taxes paid: $9,597 (reported on 39.2% of returns)
61725:
$9,597
State:
$11,968
(% of AGI for various income ranges: 4.4% for AGIs $25k-50k, 4.8% for AGIs $50k-75k, 5.4% for AGIs $75k-100k, 6.4% for AGIs $100k-200k, 5.8% for AGIs over 200k)
Earned income credit: $2,125 (reported on 10.1% of returns)
Here:
$2,125
State:
$2,349
(% of AGI for various income ranges: 4.2% for AGIs below $25k, 0.8% for AGIs $25k-50k)
Percentage of individuals using paid preparers for their 2012 taxes: 53.2%
Here:
53%
State:
57%
(% for various income ranges: 41.7% for AGIs below $25k, 56.2% for AGIs $25k-50k, 53.8% for AGIs $50k-75k, 55.6% for AGIs $75k-100k, 57.1% for AGIs $100k-200k, 100.0% for AGIs over 200k)
Averages for the 2004 tax year for zip code 61725, filed in 2005:
Average Adjusted Gross Income (AGI) in 2004: $52,791 (Individual Income Tax Returns)
Here:
$52,791
State:
$54,625
Salary/wage: $48,301 (reported on 84.2% of returns)
Here:
$48,301
State:
$46,811
(% of AGI for various income ranges: 201.1% for AGIs below $10k, 71.8% for AGIs $10k-25k, 76.3% for AGIs $25k-50k, 79.8% for AGIs $50k-75k, 86.8% for AGIs $75k-100k, 69.1% for AGIs over 100k)
Taxable interest for individuals: $1,265 (reported on 64.9% of returns)
This zip code:
$1,265
Illinois:
$2,101
(% of AGI for various income ranges: 23.7% for AGIs below $10k, 4.2% for AGIs $10k-25k, 1.5% for AGIs $25k-50k, 1.0% for AGIs $50k-75k, 1.0% for AGIs $75k-100k, 1.4% for AGIs over 100k)
Taxable dividends: $1,872 (reported on 34.4% of returns)
Here:
$1,872
State:
$4,306
(% of AGI for various income ranges: 10.4% for AGIs below $10k, 1.8% for AGIs $10k-25k, 1.5% for AGIs $25k-50k, 0.5% for AGIs $50k-75k, 0.5% for AGIs $75k-100k, 1.7% for AGIs over 100k)
Net capital gain/loss: +$946 (reported on 26.5% of returns)
Here:
+$946
State:
+$17,321
(% of AGI for various income ranges: -14.4% for AGIs below $10k, -0.6% for AGIs $10k-25k, 0.9% for AGIs $25k-50k, 1.4% for AGIs $50k-75k, -0.1% for AGIs $75k-100k, 0.4% for AGIs over 100k)
Profit/loss from business: +$7,059 (reported on 16.9% of returns)
Here:
+$7,059
State:
+$11,771
(% of AGI for various income ranges: -9.4% for AGIs below $10k, 3.8% for AGIs $25k-50k, 5.0% for AGIs $50k-75k, -0.0% for AGIs $75k-100k, 1.6% for AGIs over 100k)
Profit/loss from farming: +$2,717 (reported on 8.5% of returns)
Here:
+$2,717
State:
+$2,327
(% of AGI for various income ranges: -11.2% for AGIs below $10k, 1.0% for AGIs $25k-50k, 0.9% for AGIs $50k-75k, 0.9% for AGIs $75k-100k)
IRA payment deduction: $3,217 (reported on 3.3% of returns)
61725:
$3,217
Illinois:
$3,087
Total itemized deductions: $17,925 (21% of AGI, reported on 38.0% of returns)
Here:
$17,925
State:
$20,239
Here:
20.9% of AGI
State:
19.5% of AGI
(% of AGI for various income ranges: 23.8% for AGIs $10k-25k, 13.7% for AGIs $25k-50k, 12.7% for AGIs $50k-75k, 12.8% for AGIs $75k-100k, 11.6% for AGIs over 100k)
Charity contributions deductions: $3,476 (4% of AGI, reported on 32.3% of returns)
Here:
$3,476
State:
$3,719
Here:
3.8% of AGI
State:
3.4% of AGI
(% of AGI for various income ranges: 0.6% for AGIs $10k-25k, 1.6% for AGIs $25k-50k, 1.7% for AGIs $50k-75k, 2.5% for AGIs $75k-100k, 2.7% for AGIs over 100k)
Total tax: $8,181 (reported on 78.4% of returns)
61725:
$8,181
State:
$9,882
(% of AGI for various income ranges: 6.1% for AGIs below $10k, 4.9% for AGIs $10k-25k, 7.6% for AGIs $25k-50k, 8.9% for AGIs $50k-75k, 10.3% for AGIs $75k-100k, 17.9% for AGIs over 100k)
Earned income credit: $1,865 (reported on 5.3% of returns)
Here:
$1,865
State:
$1,788
Percentage of individuals using paid preparers for their 2004 taxes: 57.5%
Here:
57%
State:
61%
(% for various income ranges: 60.8% for AGIs below $10k, 54.2% for AGIs $10k-25k, 59.9% for AGIs $25k-50k, 55.9% for AGIs $50k-75k, 51.9% for AGIs $75k-100k, 59.6% for AGIs over 100k)
Household received Food Stamps/SNAP in the past 12 months: 12 Household did not receive Food Stamps/SNAP in the past 12 months: 595
Women who had a birth in the past 12 months: 4 (4 now married, 0 unmarried) Women who did not have a birth in the past 12 months: 298 (201 now married, 93 unmarried)
Housing units in zip code 61725 with a mortgage: 346 (9 second mortgage, 9 both second mortgage and home equity loan) Houses without a mortgage: 3
Median monthly owner costs for units with a mortgage: $1,774 Median monthly owner costs for units without a mortgage: $604
Residents with income below the poverty level in 2022:
This zip code:
5.3%
Whole state:
11.9%
Residents with income below 50% of the poverty level in 2022:
This zip code:
1.2%
Whole state:
5.7%
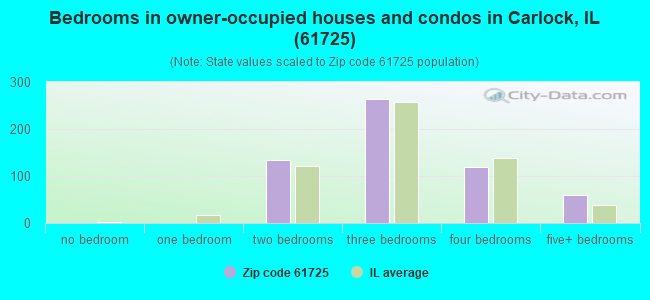
Median number of rooms in houses and condos:
Here:
7.3
State:
6.4
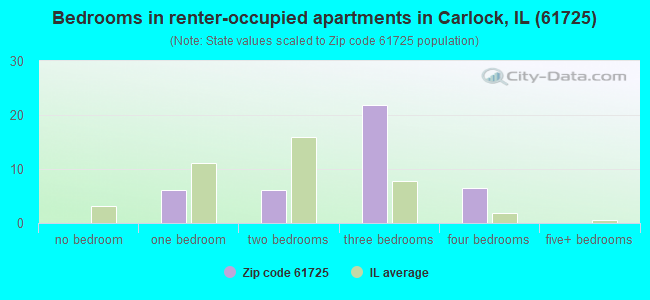
Median number of rooms in apartments:
Here:
6.7
State:
4.1
Notable locations in this zip code not listed on our city pages
Cemeteries: Wintz Cemetery (1), White Oak Cemetery (2), Oak Grove Cemetery (3), Maurer Cemetery (4), Ropp Cemetery (5), Denman Cemetery (6), Troyer Cemetery (7). Display/hide their locations on the map
Size of family households: 224 2-persons, 70 3-persons, 76 4-persons, 39 5-persons, 17 7-or-more-persons
Size of nonfamily households: 125 1-person, 40 2-persons, 23 3-persons
377 married couples with children.
0 single-parent households ().
98.9% of residents of 61725 zip code speak English at home.
0.4% of residents speak Spanish at home (100% not well).
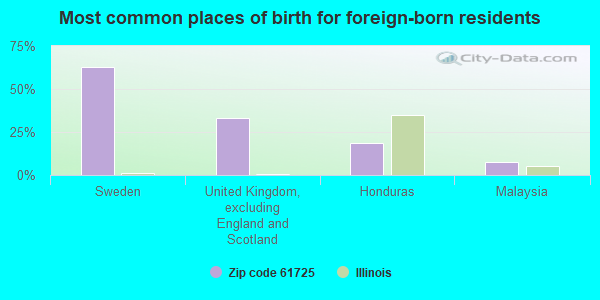
Foreign born population: 27 (1.7%) (66.9% of them are naturalized citizens)
This zip code:
1.7%
Whole state:
14.4%
63%Sweden
33%United Kingdom, excluding England and Scotland
19%Honduras
7%Malaysia
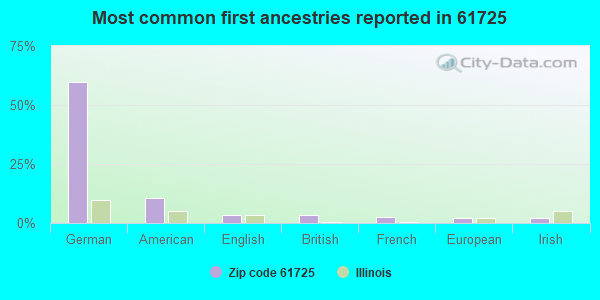
60%German
11%American
4%English
3%British
2%French
2%European
2%Irish
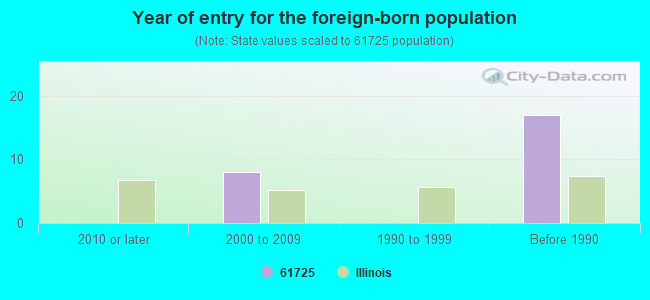
Year of entry for the foreign-born population
02010 or later
82000 to 2009
01990 to 1999
17Before 1990
Facilities with environmental interests located in this zip code:
MCLEAN COUNTY SERVICE CO (101 WEST WASHINGTON in CARLOCK, IL)
STATE MASTER (Illinois EPA Project) - AIR PROGRAM AIR MINOR (AIRS/AFS) Business SIC classification: GRAIN AND FIELD BEANS
PIERCY AUTO BODY (RTE 150 E in CARLOCK, IL)
STATE MASTER (Illinois EPA Project) - HAZARDOUS WASTE PROGRAM Small Quantity Generators, between 100 kg and 1000 kg of hazardous waste/month (Resource Conservation and Recovery Act (tracking hazardous waste)) - notification Organizations: PIERCY CURT (CONTACT/OWNER)
AMOCO FERTILIZER PLANT (EAST EDGE OF CARLOCK ON RTE 9 in CARLOCK, IL)
(Resource Conservation and Recovery Act (tracking hazardous waste))
ILDOT BRG 057 0112 (TR 90 OVER I74 in CARLOCK, IL)
Small Quantity Generators, between 100 kg and 1000 kg of hazardous waste/month (Resource Conservation and Recovery Act (tracking hazardous waste)) - notification
Housing units lacking complete kitchen facilities: 1.7%
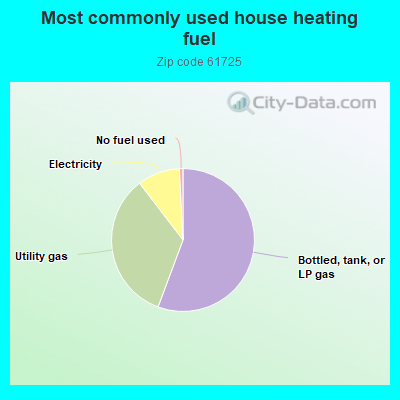
55.8%Bottled, tank, or LP gas
34.0%Utility gas
9.6%Electricity
0.8%No fuel used
Population in 1990: 1,066. Population change in the 1990s: +202 (+18.9%).
Place of birth for U.S.-born residents:
This state: 1,406
Northeast: 12
Midwest: 78
South: 52
West: 37
74% of the 61725 zip code residents lived in the same house 5 years ago. Out of people who lived in different houses, 42% lived in this county. Out of people who lived in different counties, 50% lived in Illinois.
94% of the 61725 zip code residents lived in the same house 1 year ago. Out of people who lived in different houses, 35% moved from this county. Out of people who lived in different houses, 42% moved from different county within same state. Out of people who lived in different houses, 25% moved from different state.
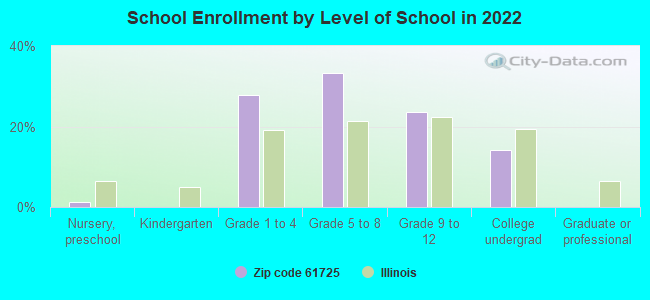
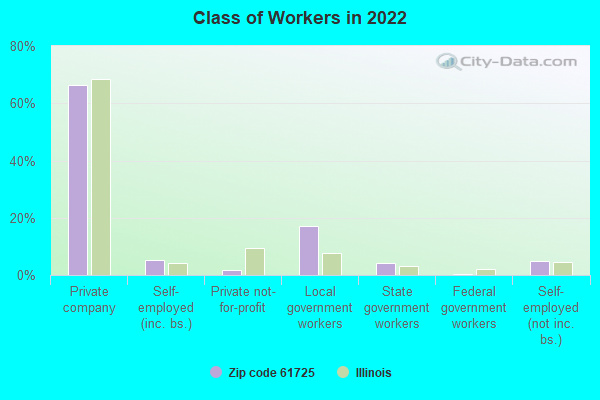
Private vs. public school enrollment:
Students in private schools in grades 1 to 8 (elementary and middle school): 62
Here:
24.2%
Illinois:
13.3%
Students in private schools in grades 9 to 12 (high school): 56
Here:
57.4%
Illinois:
9.9%
Students in private undergraduate colleges: 2
Here:
4.7%
Illinois:
27.4%
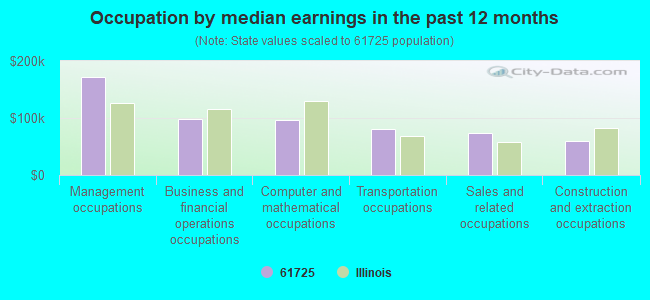
Occupation by median earnings in the past 12 months ($)
172,659Management occupations
98,398Business and financial operations occupations
95,898Computer and mathematical occupations
80,047Transportation occupations
74,062Sales and related occupations
59,348Construction and extraction occupations
Companies with federal contracts located in this zip code:
WHITE OAK PRECISION (103 W LEE ST in CARLOCK, IL; small business)
$3,026 with Army for Miscellaneous Weapons. Signed on 2005-06-09. Completion date: 2005-06-30.
Top industries in this zip code by the number of employees in 2005:
Accommodation and Food Services: Full-Service Restaurants (20-49 employees: 1 establishment)
Administrative and Support and Waste Management and Remediation Services: Landscaping Services (10-19: 1, 1-4: 1)
Other Services (except Public Administration): Automotive Body, Paint, and Interior Repair and Maintenance (10-19: 1, 1-4: 1)
Other Services (except Public Administration): Commercial and Industrial Machinery and Equipment (except Automotive and Electronic) Repair and Maintenance (10-19: 1)
Other Services (except Public Administration): Religious Organizations (10-19: 1)
Finance and Insurance: Insurance Agencies and Brokerages (5-9: 1)
Construction: Masonry Contractors (5-9: 1)
Finance and Insurance: Commercial Banking (5-9: 1)
Home Mortgage Disclosure Act Aggregated Statistics For Year 2009 (Based on 4 partial tracts)
A) FHA, FSA/RHS & VA Home Purchase Loans
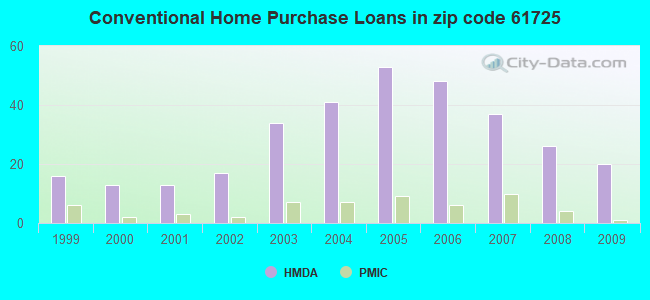
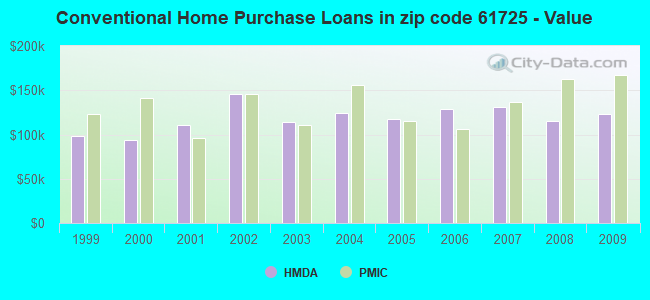
B) Conventional Home Purchase Loans
C) Refinancings
D) Home Improvement Loans
F) Non-occupant Loans on < 5 Family Dwellings (A B C & D)
Number
Average Value
Number
Average Value
Number
Average Value
Number
Average Value
Number
Average Value
LOANS ORIGINATED
9
$118,571
20
$123,308
169
$137,061
7
$53,737
7
$69,416
APPLICATIONS APPROVED, NOT ACCEPTED
1
$214,920
1
$82,640
8
$137,574
0
$0
0
$0
APPLICATIONS DENIED
1
$82,190
1
$120,540
21
$137,287
2
$79,825
0
$0
APPLICATIONS WITHDRAWN
0
$0
1
$172,030
11
$160,319
1
$134,240
0
$0
FILES CLOSED FOR INCOMPLETENESS
1
$62,380
0
$0
1
$150,450
0
$0
0
$0
Aggregated Statistics For Year 2008 (Based on 4 partial tracts)
A) FHA, FSA/RHS & VA Home Purchase Loans
B) Conventional Home Purchase Loans
C) Refinancings
D) Home Improvement Loans
F) Non-occupant Loans on < 5 Family Dwellings (A B C & D)
Number
Average Value
Number
Average Value
Number
Average Value
Number
Average Value
Number
Average Value
LOANS ORIGINATED
9
$134,736
26
$115,347
73
$157,362
8
$123,904
10
$84,131
APPLICATIONS APPROVED, NOT ACCEPTED
0
$0
0
$0
3
$148,623
2
$23,765
0
$0
APPLICATIONS DENIED
1
$139,410
3
$114,913
13
$139,039
3
$150,880
1
$29,880
APPLICATIONS WITHDRAWN
0
$0
2
$100,740
10
$113,135
0
$0
0
$0
FILES CLOSED FOR INCOMPLETENESS
0
$0
0
$0
1
$47,700
0
$0
0
$0
Aggregated Statistics For Year 2007 (Based on 4 partial tracts)
A) FHA, FSA/RHS & VA Home Purchase Loans
B) Conventional Home Purchase Loans
C) Refinancings
D) Home Improvement Loans
F) Non-occupant Loans on < 5 Family Dwellings (A B C & D)
G) Loans On Manufactured Home Dwelling (A B C & D)
Number
Average Value
Number
Average Value
Number
Average Value
Number
Average Value
Number
Average Value
Number
Average Value
LOANS ORIGINATED
6
$118,683
37
$131,024
57
$128,052
9
$84,952
7
$108,973
1
$2,100
APPLICATIONS APPROVED, NOT ACCEPTED
0
$0
3
$106,587
9
$120,806
3
$13,893
1
$34,920
0
$0
APPLICATIONS DENIED
0
$0
7
$118,419
27
$136,455
7
$59,997
1
$67,320
1
$15,730
APPLICATIONS WITHDRAWN
0
$0
3
$151,907
9
$158,339
1
$52,050
0
$0
0
$0
FILES CLOSED FOR INCOMPLETENESS
0
$0
1
$60,280
2
$168,140
0
$0
0
$0
0
$0
Aggregated Statistics For Year 2006 (Based on 4 partial tracts)
A) FHA, FSA/RHS & VA Home Purchase Loans
B) Conventional Home Purchase Loans
C) Refinancings
D) Home Improvement Loans
F) Non-occupant Loans on < 5 Family Dwellings (A B C & D)
Number
Average Value
Number
Average Value
Number
Average Value
Number
Average Value
Number
Average Value
LOANS ORIGINATED
5
$90,072
48
$129,006
46
$126,990
16
$46,939
5
$89,394
APPLICATIONS APPROVED, NOT ACCEPTED
0
$0
2
$221,210
7
$119,657
2
$25,890
1
$29,360
APPLICATIONS DENIED
0
$0
2
$147,250
22
$134,856
8
$45,830
0
$0
APPLICATIONS WITHDRAWN
0
$0
2
$155,215
20
$134,220
1
$69,670
0
$0
FILES CLOSED FOR INCOMPLETENESS
0
$0
2
$195,170
3
$140,783
0
$0
0
$0
Aggregated Statistics For Year 2005 (Based on 4 partial tracts)
A) FHA, FSA/RHS & VA Home Purchase Loans
B) Conventional Home Purchase Loans
C) Refinancings
D) Home Improvement Loans
F) Non-occupant Loans on < 5 Family Dwellings (A B C & D)
G) Loans On Manufactured Home Dwelling (A B C & D)
Number
Average Value
Number
Average Value
Number
Average Value
Number
Average Value
Number
Average Value
Number
Average Value
LOANS ORIGINATED
6
$124,070
53
$117,054
61
$136,092
11
$53,970
8
$71,989
1
$18,480
APPLICATIONS APPROVED, NOT ACCEPTED
1
$87,060
5
$89,202
7
$104,951
1
$3,670
1
$53,050
0
$0
APPLICATIONS DENIED
0
$0
3
$50,677
33
$114,500
5
$51,894
0
$0
1
$23,590
APPLICATIONS WITHDRAWN
0
$0
4
$104,940
22
$118,185
1
$113,240
1
$65,290
0
$0
FILES CLOSED FOR INCOMPLETENESS
0
$0
0
$0
1
$147,030
0
$0
0
$0
0
$0
Aggregated Statistics For Year 2004 (Based on 4 partial tracts)
A) FHA, FSA/RHS & VA Home Purchase Loans
B) Conventional Home Purchase Loans
C) Refinancings
D) Home Improvement Loans
F) Non-occupant Loans on < 5 Family Dwellings (A B C & D)
G) Loans On Manufactured Home Dwelling (A B C & D)
Number
Average Value
Number
Average Value
Number
Average Value
Number
Average Value
Number
Average Value
Number
Average Value
LOANS ORIGINATED
5
$127,712
41
$123,759
78
$109,813
16
$47,778
7
$95,886
0
$0
APPLICATIONS APPROVED, NOT ACCEPTED
0
$0
3
$175,617
8
$121,851
1
$10,050
0
$0
0
$0
APPLICATIONS DENIED
0
$0
5
$70,308
28
$123,864
4
$80,880
1
$82,190
1
$61,910
APPLICATIONS WITHDRAWN
0
$0
3
$100,973
13
$120,228
2
$52,965
0
$0
0
$0
FILES CLOSED FOR INCOMPLETENESS
0
$0
0
$0
2
$134,755
0
$0
0
$0
0
$0
Aggregated Statistics For Year 2003 (Based on 4 partial tracts)
A) FHA, FSA/RHS & VA Home Purchase Loans
B) Conventional Home Purchase Loans
C) Refinancings
D) Home Improvement Loans
F) Non-occupant Loans on < 5 Family Dwellings (A B C & D)
Number
Average Value
Number
Average Value
Number
Average Value
Number
Average Value
Number
Average Value
LOANS ORIGINATED
5
$117,762
34
$114,256
233
$116,386
5
$14,756
7
$77,677
APPLICATIONS APPROVED, NOT ACCEPTED
0
$0
1
$111,870
13
$108,494
0
$0
0
$0
APPLICATIONS DENIED
0
$0
3
$101,093
24
$108,079
5
$102,536
1
$89,040
APPLICATIONS WITHDRAWN
0
$0
2
$117,140
23
$159,984
1
$17,300
0
$0
FILES CLOSED FOR INCOMPLETENESS
1
$86,750
0
$0
3
$93,517
0
$0
0
$0
Aggregated Statistics For Year 2002 (Based on 2 partial tracts)
B) Conventional Home Purchase Loans
C) Refinancings
D) Home Improvement Loans
F) Non-occupant Loans on < 5 Family Dwellings (A B C & D)
Number
Average Value
Number
Average Value
Number
Average Value
Number
Average Value
LOANS ORIGINATED
17
$145,204
74
$117,470
6
$30,317
3
$48,750
APPLICATIONS APPROVED, NOT ACCEPTED
0
$0
2
$130,265
1
$2,620
1
$2,620
APPLICATIONS DENIED
1
$34,600
10
$111,707
2
$20,705
1
$56,610
APPLICATIONS WITHDRAWN
1
$69,190
4
$127,250
0
$0
0
$0
FILES CLOSED FOR INCOMPLETENESS
0
$0
0
$0
0
$0
0
$0
Aggregated Statistics For Year 2001 (Based on 2 partial tracts)
A) FHA, FSA/RHS & VA Home Purchase Loans
B) Conventional Home Purchase Loans
C) Refinancings
D) Home Improvement Loans
F) Non-occupant Loans on < 5 Family Dwellings (A B C & D)
Number
Average Value
Number
Average Value
Number
Average Value
Number
Average Value
Number
Average Value
LOANS ORIGINATED
3
$70,943
13
$110,405
58
$118,876
5
$23,380
2
$28,045
APPLICATIONS APPROVED, NOT ACCEPTED
0
$0
1
$187,660
2
$81,515
2
$31,450
1
$93,310
APPLICATIONS DENIED
0
$0
2
$62,905
7
$87,467
1
$11,010
1
$17,820
APPLICATIONS WITHDRAWN
0
$0
0
$0
4
$96,845
1
$20,970
0
$0
FILES CLOSED FOR INCOMPLETENESS
0
$0
1
$62,900
0
$0
0
$0
0
$0
Aggregated Statistics For Year 2000 (Based on 2 partial tracts)
A) FHA, FSA/RHS & VA Home Purchase Loans
B) Conventional Home Purchase Loans
C) Refinancings
D) Home Improvement Loans
F) Non-occupant Loans on < 5 Family Dwellings (A B C & D)
Number
Average Value
Number
Average Value
Number
Average Value
Number
Average Value
Number
Average Value
LOANS ORIGINATED
1
$54,520
13
$93,348
8
$149,528
4
$18,610
1
$24,110
APPLICATIONS APPROVED, NOT ACCEPTED
0
$0
1
$31,450
3
$86,843
2
$12,845
1
$31,450
APPLICATIONS DENIED
0
$0
3
$37,917
2
$57,660
4
$8,388
0
$0
APPLICATIONS WITHDRAWN
0
$0
0
$0
1
$13,110
1
$3,150
0
$0
FILES CLOSED FOR INCOMPLETENESS
0
$0
1
$24,640
0
$0
0
$0
0
$0
Aggregated Statistics For Year 1999 (Based on 2 partial tracts)
A) FHA, FSA/RHS & VA Home Purchase Loans
B) Conventional Home Purchase Loans
C) Refinancings
D) Home Improvement Loans
F) Non-occupant Loans on < 5 Family Dwellings (A B C & D)
Detailed PMIC statistics for the following Tracts:0052.02
, 0306.02
2002 - 2018 National Fire Incident Reporting System (NFIRS) incidents
Based on the data from the years 2002 - 2018 the average number of fire incidents per year is 12. The highest number of fires - 24 took place in 2015, and the least - 0 in 2005. The data has a decreasing trend.
When looking into fire subcategories, the most incidents belonged to: Outside Fires (46.9%), and Structure Fires (29.1%).
Fire incident types reported to NFIRS in Zip Code 61725


 Nearest zip codes: 61771, 61729, 61732, 61748, 61742, 61738.


 Based on the data from the years 2002 - 2018 the average number of fire incidents per year is 12. The highest number of fires - 24 took place in 2015, and the least - 0 in 2005. The data has a decreasing trend.
 When looking into fire subcategories, the most incidents belonged to: Outside Fires (46.9%), and Structure Fires (29.1%).