Estimated zip code population in 2022: 1,485 Zip code population in 2010: 2,031 Zip code population in 2000: 1,991
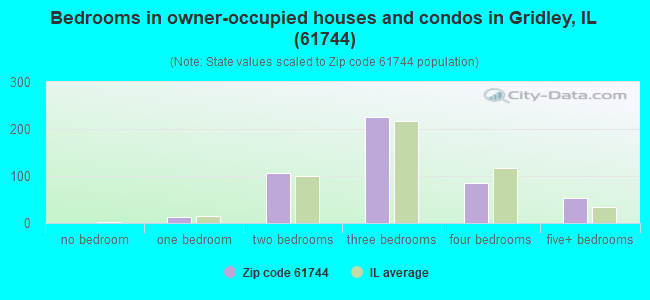
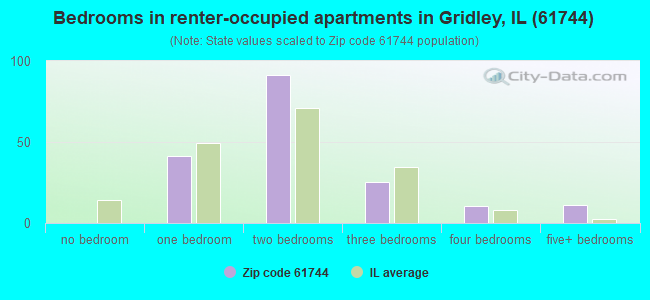
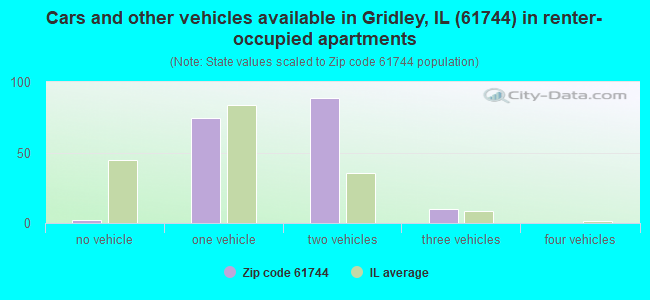
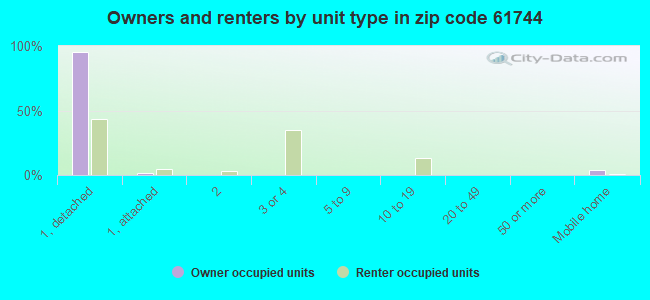
Houses and condos: 686 Renter-occupied apartments: 179
% of renters here:
27%
State:
33%
March 2022 cost of living index in zip code 61744: 84.5 (less than average, U.S. average is 100)
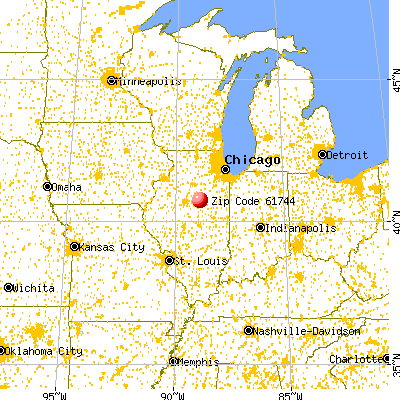
Land area: 78.2 sq. mi. Water area: 0.0 sq. mi.
Population density: 19 people per square mile
(very low).
OSM Map
General Map
Google Map
MSN Map
OSM Map
General Map
Google Map
MSN Map
OSM Map
General Map
Google Map
MSN Map
OSM Map
General Map
Google Map
MSN Map
Please wait while loading the map...
Real estate property taxes paid for housing units in 2022:
This zip code:
2.0% ($2,899)
Illinois:
2.0% ($4,912)
Median real estate property taxes paid for housing units with mortgages in 2022: $2,693 (1.9%) Median real estate property taxes paid for housing units with no mortgage in 2022: $3,158 (2.0%)
Business Search- 14 Million verified businesses
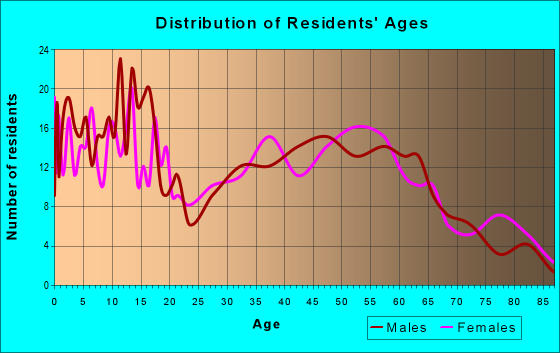
Males: 707
(47.6%)
Females: 777
(52.4%)
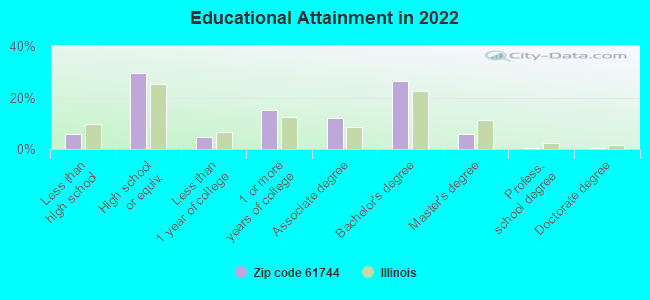
For population 25 years and over in 61744:
High school or higher: 93.4%
Bachelor's degree or higher: 32.7%
Graduate or professional degree: 6.6%
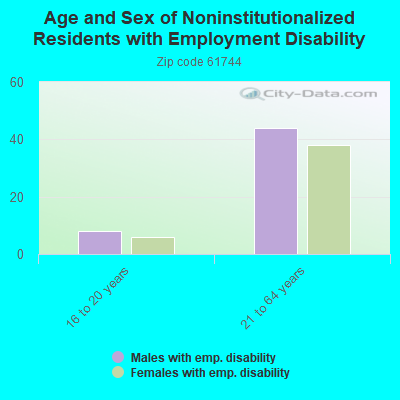
Unemployed: 2.1%
Mean travel time to work (commute): 26.3 minutes
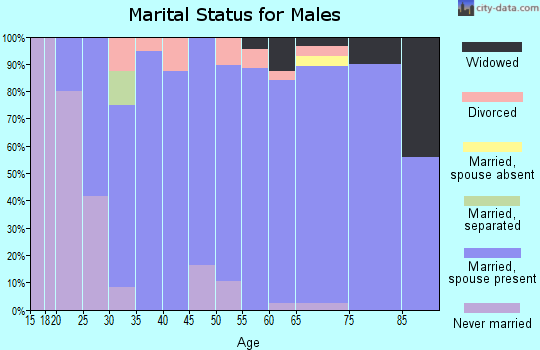
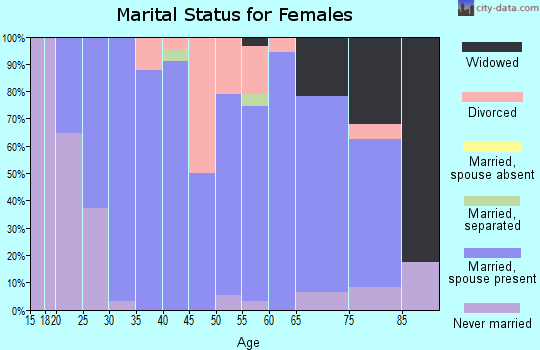
For population 15 years and over in 61744:
Never married: 17.7%
Now married: 66.2%
Separated: 0.2%
Widowed: 7.7%
Divorced: 8.1%
Zip code 61744 compared to state average:
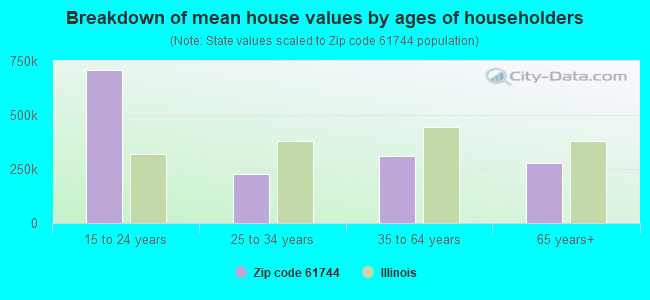
Median house value below state average.
Unemployed percentage below state average.
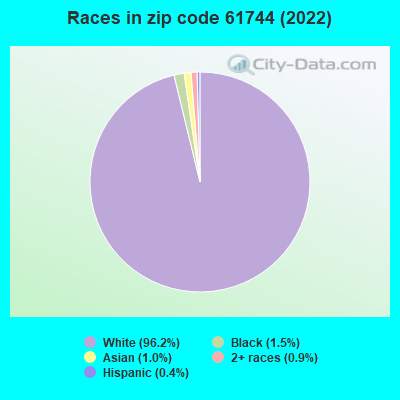
Black race population percentage significantly below state average.
Hispanic race population percentage significantly below state average.
Median age significantly above state average.
Foreign-born population percentage significantly below state average.
Length of stay since moving in significantly above state average.
Averages for the 2020 tax year for zip code 61744, filed in 2021:
Average Adjusted Gross Income (AGI) in 2020: $71,803 (Individual Income Tax Returns)
Here:
$71,803
State:
$82,626
Salary/wage: $52,462 (reported on 86.2% of returns)
Here:
$52,462
State:
$66,640
(% of AGI for various income ranges: 1221.7% for AGIs below $25k, 3350.6% for AGIs $25k-50k, 6067.0% for AGIs $50k-75k, 10767.1% for AGIs $75k-100k, 15391.8% for AGIs $100k-200k)
Taxable interest for individuals: $1,243 (reported on 50.0% of returns)
This zip code:
$1,243
Illinois:
$2,376
(% of AGI for various income ranges: 10.6% for AGIs below $25k, 16.9% for AGIs $25k-50k, 116.0% for AGIs $50k-75k, 127.1% for AGIs $75k-100k, 259.1% for AGIs $100k-200k)
Ordinary dividends: $3,570 (reported on 21.3% of returns)
Here:
$3,570
State:
$9,061
(% of AGI for various income ranges: 11.7% for AGIs below $25k, 17.5% for AGIs $25k-50k, 50.0% for AGIs $50k-75k, 127.1% for AGIs $75k-100k, 290.0% for AGIs $100k-200k)
Net capital gain/loss in AGI: +$9,722 (reported on 19.1% of returns)
Here:
+$9,722
State:
+$31,684
(% of AGI for various income ranges: 71.1% for AGIs below $25k, 23.1% for AGIs $25k-50k, 104.0% for AGIs $50k-75k, 137.1% for AGIs $75k-100k, 1259.1% for AGIs $100k-200k)
Profit/loss from business: +$10,318 (reported on 11.7% of returns)
Here:
+$10,318
State:
+$12,175
(% of AGI for various income ranges: 112.8% for AGIs below $25k, 226.3% for AGIs $25k-50k, 242.9% for AGIs $75k-100k, 363.6% for AGIs $100k-200k)
Taxable individual retirement arrangement distribution: $12,991 (reported on 11.7% of returns)
61744:
$12,991
Illinois:
$21,613
(% of AGI for various income ranges: 159.4% for AGIs below $25k, 336.0% for AGIs $50k-75k, 732.7% for AGIs $100k-200k)
Total itemized deductions: $40,280 (reported on 5.3% of returns)
Here:
$40,280
State:
$34,948
(% of AGI for various income ranges: 404.4% for AGIs $25k-50k, 1242.7% for AGIs $100k-200k)
Charity contributions: $20,075 (reported on 4.3% of returns)
Here:
$20,075
State:
$13,122
(% of AGI for various income ranges: 730.0% for AGIs $100k-200k)
Taxes paid: $8,540 (reported on 5.3% of returns)
61744:
$8,540
State:
$8,563
(% of AGI for various income ranges: 68.3% for AGIs below $25k, 276.4% for AGIs $100k-200k)
Earned income credit: $2,560 (reported on 10.6% of returns)
Here:
$2,560
State:
$2,311
(% of AGI for various income ranges: 74.4% for AGIs below $25k, 76.2% for AGIs $25k-50k)
Percentage of individuals using paid preparers for their 2020 taxes: 96.8%
Here:
97%
State:
93%
(% for various income ranges: 96.2% for AGIs below $25k, 94.7% for AGIs $25k-50k, 100.0% for AGIs $50k-75k, 92.3% for AGIs $75k-100k, 100.0% for AGIs $100k-200k, 100.0% for AGIs over 200k)
Averages for the 2012 tax year for zip code 61744, filed in 2013:
Average Adjusted Gross Income (AGI) in 2012: $65,772 (Individual Income Tax Returns)
Here:
$65,772
State:
$68,058
Salary/wage: $50,711 (reported on 82.5% of returns)
Here:
$50,711
State:
$55,396
(% of AGI for various income ranges: 70.3% for AGIs below $25k, 80.7% for AGIs $25k-50k, 72.8% for AGIs $50k-75k, 71.7% for AGIs $75k-100k, 62.0% for AGIs $100k-200k, 45.5% for AGIs over 200k)
Taxable interest for individuals: $1,159 (reported on 47.4% of returns)
This zip code:
$1,159
Illinois:
$1,969
(% of AGI for various income ranges: 1.5% for AGIs below $25k, 0.5% for AGIs $25k-50k, 0.7% for AGIs $50k-75k, 0.8% for AGIs $75k-100k, 0.7% for AGIs $100k-200k, 1.1% for AGIs over 200k)
Ordinary dividends: $2,776 (reported on 21.6% of returns)
Here:
$2,776
State:
$7,786
(% of AGI for various income ranges: 1.6% for AGIs below $25k, 0.2% for AGIs $25k-50k, 1.0% for AGIs $50k-75k, 0.5% for AGIs $75k-100k, 0.9% for AGIs $100k-200k, 1.3% for AGIs over 200k)
Net capital gain/loss in AGI: +$3,020 (reported on 15.5% of returns)
Here:
+$3,020
State:
+$22,183
(% of AGI for various income ranges: 0.5% for AGIs below $25k, 0.4% for AGIs $50k-75k, 0.2% for AGIs $75k-100k, 2.3% for AGIs $100k-200k)
Profit/loss from business: +$11,021 (reported on 14.4% of returns)
Here:
+$11,021
State:
+$12,903
(% of AGI for various income ranges: 5.6% for AGIs below $25k, 2.7% for AGIs $25k-50k, 3.4% for AGIs $50k-75k, 5.0% for AGIs $100k-200k)
Taxable individual retirement arrangement distribution: $11,717 (reported on 12.4% of returns)
61744:
$11,717
Illinois:
$17,929
(% of AGI for various income ranges: 6.6% for AGIs below $25k, 4.2% for AGIs $50k-75k, 4.8% for AGIs $100k-200k)
Total itemized deductions: $20,003 (17% of AGI, reported on 33.0% of returns)
Here:
$20,003
State:
$26,433
Here:
17.0% of AGI
State:
19.2% of AGI
(% of AGI for various income ranges: 14.2% for AGIs below $25k, 9.1% for AGIs $25k-50k, 9.5% for AGIs $50k-75k, 10.3% for AGIs $75k-100k, 12.4% for AGIs $100k-200k, 7.3% for AGIs over 200k)
Charity contributions: $5,779 (reported on 24.7% of returns)
Here:
$5,779
State:
$4,525
(% of AGI for various income ranges: 2.1% for AGIs $25k-50k, 1.6% for AGIs $50k-75k, 2.0% for AGIs $75k-100k, 3.1% for AGIs $100k-200k, 2.2% for AGIs over 200k)
Taxes paid: $8,319 (reported on 33.0% of returns)
61744:
$8,319
State:
$11,968
(% of AGI for various income ranges: 2.1% for AGIs below $25k, 2.4% for AGIs $25k-50k, 3.1% for AGIs $50k-75k, 4.7% for AGIs $75k-100k, 5.3% for AGIs $100k-200k, 4.5% for AGIs over 200k)
Earned income credit: $2,085 (reported on 13.4% of returns)
Here:
$2,085
State:
$2,349
(% of AGI for various income ranges: 4.9% for AGIs below $25k, 1.3% for AGIs $25k-50k)
Percentage of individuals using paid preparers for their 2012 taxes: 60.8%
Here:
61%
State:
57%
(% for various income ranges: 56.2% for AGIs below $25k, 54.5% for AGIs $25k-50k, 66.7% for AGIs $50k-75k, 58.3% for AGIs $75k-100k, 69.2% for AGIs $100k-200k, 100.0% for AGIs over 200k)
Averages for the 2004 tax year for zip code 61744, filed in 2005:
Average Adjusted Gross Income (AGI) in 2004: $43,914 (Individual Income Tax Returns)
Here:
$43,914
State:
$54,625
Salary/wage: $37,927 (reported on 82.5% of returns)
Here:
$37,927
State:
$46,811
(% of AGI for various income ranges: 91.7% for AGIs below $10k, 65.3% for AGIs $10k-25k, 76.5% for AGIs $25k-50k, 72.1% for AGIs $50k-75k, 74.5% for AGIs $75k-100k, 62.4% for AGIs over 100k)
Taxable interest for individuals: $1,475 (reported on 59.9% of returns)
This zip code:
$1,475
Illinois:
$2,101
(% of AGI for various income ranges: 6.6% for AGIs below $10k, 3.7% for AGIs $10k-25k, 1.6% for AGIs $25k-50k, 1.3% for AGIs $50k-75k, 1.7% for AGIs $75k-100k, 2.6% for AGIs over 100k)
Taxable dividends: $2,071 (reported on 28.0% of returns)
Here:
$2,071
State:
$4,306
(% of AGI for various income ranges: 1.5% for AGIs below $10k, 2.4% for AGIs $10k-25k, 0.9% for AGIs $25k-50k, 0.5% for AGIs $50k-75k, 1.1% for AGIs $75k-100k, 2.5% for AGIs over 100k)
Net capital gain/loss: +$3,564 (reported on 21.4% of returns)
Here:
+$3,564
State:
+$17,321
(% of AGI for various income ranges: -1.9% for AGIs below $10k, 0.6% for AGIs $10k-25k, 0.5% for AGIs $25k-50k, 2.6% for AGIs $50k-75k, 2.9% for AGIs $75k-100k, 1.4% for AGIs over 100k)
Profit/loss from business: +$6,553 (reported on 14.8% of returns)
Here:
+$6,553
State:
+$11,771
(% of AGI for various income ranges: 5.2% for AGIs below $10k, 4.4% for AGIs $10k-25k, 2.8% for AGIs $25k-50k, 2.8% for AGIs $50k-75k, 2.3% for AGIs $75k-100k, 0.0% for AGIs over 100k)
Profit/loss from farming: +$11,864 (reported on 9.2% of returns)
Here:
+$11,864
State:
+$2,327
(% of AGI for various income ranges: 4.6% for AGIs below $10k, 2.1% for AGIs $25k-50k, 5.2% for AGIs $50k-75k, 4.4% for AGIs $75k-100k, -1.3% for AGIs over 100k)
IRA payment deduction: $2,826 (reported on 2.4% of returns)
61744:
$2,826
Illinois:
$3,087
Total itemized deductions: $15,065 (22% of AGI, reported on 32.2% of returns)
Here:
$15,065
State:
$20,239
Here:
21.9% of AGI
State:
19.5% of AGI
(% of AGI for various income ranges: 24.1% for AGIs $10k-25k, 10.9% for AGIs $25k-50k, 10.3% for AGIs $50k-75k, 11.8% for AGIs $75k-100k, 8.3% for AGIs over 100k)
Charity contributions deductions: $3,163 (4% of AGI, reported on 27.1% of returns)
Here:
$3,163
State:
$3,719
Here:
4.4% of AGI
State:
3.4% of AGI
(% of AGI for various income ranges: 2.5% for AGIs $10k-25k, 1.6% for AGIs $25k-50k, 2.3% for AGIs $50k-75k, 1.9% for AGIs $75k-100k, 1.9% for AGIs over 100k)
Total tax: $5,929 (reported on 76.8% of returns)
61744:
$5,929
State:
$9,882
(% of AGI for various income ranges: 3.8% for AGIs below $10k, 4.5% for AGIs $10k-25k, 6.5% for AGIs $25k-50k, 8.9% for AGIs $50k-75k, 10.5% for AGIs $75k-100k, 17.8% for AGIs over 100k)
Earned income credit: $1,634 (reported on 9.8% of returns)
Here:
$1,634
State:
$1,788
Percentage of individuals using paid preparers for their 2004 taxes: 66.8%
Here:
67%
State:
61%
(% for various income ranges: 65.0% for AGIs below $10k, 69.5% for AGIs $10k-25k, 67.6% for AGIs $25k-50k, 64.5% for AGIs $50k-75k, 67.6% for AGIs $75k-100k, 67.2% for AGIs over 100k)
Household received Food Stamps/SNAP in the past 12 months: 82 Household did not receive Food Stamps/SNAP in the past 12 months: 579
Women who had a birth in the past 12 months: 17 (17 now married, 0 unmarried) Women who did not have a birth in the past 12 months: 235 (126 now married, 107 unmarried)
Housing units in zip code 61744 with a mortgage: 241 (5 second mortgage, 5 both second mortgage and home equity loan) Houses without a mortgage: 22
Median monthly owner costs for units with a mortgage: $1,092 Median monthly owner costs for units without a mortgage: $576
Residents with income below the poverty level in 2022:
This zip code:
5.8%
Whole state:
11.9%
Residents with income below 50% of the poverty level in 2022:
This zip code:
4.5%
Whole state:
5.7%
Median number of rooms in houses and condos:
Here:
6.5
State:
6.4
Median number of rooms in apartments:
Here:
4.2
State:
4.1
Notable locations in this zip code not listed on our city pages
Size of family households: 291 2-persons, 62 3-persons, 83 4-persons, 14 5-persons, 11 6-persons
Size of nonfamily households: 178 1-person, 17 2-persons, 4 3-persons
213 married couples with children.
72 single-parent households (32 men, 40 women).
97.9% of residents of 61744 zip code speak English at home.
1.6% of residents speak Spanish at home (87% very well, 13% well).
0.1% of residents speak Asian or Pacific Island language at home (100% well).
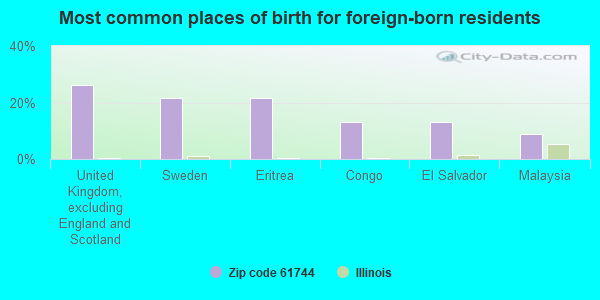
Foreign born population: 23 (1.6%) (74.1% of them are naturalized citizens)
This zip code:
1.6%
Whole state:
14.4%
26%United Kingdom, excluding England and Scotland
22%Sweden
22%Eritrea
13%Congo
13%El Salvador
9%Malaysia
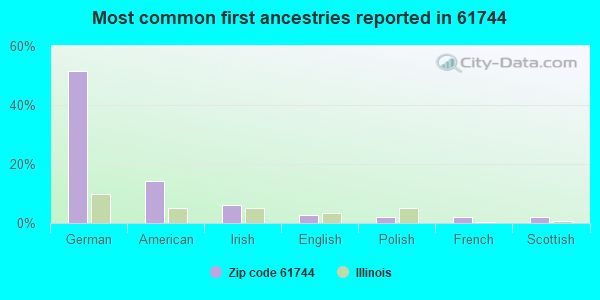
51%German
14%American
6%Irish
3%English
2%Polish
2%French
2%Scottish
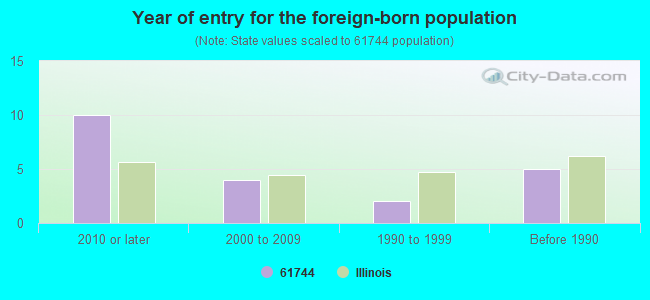
Year of entry for the foreign-born population
102010 or later
42000 to 2009
21990 to 1999
5Before 1990
Major facilities with environmental interests located in this zip code:
JBS UNITED INC. (222 CENTER ST in GRIDLEY, IL)
STATE MASTER (Illinois EPA Project) - AIR PROGRAM AIR MINOR (AIRS/AFS) CRITERIA AND HAZARDOUS AIR POLLUTANT INVENTORY (Inventory of air pollution sources) Business SIC classification: GRAIN AND FIELD BEANS Alternative names: UNITED FEEDS INCORPORATED
HCC, INC. (108 S CENTER ST in GRIDLEY, IL)
AIR MINOR (AIRS/AFS) National Pollutant Discharge Elimination System NON-MAJOR (Tracking pollutant discharge elimination systems) - permit Small Quantity Generators, between 100 kg and 1000 kg of hazardous waste/month (Resource Conservation and Recovery Act (tracking hazardous waste)) Business SIC classification: FARM MACHINERY AND EQUIPMENT Organizations: MICHAEL MANLEY (CONTACT/OPERATOR)
, HCC INC (CONTACT/OWNER)
, TRACOINSA USA (CONTACT/OWNER)
Alternative names: HCC INC.-GRIDLEY
JBS UNITED INC (320 E SECOND ST in GRIDLEY, IL)
STATE MASTER (Illinois EPA Project) - AIR PROGRAM AIR MINOR (AIRS/AFS) CRITERIA AND HAZARDOUS AIR POLLUTANT INVENTORY (Inventory of air pollution sources) Business SIC classification: GRAIN AND FIELD BEANS Alternative names: MCKEY & ROEGGE INC, UNITED FEEDS, INC.
MEYERS CROP CENTER (CITY OF in GRIDLEY, IL)
STATE MASTER (Illinois EPA Project) - AIR PROGRAM AIR MINOR (AIRS/AFS) Business SIC classification: FARM SUPPLIES
NICOR GAS (LAKE BLOOMINGTON ROAD in GRIDLEY, IL)
STATE MASTER (Illinois EPA Project) - AIR PROGRAM AIR MINOR (AIRS/AFS) CRITERIA AND HAZARDOUS AIR POLLUTANT INVENTORY (Inventory of air pollution sources) Business SIC and NAICS classification: NATURAL GAS DISTRIBUTION
GRIDLEY STP (MCLEAN COUNTY ROAD 2080E in GRIDLEY, IL)
STATE MASTER (Illinois EPA Project) - National Pollutant Discharge Elimination System Permit National Pollutant Discharge Elimination System NON-MAJOR (Tracking pollutant discharge elimination systems) - permit Business SIC classification: SEWERAGE SYSTEMS Alternative names: GRIDLEY STP, VILLAGE OF
NICOR GAS-STOR STAT 40 (3 MI S RTE 24 5 MI E RT51 in GRIDLEY, IL)
STATE MASTER (Illinois EPA Project) - SOLID WASTE PROGRAM, HAZARDOUS WASTE PROGRAM Small Quantity Generators, between 100 kg and 1000 kg of hazardous waste/month (Resource Conservation and Recovery Act (tracking hazardous waste)) - notification
PRAIRIE FS FUELS INC (LIVINGSTON & 2ND STREETS in GRIDLEY, IL)
STATE MASTER (Illinois EPA Project) - AIR PROGRAM AIR MINOR (AIRS/AFS) Business SIC classification: PETROLEUM BULK STATIONS AND TERMINALS
GRIDLEY HIGH SCHOOL (BX 520 4TH & MCLEAN in GRIDLEY, IL)
(Geographic Names Information System) (National Center for Education Statistics) - STATE ID-1706401000001 Organizations: GRIDLEY C U SCH DIST 10 (SCHOOL DISTRICT)
RINGGER FOODS INC (202 MARKET ST in GRIDLEY, IL)
STATE MASTER (Illinois EPA Project) - SOLID WASTE PROGRAM, HAZARDOUS WASTE PROGRAM Conditionally Exempt Small Quantity Generators, less than 100 kg/month of hazardous waste (Resource Conservation and Recovery Act (tracking hazardous waste)) - notification Organizations: RINGGER GARY (CONTACT/OWNER)
GRIDLEY ELEM SCHOOL (BX 430 4TH & MCLEAN in GRIDLEY, IL)
(National Center for Education Statistics) - STATE ID-1706401002002 Organizations: GRIDLEY C U SCH DIST 10 (SCHOOL DISTRICT)
GRIDLEY JR HIGH SCHOOL (BX 430 4TH & MCLEAN in GRIDLEY, IL)
(National Center for Education Statistics) - STATE ID-1706401001001 Organizations: GRIDLEY C U SCH DIST 10 (SCHOOL DISTRICT)
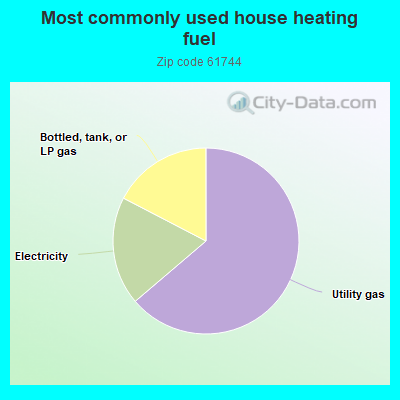
63.9%Utility gas
18.9%Electricity
17.4%Bottled, tank, or LP gas
Population in 1990: 2,142.
Place of birth for U.S.-born residents:
This state: 1,201
Northeast: 25
Midwest: 122
South: 64
West: 42
67% of the 61744 zip code residents lived in the same house 5 years ago. Out of people who lived in different houses, 54% lived in this county. Out of people who lived in different counties, 50% lived in Illinois.
93% of the 61744 zip code residents lived in the same house 1 year ago. Out of people who lived in different houses, 17% moved from this county. Out of people who lived in different houses, 87% moved from different county within same state.
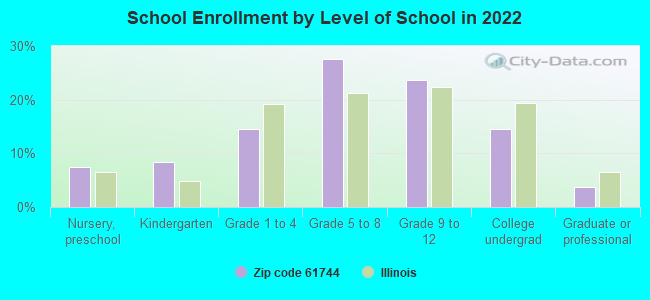
Private vs. public school enrollment:
Students in private schools in grades 1 to 8 (elementary and middle school):
Here:
0.0%
Illinois:
13.3%
Students in private schools in grades 9 to 12 (high school): 12
Here:
16.7%
Illinois:
9.9%
Students in private undergraduate colleges: 3
Here:
7.9%
Illinois:
27.4%
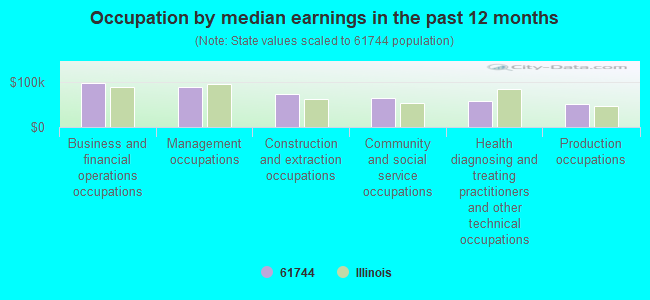
Occupation by median earnings in the past 12 months ($)
97,317Business and financial operations occupations
88,160Management occupations
73,970Construction and extraction occupations
63,325Community and social service occupations
56,880Health diagnosing and treating practitioners and other technical occupations
51,846Production occupations
Companies with federal contracts located in this zip code:
ALLEN INDUSTRIES (310 E 4TH ST in GRIDLEY, IL; small business) : $33,000 in 2 contractsin 2005
$22,000 with Air Force for Aircraft Maintenance and Repair Shop Specialized Equipment. Signed on 2005-08-30. Completion date: 2009-08-24.
$11,000, same as above.Signed on 2005-08-30. Completion date: 2009-08-25.
Top industries in this zip code by the number of employees in 2005:
Health Care and Social Assistance: Offices of Dentists (10-19 employees: 1 establishment, 5-9 employees: 1 establishment, 1-4 employees: 1 establishment)
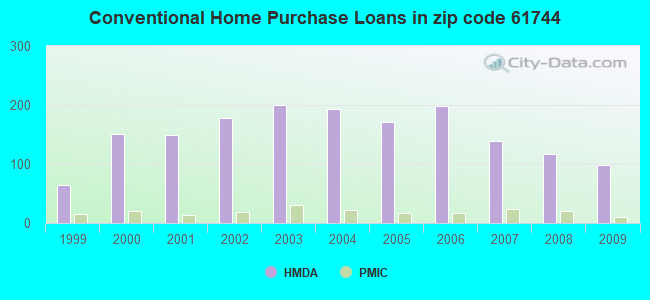
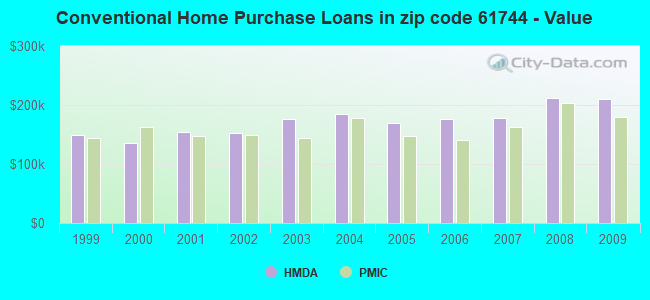
Detailed PMIC statistics for the following Tracts:0051.00
2002 - 2018 National Fire Incident Reporting System (NFIRS) incidents
Based on the data from the years 2002 - 2018 the average number of fires per year is 10. The highest number of fires - 19 took place in 2015, and the least - 1 in 2003. The data has a rising trend.
When looking into fire subcategories, the most incidents belonged to: Structure Fires (50.9%), and Outside Fires (27.3%).
Fire incident types reported to NFIRS in Zip Code 61744


 Nearest zip codes: 61738, 61740, 61753, 61748, 61743, 61776.


 Based on the data from the years 2002 - 2018 the average number of fires per year is 10. The highest number of fires - 19 took place in 2015, and the least - 1 in 2003. The data has a rising trend.
 When looking into fire subcategories, the most incidents belonged to: Structure Fires (50.9%), and Outside Fires (27.3%).