Estimated zip code population in 2022: 4,444 Zip code population in 2010: 4,408 Zip code population in 2000: 4,026
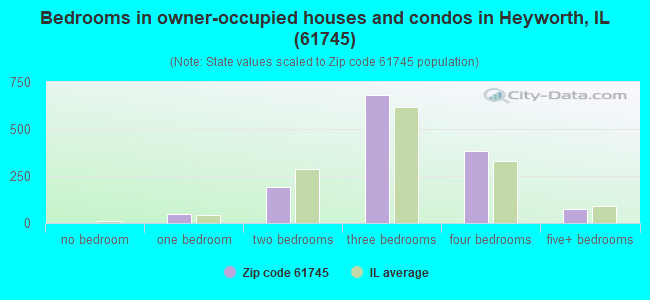
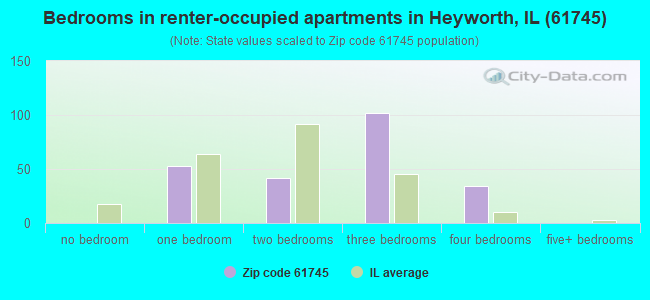
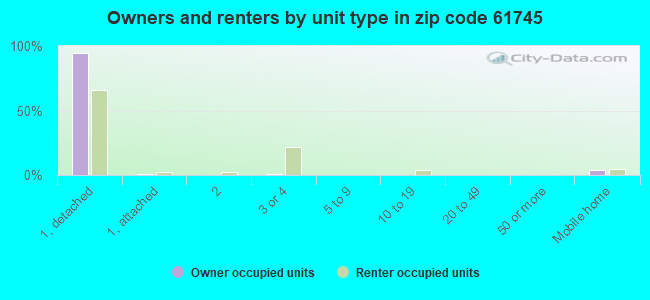
Houses and condos: 1,639 Renter-occupied apartments: 240
% of renters here:
15%
State:
33%
March 2022 cost of living index in zip code 61745: 85.7 (less than average, U.S. average is 100)
Land area: 78.6 sq. mi. Water area: 0.1 sq. mi.
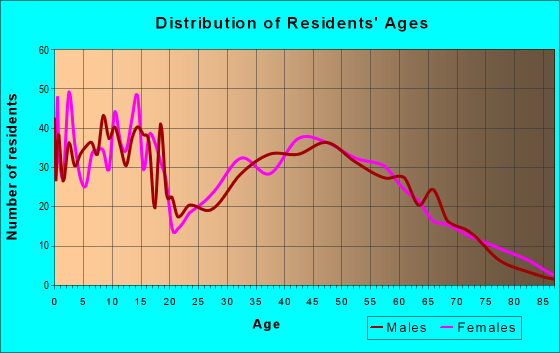
Population density: 57 people per square mile
(very low).
OSM Map
General Map
Google Map
MSN Map
OSM Map
General Map
Google Map
MSN Map
OSM Map
General Map
Google Map
MSN Map
OSM Map
General Map
Google Map
MSN Map
Please wait while loading the map...
Real estate property taxes paid for housing units in 2022:
This zip code:
2.1% ($4,487)
Illinois:
2.0% ($4,912)
Median real estate property taxes paid for housing units with mortgages in 2022: $4,662 (2.1%) Median real estate property taxes paid for housing units with no mortgage in 2022: $4,121 (2.0%)
Averages for the 2020 tax year for zip code 61745, filed in 2021:
Average Adjusted Gross Income (AGI) in 2020: $81,534 (Individual Income Tax Returns)
Here:
$81,534
State:
$82,626
Salary/wage: $70,200 (reported on 84.3% of returns)
Here:
$70,200
State:
$66,640
(% of AGI for various income ranges: 1102.4% for AGIs below $25k, 3413.8% for AGIs $25k-50k, 5952.9% for AGIs $50k-75k, 8456.2% for AGIs $75k-100k, 18111.3% for AGIs $100k-200k, 84220.0% for AGIs over 200k)
Taxable interest for individuals: $789 (reported on 49.5% of returns)
This zip code:
$789
Illinois:
$2,376
(% of AGI for various income ranges: 5.0% for AGIs below $25k, 20.9% for AGIs $25k-50k, 48.6% for AGIs $50k-75k, 108.7% for AGIs $75k-100k, 89.3% for AGIs $100k-200k, 556.7% for AGIs over 200k)
Ordinary dividends: $2,356 (reported on 21.1% of returns)
Here:
$2,356
State:
$9,061
(% of AGI for various income ranges: 10.8% for AGIs below $25k, 30.9% for AGIs $25k-50k, 51.4% for AGIs $50k-75k, 118.8% for AGIs $75k-100k, 125.7% for AGIs $100k-200k, 660.0% for AGIs over 200k)
Net capital gain/loss in AGI: +$5,969 (reported on 19.1% of returns)
Here:
+$5,969
State:
+$31,684
(% of AGI for various income ranges: 7.6% for AGIs below $25k, 54.1% for AGIs $25k-50k, 81.9% for AGIs $50k-75k, 182.5% for AGIs $75k-100k, 237.0% for AGIs $100k-200k, 3170.0% for AGIs over 200k)
Profit/loss from business: +$12,492 (reported on 12.3% of returns)
Here:
+$12,492
State:
+$12,175
(% of AGI for various income ranges: 74.7% for AGIs below $25k, 124.7% for AGIs $25k-50k, 80.5% for AGIs $50k-75k, 137.5% for AGIs $75k-100k, 261.7% for AGIs $100k-200k, 4220.0% for AGIs over 200k)
Taxable individual retirement arrangement distribution: $20,123 (reported on 10.8% of returns)
61745:
$20,123
Illinois:
$21,613
(% of AGI for various income ranges: 63.7% for AGIs below $25k, 86.9% for AGIs $25k-50k, 341.9% for AGIs $50k-75k, 337.5% for AGIs $75k-100k, 551.3% for AGIs $100k-200k, 3316.7% for AGIs over 200k)
Total itemized deductions: $26,615 (reported on 6.4% of returns)
Here:
$26,615
State:
$34,948
(% of AGI for various income ranges: 454.8% for AGIs $50k-75k, 280.0% for AGIs $75k-100k, 346.3% for AGIs $100k-200k, 3393.3% for AGIs over 200k)
Charity contributions: $9,889 (reported on 4.4% of returns)
Here:
$9,889
State:
$13,122
(% of AGI for various income ranges: 70.0% for AGIs $50k-75k, 91.0% for AGIs $100k-200k, 1566.7% for AGIs over 200k)
Taxes paid: $7,685 (reported on 6.4% of returns)
61745:
$7,685
State:
$8,563
(% of AGI for various income ranges: 96.7% for AGIs $50k-75k, 99.4% for AGIs $75k-100k, 116.3% for AGIs $100k-200k, 960.0% for AGIs over 200k)
Earned income credit: $2,267 (reported on 8.8% of returns)
Here:
$2,267
State:
$2,311
(% of AGI for various income ranges: 65.3% for AGIs below $25k, 50.0% for AGIs $25k-50k)
Percentage of individuals using paid preparers for their 2020 taxes: 93.6%
Here:
94%
State:
93%
(% for various income ranges: 92.0% for AGIs below $25k, 92.7% for AGIs $25k-50k, 96.6% for AGIs $50k-75k, 90.9% for AGIs $75k-100k, 95.9% for AGIs $100k-200k, 92.3% for AGIs over 200k)
Averages for the 2012 tax year for zip code 61745, filed in 2013:
Average Adjusted Gross Income (AGI) in 2012: $64,600 (Individual Income Tax Returns)
Here:
$64,600
State:
$68,058
Salary/wage: $55,861 (reported on 88.7% of returns)
Here:
$55,861
State:
$55,396
(% of AGI for various income ranges: 77.9% for AGIs below $25k, 79.5% for AGIs $25k-50k, 74.0% for AGIs $50k-75k, 81.1% for AGIs $75k-100k, 83.6% for AGIs $100k-200k, 46.7% for AGIs over 200k)
Taxable interest for individuals: $587 (reported on 45.6% of returns)
This zip code:
$587
Illinois:
$1,969
(% of AGI for various income ranges: 0.9% for AGIs below $25k, 0.5% for AGIs $25k-50k, 0.5% for AGIs $50k-75k, 0.3% for AGIs $75k-100k, 0.3% for AGIs $100k-200k, 0.7% for AGIs over 200k)
Ordinary dividends: $1,282 (reported on 21.6% of returns)
Here:
$1,282
State:
$7,786
(% of AGI for various income ranges: 0.5% for AGIs below $25k, 0.4% for AGIs $25k-50k, 0.5% for AGIs $50k-75k, 0.5% for AGIs $75k-100k, 0.4% for AGIs $100k-200k, 0.3% for AGIs over 200k)
Net capital gain/loss in AGI: +$1,631 (reported on 12.7% of returns)
Here:
+$1,631
State:
+$22,183
(% of AGI for various income ranges: 0.3% for AGIs $100k-200k, 2.0% for AGIs over 200k)
Profit/loss from business: +$8,921 (reported on 13.7% of returns)
Here:
+$8,921
State:
+$12,903
(% of AGI for various income ranges: 4.5% for AGIs below $25k, 1.8% for AGIs $25k-50k, 1.5% for AGIs $50k-75k, 2.0% for AGIs $75k-100k, 2.2% for AGIs $100k-200k)
Taxable individual retirement arrangement distribution: $10,156 (reported on 8.8% of returns)
61745:
$10,156
Illinois:
$17,929
(% of AGI for various income ranges: 2.3% for AGIs below $25k, 2.0% for AGIs $25k-50k, 1.8% for AGIs $50k-75k, 1.4% for AGIs $75k-100k, 1.3% for AGIs $100k-200k)
Total itemized deductions: $20,122 (19% of AGI, reported on 42.2% of returns)
Here:
$20,122
State:
$26,433
Here:
19.1% of AGI
State:
19.2% of AGI
(% of AGI for various income ranges: 5.0% for AGIs below $25k, 13.4% for AGIs $25k-50k, 13.8% for AGIs $50k-75k, 13.9% for AGIs $75k-100k, 14.2% for AGIs $100k-200k, 11.1% for AGIs over 200k)
Charity contributions: $3,042 (reported on 32.4% of returns)
Here:
$3,042
State:
$4,525
(% of AGI for various income ranges: 1.2% for AGIs $25k-50k, 1.3% for AGIs $50k-75k, 1.4% for AGIs $75k-100k, 1.8% for AGIs $100k-200k, 2.3% for AGIs over 200k)
Taxes paid: $9,016 (reported on 42.2% of returns)
61745:
$9,016
State:
$11,968
(% of AGI for various income ranges: 1.2% for AGIs below $25k, 3.0% for AGIs $25k-50k, 4.8% for AGIs $50k-75k, 6.4% for AGIs $75k-100k, 7.4% for AGIs $100k-200k, 6.2% for AGIs over 200k)
Earned income credit: $2,129 (reported on 11.8% of returns)
Here:
$2,129
State:
$2,349
(% of AGI for various income ranges: 5.4% for AGIs below $25k, 0.8% for AGIs $25k-50k)
Percentage of individuals using paid preparers for their 2012 taxes: 49.0%
Here:
49%
State:
57%
(% for various income ranges: 42.2% for AGIs below $25k, 47.2% for AGIs $25k-50k, 54.8% for AGIs $50k-75k, 51.7% for AGIs $75k-100k, 51.3% for AGIs $100k-200k, 80.0% for AGIs over 200k)
Averages for the 2004 tax year for zip code 61745, filed in 2005:
Average Adjusted Gross Income (AGI) in 2004: $50,781 (Individual Income Tax Returns)
Here:
$50,781
State:
$54,625
Salary/wage: $47,307 (reported on 87.1% of returns)
Here:
$47,307
State:
$46,811
(% of AGI for various income ranges: 91.0% for AGIs below $10k, 74.8% for AGIs $10k-25k, 81.0% for AGIs $25k-50k, 82.3% for AGIs $50k-75k, 86.3% for AGIs $75k-100k, 76.3% for AGIs over 100k)
Taxable interest for individuals: $1,054 (reported on 56.7% of returns)
This zip code:
$1,054
Illinois:
$2,101
(% of AGI for various income ranges: 4.2% for AGIs below $10k, 2.2% for AGIs $10k-25k, 1.2% for AGIs $25k-50k, 1.5% for AGIs $50k-75k, 1.0% for AGIs $75k-100k, 0.7% for AGIs over 100k)
Taxable dividends: $1,071 (reported on 24.3% of returns)
Here:
$1,071
State:
$4,306
(% of AGI for various income ranges: 1.0% for AGIs below $10k, 0.6% for AGIs $10k-25k, 0.4% for AGIs $25k-50k, 0.5% for AGIs $50k-75k, 0.5% for AGIs $75k-100k, 0.6% for AGIs over 100k)
Net capital gain/loss: +$4,395 (reported on 15.5% of returns)
Here:
+$4,395
State:
+$17,321
(% of AGI for various income ranges: 0.1% for AGIs below $10k, -0.2% for AGIs $10k-25k, 0.1% for AGIs $25k-50k, 0.2% for AGIs $50k-75k, 0.3% for AGIs $75k-100k, 4.3% for AGIs over 100k)
Profit/loss from business: +$8,270 (reported on 14.9% of returns)
Here:
+$8,270
State:
+$11,771
(% of AGI for various income ranges: 0.7% for AGIs below $10k, 1.9% for AGIs $10k-25k, 1.9% for AGIs $25k-50k, 1.5% for AGIs $50k-75k, 1.6% for AGIs $75k-100k, 4.5% for AGIs over 100k)
Profit/loss from farming: +$5,605 (reported on 4.2% of returns)
Here:
+$5,605
State:
+$2,327
(% of AGI for various income ranges: 2.0% for AGIs $10k-25k, 1.4% for AGIs $25k-50k, -0.2% for AGIs $50k-75k, 1.1% for AGIs $75k-100k, -0.4% for AGIs over 100k)
IRA payment deduction: $3,213 (reported on 2.5% of returns)
61745:
$3,213
Illinois:
$3,087
Self-employed pension: $7,000 (reported on 0.6% of returns)
Here:
$7,000
Illinois:
$16,965
Total itemized deductions: $16,446 (20% of AGI, reported on 40.0% of returns)
Here:
$16,446
State:
$20,239
Here:
20.4% of AGI
State:
19.5% of AGI
(% of AGI for various income ranges: 7.3% for AGIs below $10k, 7.6% for AGIs $10k-25k, 12.3% for AGIs $25k-50k, 12.8% for AGIs $50k-75k, 15.2% for AGIs $75k-100k, 12.7% for AGIs over 100k)
Charity contributions deductions: $2,512 (3% of AGI, reported on 33.7% of returns)
Here:
$2,512
State:
$3,719
Here:
3.0% of AGI
State:
3.4% of AGI
(% of AGI for various income ranges: 1.0% for AGIs $10k-25k, 1.3% for AGIs $25k-50k, 1.5% for AGIs $50k-75k, 2.0% for AGIs $75k-100k, 1.9% for AGIs over 100k)
Total tax: $6,480 (reported on 81.3% of returns)
61745:
$6,480
State:
$9,882
(% of AGI for various income ranges: 3.0% for AGIs below $10k, 4.8% for AGIs $10k-25k, 7.0% for AGIs $25k-50k, 8.2% for AGIs $50k-75k, 9.7% for AGIs $75k-100k, 16.1% for AGIs over 100k)
Earned income credit: $1,590 (reported on 9.3% of returns)
Here:
$1,590
State:
$1,788
Percentage of individuals using paid preparers for their 2004 taxes: 52.3%
Here:
52%
State:
61%
(% for various income ranges: 40.1% for AGIs below $10k, 51.2% for AGIs $10k-25k, 56.1% for AGIs $25k-50k, 57.5% for AGIs $50k-75k, 53.2% for AGIs $75k-100k, 56.4% for AGIs over 100k)
Likely homosexual households (counted as self-reported same-sex unmarried-partner households)
Lesbian couples: 0.0% of all households
Gay men: 0.2% of all households
Household received Food Stamps/SNAP in the past 12 months: 124 Household did not receive Food Stamps/SNAP in the past 12 months: 1,477
Women who had a birth in the past 12 months: 52 (25 now married, 26 unmarried) Women who did not have a birth in the past 12 months: 911 (537 now married, 368 unmarried)
Housing units in zip code 61745 with a mortgage: 800 (55 second mortgage, 48 both second mortgage and home equity loan) Houses without a mortgage: 8
Median monthly owner costs for units with a mortgage: $1,645 Median monthly owner costs for units without a mortgage: $735
Residents with income below the poverty level in 2022:
This zip code:
7.9%
Whole state:
11.9%
Residents with income below 50% of the poverty level in 2022:
This zip code:
0.8%
Whole state:
5.7%
Median number of rooms in houses and condos:
Here:
7.1
State:
6.4
Median number of rooms in apartments:
Here:
5.5
State:
4.1
Notable locations in this zip code not listed on our city pages
Notable locations in zip code 61745: Funks Grove Townhall (A), Randolph Township Fire Department (B), Heyworth Ambulance Service (C). Display/hide their locations on the map
Cemeteries: Bishop Cemetery (1), Diamond Grove Cemetery (2), Old Rutledge Cemetery (3), Passwater Cemetery (4), Heyworth Cemetery (5), Shiloh Cemetery (6), Long Point Cemetery (7). Display/hide their locations on the map
Size of family households: 612 2-persons, 236 3-persons, 211 4-persons, 126 5-persons, 83 6-persons, 3 7-or-more-persons
Size of nonfamily households: 283 1-person, 43 2-persons
998 married couples with children.
189 single-parent households (23 men, 166 women).
97.5% of residents of 61745 zip code speak English at home.
1.7% of residents speak Spanish at home (69% very well, 31% well).
0.1% of residents speak other Indo-European language at home (100% well).
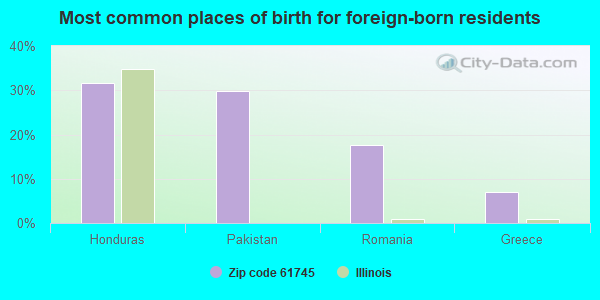
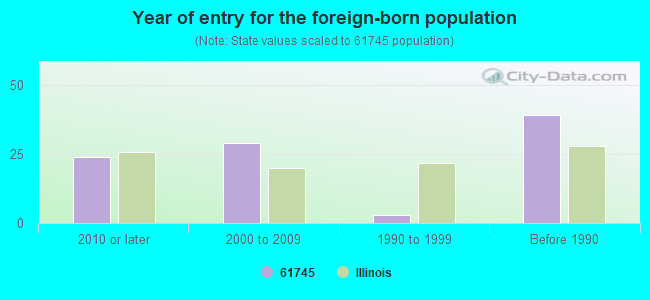
Foreign born population: 57 (1.3%) (94.8% of them are naturalized citizens)
This zip code:
1.3%
Whole state:
14.4%
32%Honduras
30%Pakistan
18%Romania
7%Greece
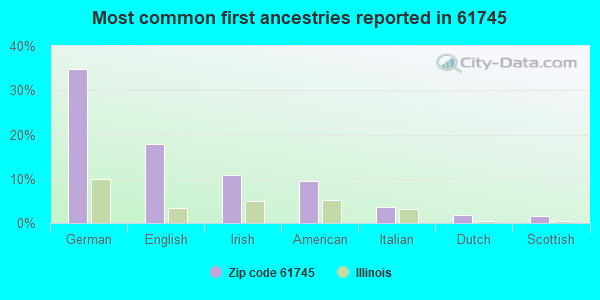
35%German
18%English
11%Irish
9%American
4%Italian
2%Dutch
2%Scottish
Year of entry for the foreign-born population
242010 or later
292000 to 2009
31990 to 1999
39Before 1990
Major facilities with environmental interests located in this zip code:
AMERICAN STONE MIX INC (RT 51 in HEYWORTH, IL)
STATE MASTER (Illinois EPA Project) - AIR PROGRAM AIR MINOR (AIRS/AFS) CRITERIA AND HAZARDOUS AIR POLLUTANT INVENTORY (Inventory of air pollution sources) National Pollutant Discharge Elimination System NON-MAJOR (Tracking pollutant discharge elimination systems) - permit Business SIC classification: CONCRETE PRODUCTS, EXCEPT BLOCK AND BRICK Organizations: AMERICAN STONE MIX INC. (CONTACT/OWNER)
HEYWORTH STP (VILLAGE HALL in HEYWORTH, IL)
STATE MASTER (Illinois EPA Project) - National Pollutant Discharge Elimination System Permit National Pollutant Discharge Elimination System NON-MAJOR (Tracking pollutant discharge elimination systems) - permit National Pollutant Discharge Elimination System NON-MAJOR (Tracking pollutant discharge elimination systems) - permit Business SIC classification: SEWERAGE SYSTEMS Alternative names: HEYWORTH STP, VILLAGE OF
HEYWORTH CU SCHOOL DISTRICT #4 (308 WEST CLEVELAND STREET in HEYWORTH, IL)
(Integrated Compliance Information System) - ICIS-05-1987-0071, FORMAL ENFORCEMENT ACTION COMPLIANCE ACTIVITY (Tracking inspections of insecticide, fungicide, and rodenticide, and toxic substances) National Pollutant Discharge Elimination System NON-MAJOR (Tracking pollutant discharge elimination systems) - permit Business SIC classification: ELEMENTARY AND SECONDARY SCHOOLS; ADMINISTRATION OF EDUCATIONAL PROGRAMS Organizations: RYDER STUDENT TRANSPORTATION (CONTACT/OWNER)
Alternative names: HEYWORTH COMMUNITY UNIT SCHOOL, DIST#4, HEYWORTH CU SCHOOL DIST #4, RYDER STUDENT TRANSPORTATION
HEYWORTH, VILLAGE OF (108 S BUCHANAN in HEYWORTH, IL)
STATE MASTER (Illinois EPA Project) - HAZARDOUS WASTE PROGRAM Large Quantity Generators, more that 1000 kg of hazardous waste/month (Resource Conservation and Recovery Act (tracking hazardous waste)) Organizations: TONY FOSTER (CONTACT/OPERATOR)
, VILLAGE OF HEYWORTH (CONTACT/OWNER)
RANDOLPH CO-OPERATIVE GRAIN CO (COUNTY RD 625N in HEYWORTH, IL)
STATE MASTER (Illinois EPA Project) - AIR PROGRAM AIR MINOR (AIRS/AFS) CRITERIA AND HAZARDOUS AIR POLLUTANT INVENTORY (Inventory of air pollution sources) Business SIC classification: GRAIN AND FIELD BEANS
RONALD L CLINE (604 KENNETH ST. - ROUTE 51 N. in HEYWORTH, IL)
STATE MASTER (Illinois EPA Project) - National Pollutant Discharge Elimination System Permit National Pollutant Discharge Elimination System NON-MAJOR (Tracking pollutant discharge elimination systems) - permit Organizations: CLINE TRUCKING?RONALD L. (CONTACT/OWNER)
Alternative names: CLINE, RONALD L. TRUCKING, CLINE TRUCKING?RONALD L.
ROWE CONSTRUCTION CO-PIT 90 (COUNTY HIGHWAY 1200 EAST in HEYWORTH, IL)
STATE MASTER (Illinois EPA Project) - AIR PROGRAM AIR MINOR (AIRS/AFS) CRITERIA AND HAZARDOUS AIR POLLUTANT INVENTORY (Inventory of air pollution sources) Business SIC classification: CONSTRUCTION SAND AND GRAVEL Alternative names: ROWE CONSTRUCTION CO. PIT #90
RANDOLPH AG SERVICE (R R #1 in RANDOLPH, IL)
STATE MASTER (Illinois EPA Project) - AIR PROGRAM AIR MINOR (AIRS/AFS) Business SIC classification: GRAIN AND FIELD BEANS
ROWE-CARMICHAEL QUARRY (N1/2 SECTION 12 T2 1N R1E in HEYWORTH, IL)
STATE MASTER (Illinois EPA Project) - National Pollutant Discharge Elimination System Permit National Pollutant Discharge Elimination System NON-MAJOR (Tracking pollutant discharge elimination systems) - permit Business SIC classification: CONSTRUCTION SAND AND GRAVEL
HEYWORTH HIGH SCHOOL (PO BOX 560 in HEYWORTH, IL)
(Geographic Names Information System) (National Center for Education Statistics) - STATE ID-1706400400001 Organizations: HEYWORTH C U SCH DIST 4 (SCHOOL DISTRICT)
ROWE CONSTRUCTION CO (RURAL ROUTE 1 in HEYWORTH, IL)
STATE MASTER (Illinois EPA Project) - AIR PROGRAM AIR SYNTHETIC MINOR (AIRS/AFS) CRITERIA AND HAZARDOUS AIR POLLUTANT INVENTORY (Inventory of air pollution sources) Business SIC classification: CONSTRUCTION SAND AND GRAVEL; ASPHALT PAVING MIXTURES AND BLOCKS Business NAICS classification: ASPHALT PAVING MIXTURE AND BLOCK MANUFACTURING.
HEYWORTH ELEM SCHOOL (PO BOX 530 in HEYWORTH, IL)
(National Center for Education Statistics) - STATE ID-1706400402002 Organizations: HEYWORTH C U SCH DIST 4 (SCHOOL DISTRICT)
BLOOMINGTON NORMAL WRD (16041 E 700 N EAST RD in HEYWORTH, IL)
STATE MASTER (Illinois EPA Project) - AIR PROGRAM, National Pollutant Discharge Elimination System Permit AIR SYNTHETIC MINOR (AIRS/AFS) Business SIC classification: SEWERAGE SYSTEMS
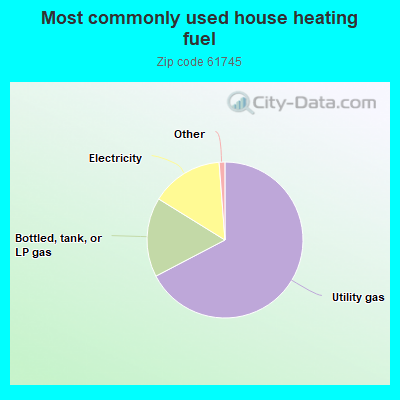
67.4%Utility gas
16.5%Bottled, tank, or LP gas
15.0%Electricity
0.8%No fuel used
0.5%Other fuel
Population in 1990: 2,934. Population change in the 1990s: +1,092 (+37.2%).
Place of birth for U.S.-born residents:
This state: 3,738
Northeast: 7
Midwest: 271
South: 209
West: 100
55% of the 61745 zip code residents lived in the same house 5 years ago. Out of people who lived in different houses, 67% lived in this county. Out of people who lived in different counties, 50% lived in Illinois.
94% of the 61745 zip code residents lived in the same house 1 year ago. Out of people who lived in different houses, 90% moved from this county. Out of people who lived in different houses, 5% moved from different county within same state.
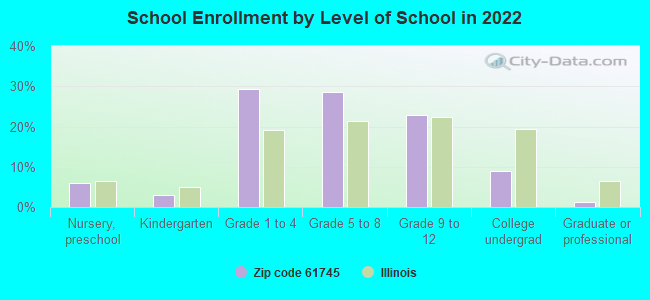
Private vs. public school enrollment:
Students in private schools in grades 1 to 8 (elementary and middle school): 42
Here:
6.2%
Illinois:
13.3%
Students in private schools in grades 9 to 12 (high school): 47
Here:
17.2%
Illinois:
9.9%
Students in private undergraduate colleges: 11
Here:
10.5%
Illinois:
27.4%
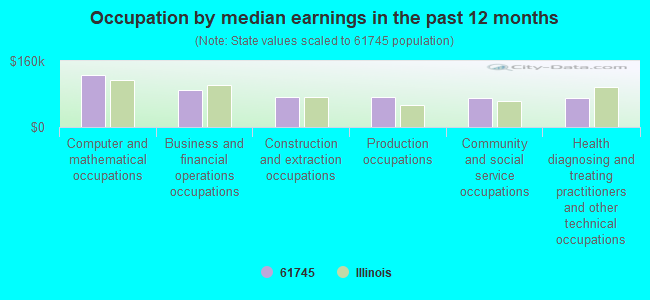
Occupation by median earnings in the past 12 months ($)
125,269Computer and mathematical occupations
90,909Business and financial operations occupations
73,294Construction and extraction occupations
73,260Production occupations
70,406Community and social service occupations
69,216Health diagnosing and treating practitioners and other technical occupations
Top industries in this zip code by the number of employees in 2005:
Construction: Commercial and Institutional Building Construction (20-49 employees: 1 establishment, 1-4 employees: 1 establishment)
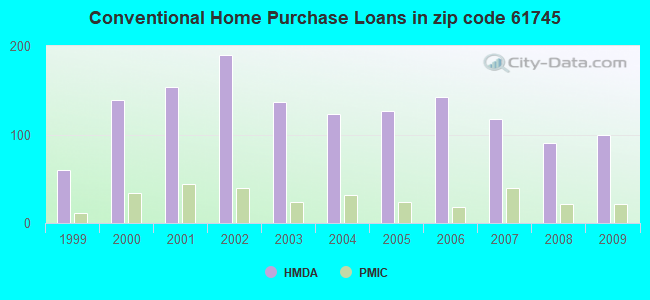
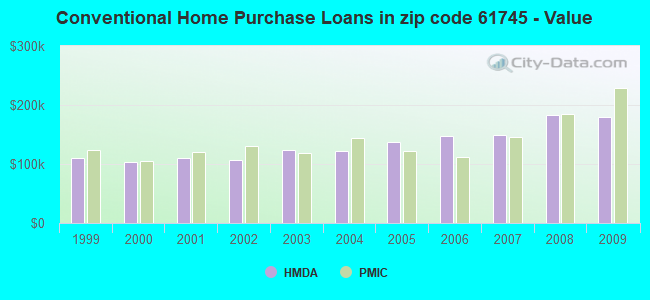
Detailed PMIC statistics for the following Tracts:0054.00
2002 - 2018 National Fire Incident Reporting System (NFIRS) incidents
Based on the data from the years 2002 - 2018 the average number of fires per year is 24. The highest number of fires - 39 took place in 2003, and the least - 10 in 2011. The data has a declining trend.
When looking into fire subcategories, the most incidents belonged to: Structure Fires (47.9%), and Outside Fires (37.5%).
Fire incident types reported to NFIRS in Zip Code 61745


 Nearest zip codes: 61777, 61772, 61705, 61704, 61736, 61778.


 Based on the data from the years 2002 - 2018 the average number of fires per year is 24. The highest number of fires - 39 took place in 2003, and the least - 10 in 2011. The data has a declining trend.
 When looking into fire subcategories, the most incidents belonged to: Structure Fires (47.9%), and Outside Fires (37.5%).