Estimated zip code population in 2022: 14,091 Zip code population in 2010: 13,206 Zip code population in 2000: 10,454
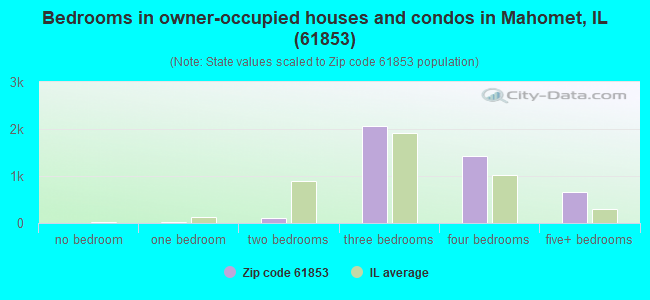
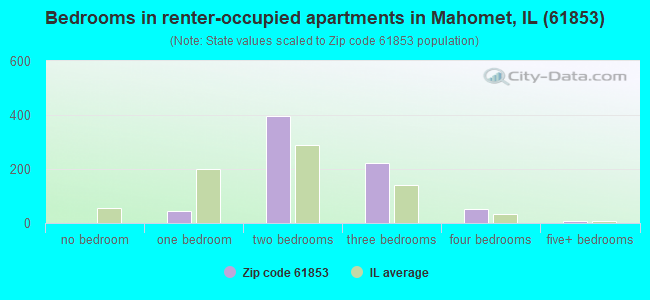
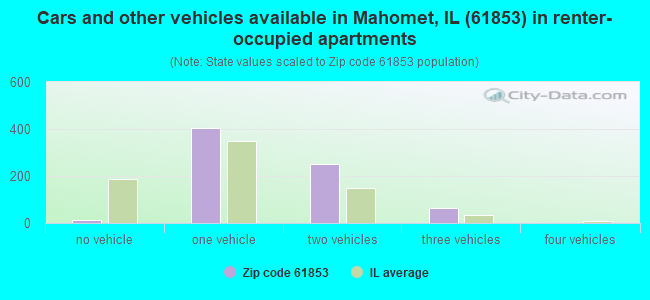
Houses and condos: 5,295 Renter-occupied apartments: 740
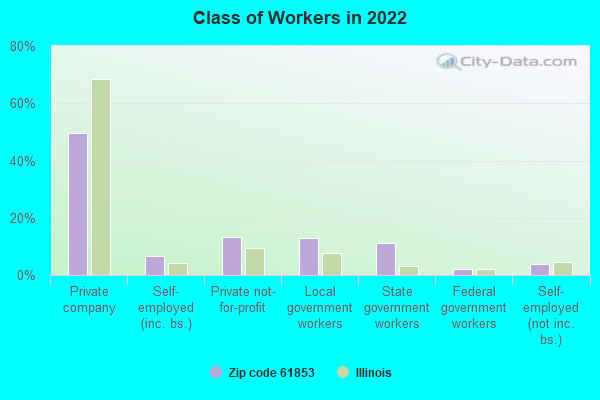
% of renters here:
15%
State:
33%
March 2022 cost of living index in zip code 61853: 86.1 (less than average, U.S. average is 100)
Land area: 48.4 sq. mi. Water area: 0.4 sq. mi.
Population density: 291 people per square mile
(very low).
OSM Map
General Map
Google Map
MSN Map
OSM Map
General Map
Google Map
MSN Map
OSM Map
General Map
Google Map
MSN Map
OSM Map
General Map
Google Map
MSN Map
Please wait while loading the map...
Real estate property taxes paid for housing units in 2022:
This zip code:
1.9% ($5,120)
Illinois:
2.0% ($4,912)
Median real estate property taxes paid for housing units with mortgages in 2022: $5,383 (1.9%) Median real estate property taxes paid for housing units with no mortgage in 2022: $4,580 (1.7%)
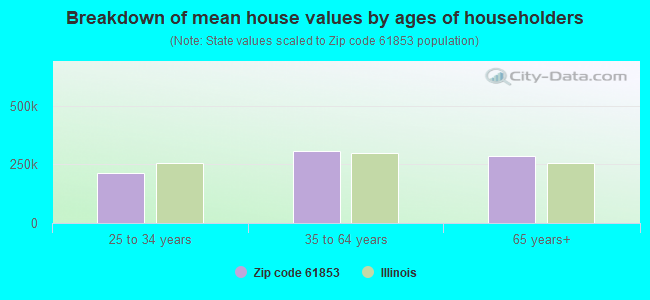
Estimated median house/condo value in 2022: $271,278
61853:
$271,278
Illinois:
$251,600
According to our research of Illinois and other state lists, there were 4 registered sex offenders living in 61853 zip code as of April 23, 2024. The ratio of all residents to sex offenders in zip code 61853 is 3,504 to 1. The ratio of registered sex offenders to all residents in this zip code is much lower than the state average.
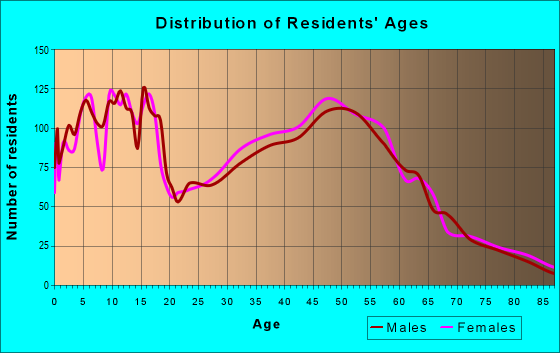
Median resident age:
This zip code:
38.9 years
Illinois median age:
39.1 years
Average household size:
This zip code:
2.8 people
Illinois:
2.4 people
Averages for the 2020 tax year for zip code 61853, filed in 2021:
Average Adjusted Gross Income (AGI) in 2020: $98,180 (Individual Income Tax Returns)
Here:
$98,180
State:
$82,626
Salary/wage: $83,035 (reported on 83.6% of returns)
Here:
$83,035
State:
$66,640
(% of AGI for various income ranges: 1160.2% for AGIs below $25k, 3432.3% for AGIs $25k-50k, 5976.4% for AGIs $50k-75k, 8662.0% for AGIs $75k-100k, 18506.8% for AGIs $100k-200k, 70392.7% for AGIs over 200k)
Taxable interest for individuals: $1,410 (reported on 38.5% of returns)
This zip code:
$1,410
Illinois:
$2,376
(% of AGI for various income ranges: 15.7% for AGIs below $25k, 24.1% for AGIs $25k-50k, 50.2% for AGIs $50k-75k, 67.3% for AGIs $75k-100k, 140.0% for AGIs $100k-200k, 538.2% for AGIs over 200k)
Ordinary dividends: $5,284 (reported on 28.9% of returns)
Here:
$5,284
State:
$9,061
(% of AGI for various income ranges: 26.0% for AGIs below $25k, 55.4% for AGIs $25k-50k, 101.4% for AGIs $50k-75k, 153.8% for AGIs $75k-100k, 229.7% for AGIs $100k-200k, 2601.8% for AGIs over 200k)
Net capital gain/loss in AGI: +$13,636 (reported on 24.6% of returns)
Here:
+$13,636
State:
+$31,684
(% of AGI for various income ranges: 23.0% for AGIs below $25k, 51.8% for AGIs $25k-50k, 101.2% for AGIs $50k-75k, 100.0% for AGIs $75k-100k, 526.7% for AGIs $100k-200k, 7001.4% for AGIs over 200k)
Profit/loss from business: +$17,922 (reported on 15.9% of returns)
Here:
+$17,922
State:
+$12,175
(% of AGI for various income ranges: 71.7% for AGIs below $25k, 135.1% for AGIs $25k-50k, 255.3% for AGIs $50k-75k, 348.2% for AGIs $75k-100k, 462.3% for AGIs $100k-200k, 4143.6% for AGIs over 200k)
Taxable individual retirement arrangement distribution: $18,909 (reported on 11.6% of returns)
61853:
$18,909
Illinois:
$21,613
(% of AGI for various income ranges: 66.4% for AGIs below $25k, 148.8% for AGIs $25k-50k, 274.5% for AGIs $50k-75k, 386.8% for AGIs $75k-100k, 547.0% for AGIs $100k-200k, 1571.8% for AGIs over 200k)
Self-employed (Keogh) retirement plans: $17,343 (reported on 1.0% of returns)
61853:
$17,343
Illinois:
$30,962
(% of AGI for various income ranges: 38.8% for AGIs $100k-200k, 377.3% for AGIs over 200k)
Total itemized deductions: $35,300 (reported on 9.2% of returns)
Here:
$35,300
State:
$34,948
(% of AGI for various income ranges: 46.5% for AGIs below $25k, 114.3% for AGIs $25k-50k, 231.4% for AGIs $50k-75k, 358.8% for AGIs $75k-100k, 653.4% for AGIs $100k-200k, 4768.6% for AGIs over 200k)
Charity contributions: $15,576 (reported on 7.6% of returns)
Here:
$15,576
State:
$13,122
(% of AGI for various income ranges: 14.2% for AGIs $25k-50k, 40.9% for AGIs $50k-75k, 75.5% for AGIs $75k-100k, 194.5% for AGIs $100k-200k, 2376.8% for AGIs over 200k)
Taxes paid: $8,668 (reported on 9.2% of returns)
61853:
$8,668
State:
$8,563
(% of AGI for various income ranges: 30.9% for AGIs $25k-50k, 58.6% for AGIs $50k-75k, 116.6% for AGIs $75k-100k, 186.7% for AGIs $100k-200k, 1023.6% for AGIs over 200k)
Earned income credit: $1,977 (reported on 8.5% of returns)
Here:
$1,977
State:
$2,311
(% of AGI for various income ranges: 53.3% for AGIs below $25k, 56.5% for AGIs $25k-50k)
Percentage of individuals using paid preparers for their 2020 taxes: 93.6%
Here:
94%
State:
93%
(% for various income ranges: 92.1% for AGIs below $25k, 93.8% for AGIs $25k-50k, 94.9% for AGIs $50k-75k, 94.9% for AGIs $75k-100k, 93.6% for AGIs $100k-200k, 93.8% for AGIs over 200k)
Averages for the 2012 tax year for zip code 61853, filed in 2013:
Average Adjusted Gross Income (AGI) in 2012: $77,229 (Individual Income Tax Returns)
Here:
$77,229
State:
$68,058
Salary/wage: $62,276 (reported on 86.8% of returns)
Here:
$62,276
State:
$55,396
(% of AGI for various income ranges: 79.2% for AGIs below $25k, 79.1% for AGIs $25k-50k, 73.0% for AGIs $50k-75k, 76.6% for AGIs $75k-100k, 78.6% for AGIs $100k-200k, 51.7% for AGIs over 200k)
Taxable interest for individuals: $1,505 (reported on 42.3% of returns)
This zip code:
$1,505
Illinois:
$1,969
(% of AGI for various income ranges: 1.0% for AGIs below $25k, 0.6% for AGIs $25k-50k, 0.6% for AGIs $50k-75k, 0.4% for AGIs $75k-100k, 0.6% for AGIs $100k-200k, 1.4% for AGIs over 200k)
Ordinary dividends: $4,783 (reported on 27.6% of returns)
Here:
$4,783
State:
$7,786
(% of AGI for various income ranges: 1.2% for AGIs below $25k, 1.0% for AGIs $25k-50k, 1.3% for AGIs $50k-75k, 1.3% for AGIs $75k-100k, 1.1% for AGIs $100k-200k, 3.1% for AGIs over 200k)
Net capital gain/loss in AGI: +$13,800 (reported on 20.3% of returns)
Here:
+$13,800
State:
+$22,183
(% of AGI for various income ranges: 0.5% for AGIs $25k-50k, 1.1% for AGIs $50k-75k, 0.5% for AGIs $75k-100k, 1.0% for AGIs $100k-200k, 10.5% for AGIs over 200k)
Profit/loss from business: +$19,835 (reported on 15.8% of returns)
Here:
+$19,835
State:
+$12,903
(% of AGI for various income ranges: 5.0% for AGIs below $25k, 3.6% for AGIs $25k-50k, 2.9% for AGIs $50k-75k, 2.7% for AGIs $75k-100k, 2.9% for AGIs $100k-200k, 6.5% for AGIs over 200k)
Taxable individual retirement arrangement distribution: $14,586 (reported on 11.3% of returns)
61853:
$14,586
Illinois:
$17,929
(% of AGI for various income ranges: 2.5% for AGIs below $25k, 2.5% for AGIs $25k-50k, 2.3% for AGIs $50k-75k, 2.3% for AGIs $75k-100k, 2.1% for AGIs $100k-200k, 1.9% for AGIs over 200k)
Self-employment retirement plans: $19,371 (reported on 1.1% of returns)
61853:
$19,371
Illinois:
$24,666
Total itemized deductions: $23,912 (18% of AGI, reported on 42.2% of returns)
Here:
$23,912
State:
$26,433
Here:
17.6% of AGI
State:
19.2% of AGI
(% of AGI for various income ranges: 8.9% for AGIs below $25k, 10.3% for AGIs $25k-50k, 13.2% for AGIs $50k-75k, 14.0% for AGIs $75k-100k, 15.2% for AGIs $100k-200k, 11.5% for AGIs over 200k)
Charity contributions: $4,858 (reported on 34.6% of returns)
Here:
$4,858
State:
$4,525
(% of AGI for various income ranges: 0.7% for AGIs below $25k, 1.1% for AGIs $25k-50k, 1.6% for AGIs $50k-75k, 1.9% for AGIs $75k-100k, 2.5% for AGIs $100k-200k, 2.7% for AGIs over 200k)
Taxes paid: $10,940 (reported on 42.0% of returns)
61853:
$10,940
State:
$11,968
(% of AGI for various income ranges: 2.0% for AGIs below $25k, 3.2% for AGIs $25k-50k, 5.0% for AGIs $50k-75k, 5.9% for AGIs $75k-100k, 7.3% for AGIs $100k-200k, 6.2% for AGIs over 200k)
Earned income credit: $2,210 (reported on 11.9% of returns)
Here:
$2,210
State:
$2,349
(% of AGI for various income ranges: 5.6% for AGIs below $25k, 1.1% for AGIs $25k-50k)
Percentage of individuals using paid preparers for their 2012 taxes: 46.7%
Here:
47%
State:
57%
(% for various income ranges: 38.1% for AGIs below $25k, 45.8% for AGIs $25k-50k, 51.2% for AGIs $50k-75k, 50.6% for AGIs $75k-100k, 49.6% for AGIs $100k-200k, 69.7% for AGIs over 200k)
Averages for the 2004 tax year for zip code 61853, filed in 2005:
Average Adjusted Gross Income (AGI) in 2004: $55,185 (Individual Income Tax Returns)
Here:
$55,185
State:
$54,625
Salary/wage: $48,061 (reported on 89.1% of returns)
Here:
$48,061
State:
$46,811
(% of AGI for various income ranges: 118.8% for AGIs below $10k, 78.8% for AGIs $10k-25k, 81.7% for AGIs $25k-50k, 80.6% for AGIs $50k-75k, 83.7% for AGIs $75k-100k, 71.2% for AGIs over 100k)
Taxable interest for individuals: $1,259 (reported on 52.1% of returns)
This zip code:
$1,259
Illinois:
$2,101
(% of AGI for various income ranges: 6.4% for AGIs below $10k, 1.9% for AGIs $10k-25k, 1.1% for AGIs $25k-50k, 1.1% for AGIs $50k-75k, 1.0% for AGIs $75k-100k, 1.1% for AGIs over 100k)
Taxable dividends: $2,653 (reported on 30.0% of returns)
Here:
$2,653
State:
$4,306
(% of AGI for various income ranges: 2.7% for AGIs below $10k, 1.1% for AGIs $10k-25k, 0.8% for AGIs $25k-50k, 0.8% for AGIs $50k-75k, 0.9% for AGIs $75k-100k, 2.2% for AGIs over 100k)
Net capital gain/loss: +$8,651 (reported on 22.3% of returns)
Here:
+$8,651
State:
+$17,321
(% of AGI for various income ranges: 0.2% for AGIs below $10k, 0.5% for AGIs $10k-25k, 0.3% for AGIs $25k-50k, 0.7% for AGIs $50k-75k, 1.6% for AGIs $75k-100k, 6.9% for AGIs over 100k)
Profit/loss from business: +$14,398 (reported on 16.8% of returns)
Here:
+$14,398
State:
+$11,771
(% of AGI for various income ranges: 6.7% for AGIs below $10k, 5.1% for AGIs $10k-25k, 4.1% for AGIs $25k-50k, 3.5% for AGIs $50k-75k, 2.0% for AGIs $75k-100k, 5.7% for AGIs over 100k)
IRA payment deduction: $3,368 (reported on 2.8% of returns)
61853:
$3,368
Illinois:
$3,087
(% of AGI for various income ranges: 1.1% for AGIs below $10k, 0.3% for AGIs $25k-50k, 0.3% for AGIs $50k-75k, 0.1% for AGIs $75k-100k, 0.1% for AGIs over 100k)
Self-employed pension: $12,459 (reported on 1.4% of returns)
Here:
$12,459
Illinois:
$16,965
Total itemized deductions: $18,078 (18% of AGI, reported on 38.8% of returns)
Here:
$18,078
State:
$20,239
Here:
18.4% of AGI
State:
19.5% of AGI
(% of AGI for various income ranges: 10.6% for AGIs below $10k, 6.2% for AGIs $10k-25k, 9.8% for AGIs $25k-50k, 14.0% for AGIs $50k-75k, 14.5% for AGIs $75k-100k, 13.2% for AGIs over 100k)
Charity contributions deductions: $3,931 (4% of AGI, reported on 33.9% of returns)
Here:
$3,931
State:
$3,719
Here:
3.8% of AGI
State:
3.4% of AGI
(% of AGI for various income ranges: 0.3% for AGIs below $10k, 0.6% for AGIs $10k-25k, 1.2% for AGIs $25k-50k, 2.2% for AGIs $50k-75k, 2.4% for AGIs $75k-100k, 3.2% for AGIs over 100k)
Total tax: $8,454 (reported on 78.4% of returns)
61853:
$8,454
State:
$9,882
(% of AGI for various income ranges: 3.3% for AGIs below $10k, 4.3% for AGIs $10k-25k, 7.2% for AGIs $25k-50k, 8.2% for AGIs $50k-75k, 9.7% for AGIs $75k-100k, 17.2% for AGIs over 100k)
Earned income credit: $1,696 (reported on 9.9% of returns)
Here:
$1,696
State:
$1,788
Percentage of individuals using paid preparers for their 2004 taxes: 47.5%
Here:
47%
State:
61%
(% for various income ranges: 34.4% for AGIs below $10k, 49.7% for AGIs $10k-25k, 52.5% for AGIs $25k-50k, 49.7% for AGIs $50k-75k, 48.2% for AGIs $75k-100k, 54.5% for AGIs over 100k)
Household received Food Stamps/SNAP in the past 12 months: 165 Household did not receive Food Stamps/SNAP in the past 12 months: 4,762
Women who had a birth in the past 12 months: 235 (175 now married, 59 unmarried) Women who did not have a birth in the past 12 months: 2,998 (1,608 now married, 1,374 unmarried)
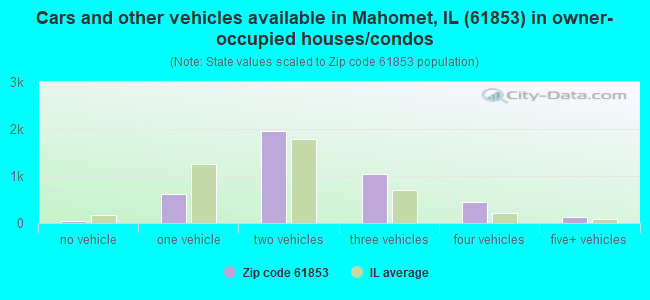
Housing units in zip code 61853 with a mortgage: 3,057 (286 second mortgage, 270 both second mortgage and home equity loan) Houses without a mortgage: 84
Median monthly owner costs for units with a mortgage: $1,847 Median monthly owner costs for units without a mortgage: $783
Residents with income below the poverty level in 2022:
This zip code:
4.1%
Whole state:
11.9%
Residents with income below 50% of the poverty level in 2022:
This zip code:
2.8%
Whole state:
5.7%
Median number of rooms in houses and condos:
Here:
7.8
State:
6.4
Median number of rooms in apartments:
Here:
4.3
State:
4.1
Notable locations in this zip code not listed on our city pages
Churches in zip code 61853 include: Shiloh Church (A), Bethel Church of Mahomet (B), First Baptist Church (C), Mahomet United Methodist Church (D), Sangamon Valley Christian Church (E). Display/hide their locations on the map
In group quarters: 4 (-1 institutionalized population)
Size of family households: 1,693 2-persons, 834 3-persons, 806 4-persons, 485 5-persons, 75 6-persons, 36 7-or-more-persons
Size of nonfamily households: 896 1-person, 103 2-persons, 18 3-persons
3,462 married couples with children.
455 single-parent households (46 men, 409 women).
94.5% of residents of 61853 zip code speak English at home.
2.0% of residents speak Spanish at home (90% very well, 10% not well).
2.0% of residents speak other Indo-European language at home (76% very well, 21% well, 3% not well).
0.4% of residents speak Asian or Pacific Island language at home (100% very well).
0.2% of residents speak other language at home (100% very well).
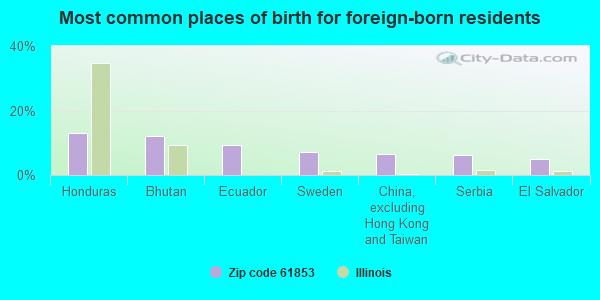
Foreign born population: 458 (3.3%) (76.7% of them are naturalized citizens)
This zip code:
3.3%
Whole state:
14.4%
13%Honduras
12%Bhutan
9%Ecuador
7%Sweden
7%China, excluding Hong Kong and Taiwan
6%Serbia
5%El Salvador
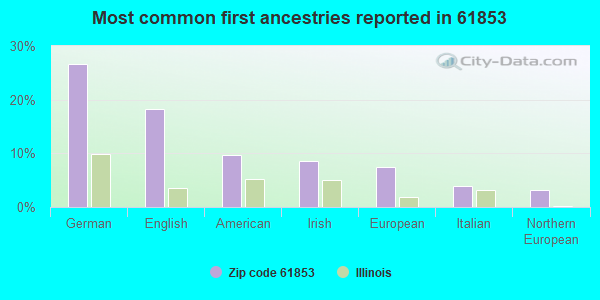
27%German
18%English
10%American
8%Irish
7%European
4%Italian
3%Northern European
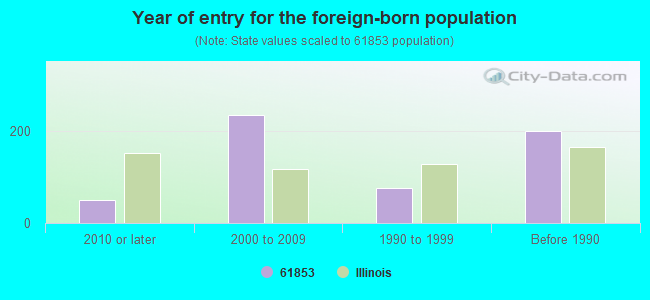
Year of entry for the foreign-born population
512010 or later
2362000 to 2009
771990 to 1999
202Before 1990
Major facilities with environmental interests located in this zip code:
MID AMERICA SAND & GRAVEL CO (250 COUNTY RD 2050 N in MAHOMET, IL)
STATE MASTER (Illinois EPA Project) - HAZARDOUS WASTE PROGRAM, SCRAP TIRE MANAGEMENT, AIR PROGRAM AIR MINOR (AIRS/AFS) CRITERIA AND HAZARDOUS AIR POLLUTANT INVENTORY (Inventory of air pollution sources) National Pollutant Discharge Elimination System NON-MAJOR (Tracking pollutant discharge elimination systems) - permit National Pollutant Discharge Elimination System NON-MAJOR (Tracking pollutant discharge elimination systems) - permit National Pollutant Discharge Elimination System NON-MAJOR (Tracking pollutant discharge elimination systems) - permit Large Quantity Generators, more that 1000 kg of hazardous waste/month (Resource Conservation and Recovery Act (tracking hazardous waste)) - notification Business SIC classification: CRUSHED AND BROKEN LIMESTONE; CONSTRUCTION SAND AND GRAVEL Organizations: MID AMERICA SAND AND GRAVEL INC (CONTACT/OWNER)
RISING FARMERS GRAIN CO (601 S. DIVISION in MAHOMET, IL)
STATE MASTER (Illinois EPA Project) - AIR PROGRAM AIR MINOR (AIRS/AFS) Business SIC classification: GRAIN AND FIELD BEANS Alternative names: PARKER GRAIN COMPANY
MAHOMET STP (806 1/2 SOUTH CENTER STREET in MAHOMET, IL)
STATE MASTER (Illinois EPA Project) - National Pollutant Discharge Elimination System Permit National Pollutant Discharge Elimination System NON-MAJOR (Tracking pollutant discharge elimination systems) - permit National Pollutant Discharge Elimination System NON-MAJOR (Tracking pollutant discharge elimination systems) - permit Business SIC classification: SEWERAGE SYSTEMS Alternative names: MAHOMET STP, VILLAGE OF, MAHOMET, VILLAGE OF
ILLICO INDEPENDENT OIL CO (204 LOMBARD STREET in MAHOMET, IL)
STATE MASTER (Illinois EPA Project) - AIR PROGRAM, SOLID WASTE PROGRAM, HAZARDOUS WASTE PROGRAM AIR MINOR (AIRS/AFS) CRITERIA AND HAZARDOUS AIR POLLUTANT INVENTORY (Inventory of air pollution sources) Business SIC classification: PETROLEUM BULK STATIONS AND TERMINALS Alternative names: CLARK STORE 2078
COOKS AUTOBODY (505 S MAIN ST in MAHOMET, IL)
STATE MASTER (Illinois EPA Project) - SOLID WASTE PROGRAM (Resource Conservation and Recovery Act (tracking hazardous waste))
ILLINI FS INC (RURAL in MAHOMET, IL)
STATE MASTER (Illinois EPA Project) - AIR PROGRAM AIR MINOR (AIRS/AFS) Business SIC classification: FARM SUPPLIES
ILLINI FS INC (ROUTE 150 W in MAHOMET, IL)
STATE MASTER (Illinois EPA Project) - AIR PROGRAM AIR MINOR (AIRS/AFS) Business SIC classification: BOOKS, PERIODICALS, AND NEWSPAPERS
MAHOMET IGA FOODLINER (EASTWOOD CENTER in MAHOMET, IL)
STATE MASTER (Illinois EPA Project) - AIR PROGRAM AIR MINOR (AIRS/AFS) Business SIC classification: NONCLASSIFIABLE ESTABLISHMENTS
MAHOMET LAKE OF THE WOODS FOOD CENTER (LAKE OF THE WOODS RD in MAHOMET, IL)
STATE MASTER (Illinois EPA Project) - AIR PROGRAM AIR MINOR (AIRS/AFS) Business SIC classification: NONCLASSIFIABLE ESTABLISHMENTS Alternative names: MAHOMET LAKE OF THE WOODS FOOD CTR/RED F
MAHOMET LANDSCAPE (604 W. HICKORY in MAHOMET, IL)
STATE MASTER (Illinois EPA Project) - AIR PROGRAM AIR MINOR (AIRS/AFS) Business SIC classification: NONCLASSIFIABLE ESTABLISHMENTS
COURTESY CLEANERS (EASTWOOD CTR in MAHOMET, IL)
STATE MASTER (Illinois EPA Project) - HAZARDOUS WASTE PROGRAM Conditionally Exempt Small Quantity Generators, less than 100 kg/month of hazardous waste (Resource Conservation and Recovery Act (tracking hazardous waste)) Organizations: NURMI PAUL E (CONTACT/OWNER)
DARRELL RUCH (204 N. LOMBARD in MAHOMET, IL)
STATE MASTER (Illinois EPA Project) - AIR PROGRAM AIR MINOR (AIRS/AFS) Business SIC classification: NONCLASSIFIABLE ESTABLISHMENTS Alternative names: DANIEL M. DUNN
AMERICAN LEGEND M/C TRAILERS INC (903 S PRAIRIEVIEW RD in MAHOMET, IL)
STATE MASTER (Illinois EPA Project) - AIR PROGRAM AIR MINOR (AIRS/AFS) Business SIC classification: NONCLASSIFIABLE ESTABLISHMENTS
Housing units lacking complete kitchen facilities: 0.2%
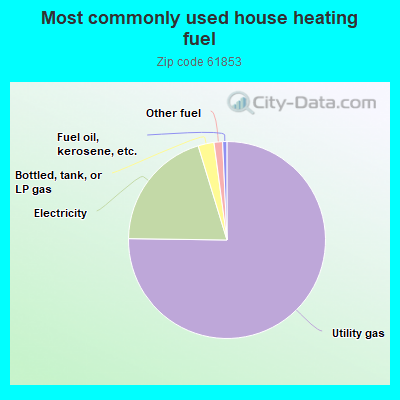
75.0%Utility gas
20.0%Electricity
2.6%Bottled, tank, or LP gas
1.4%Other fuel
0.7%Fuel oil, kerosene, etc.
Population in 1990: 8,734. Population change in the 1990s: +1,720 (+19.7%).
Place of birth for U.S.-born residents:
This state: 10,785
Northeast: 256
Midwest: 1,591
South: 534
West: 295
53% of the 61853 zip code residents lived in the same house 5 years ago. Out of people who lived in different houses, 60% lived in this county. Out of people who lived in different counties, 50% lived in Illinois.
92% of the 61853 zip code residents lived in the same house 1 year ago. Out of people who lived in different houses, 69% moved from this county. Out of people who lived in different houses, 7% moved from different county within same state. Out of people who lived in different houses, 22% moved from different state.
Private vs. public school enrollment:
Students in private schools in grades 1 to 8 (elementary and middle school): 248
Here:
12.8%
Illinois:
13.3%
Students in private schools in grades 9 to 12 (high school):
Here:
0.0%
Illinois:
9.9%
Students in private undergraduate colleges: 33
Here:
4.7%
Illinois:
27.4%
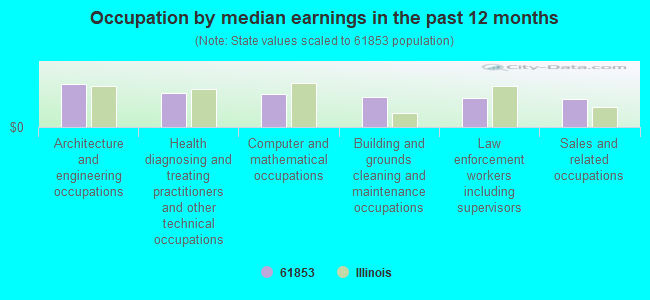
Occupation by median earnings in the past 12 months ($)
118,446Architecture and engineering occupations
94,742Health diagnosing and treating practitioners and other technical occupations
91,046Computer and mathematical occupations
83,765Building and grounds cleaning and maintenance occupations
79,940Law enforcement workers including supervisors
76,784Sales and related occupations
Companies with federal contracts located in this zip code:
SUBICK, CAROL (701 N CRAIG ST in MAHOMET, IL; small business) : $70,400 in 3 contractsfrom 2002 to 2004
$35,200 with Army for Programming Services. Signed on 2003-04-18. Completion date: 2003-09-30.
$22,000, same as above.Signed on 2004-05-12. Completion date: 2004-12-31.
$13,200, same as above.Signed on 2002-06-05. Completion date: 2002-08-30.
VERTICODE, LLC (1108 RIDGEWOOD DRIVE in MAHOMET, IL; small business) : $48,080 in 3 contractsfrom 2002 to 2003
$24,480 with Army for Programming Services. Signed on 2003-05-20. Completion date: 2003-08-15.
$14,000, same as above.Signed on 2003-08-27. Completion date: 2003-09-30.
$9,600 with U.S. Army Corps of Engineers - civil program financing only for Programming Services. Signed on 2002-12-19. Completion date: 2003-03-24.
PFT ROBERSON INC (1100 SOUTH ROBERSON DR in MAHOMET, IL) : $7,888 in 2 contractsfrom 2001 to 2002
$5,290 with Army for Other Cargo and Freight Services. Taking place in CO. Signed on 2002-02-12. Completion date: 2002-02-19.
$2,598, same as above.Signed on 2001-11-28. Completion date: 2001-11-30.
Top industries in this zip code by the number of employees in 2005:
Administrative and Support and Waste Management and Remediation Services: Professional Employer Organizations (250-499 employees: 1 establishment)
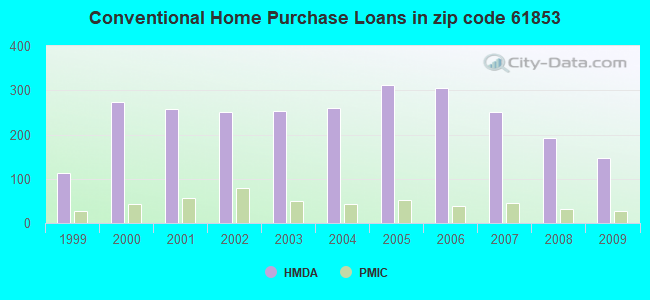
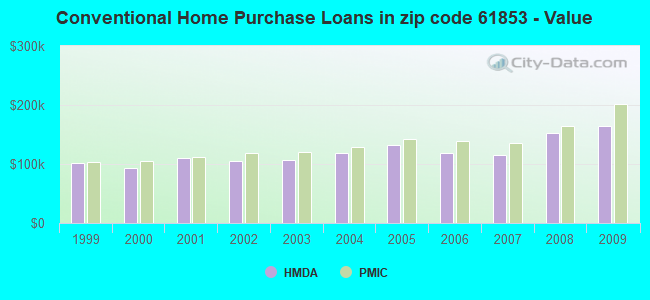
Detailed PMIC statistics for the following Tracts:0105.00
, 0106.01
2002 - 2018 National Fire Incident Reporting System (NFIRS) incidents
Based on the data from the years 2002 - 2018 the average number of fire incidents per year is 43. The highest number of fire incidents - 69 took place in 2007, and the least - 24 in 2011. The data has a rising trend.
When looking into fire subcategories, the most incidents belonged to: Outside Fires (44.0%), and Structure Fires (35.8%).
Fire incident types reported to NFIRS in Zip Code 61853
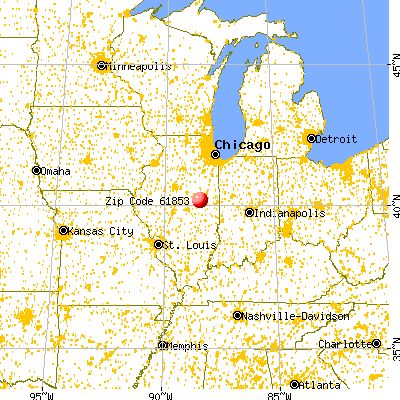


 Nearest zip codes: 61854, 61875, 61843, 61815, 61884, 61822.


 Based on the data from the years 2002 - 2018 the average number of fire incidents per year is 43. The highest number of fire incidents - 69 took place in 2007, and the least - 24 in 2011. The data has a rising trend.
 When looking into fire subcategories, the most incidents belonged to: Outside Fires (44.0%), and Structure Fires (35.8%).