Estimated zip code population in 2022: 10,979
Zip code population in 2010: 11,186
Zip code population in 2000: 10,648
Houses and condos: 5,074
Renter-occupied apartments: 962
% of renters here:
21%State:
33%
March 2022 cost of living index in zip code 62010: 95.0
(less than average, U.S. average is 100)
Land area: 22.1
sq. mi.
Water area: 0.3
sq. mi.
Population density: 497 people per square mile (low).
OSM Map
General Map
Google Map
MSN Map
OSM Map
General Map
Google Map
MSN Map
OSM Map
General Map
Google Map
MSN Map
OSM Map
General Map
Google Map
MSN Map
Please wait while loading the map...
Real estate property taxes paid for housing units in 2022:
This zip code:
1.9% ($3,316)Illinois:
2.0% ($4,912)
Median real estate property taxes paid for housing units with mortgages in 2022: $3,423 (2.0%)
Median real estate property taxes paid for housing units with no mortgage in 2022: $3,116 (1.8%)
Profiles of local businesses
Business Search - 14 Million verified businesses
Males: 5,445 Females: 5,534
For population 25 years and over in 62010:
High school or higher: 92.1%Bachelor's degree or higher: 27.4%Graduate or professional degree: 8.9%Unemployed: 5.1%Mean travel time to work (commute): 24.4 minutes
For population 15 years and over in 62010:
Never married: 24.5%Now married: 56.6%Separated: 0.7%Widowed: 5.9%Divorced: 12.2%
Zip code 62010 compared to state average:
Black race population percentage significantly below state average. Hispanic race population percentage significantly below state average. Foreign-born population percentage significantly below state average. Renting percentage below state average. Length of stay since moving in above state average. 10,426 95.0% White 294 2.7% Two or more races 120 1.1% Hispanic or Latino 113 1.0% Black 18 0.2% Asian 3 0.03% Native Hawaiian and Other 1 0.01% American Indian
Data:
Median household income ($)
Median household income (% change since 2000)
Household income diversity
Ratio of average income to average house value (%)
Ratio of average income to average rent
Median household income ($) - White
Median household income ($) - Black or African American
Median household income ($) - Asian
Median household income ($) - Hispanic or Latino
Median household income ($) - American Indian and Alaska Native
Median household income ($) - Multirace
Median household income ($) - Other Race
Median household income for houses/condos with a mortgage ($)
Median household income for apartments without a mortgage ($)
Races - White alone (%)
Races - White alone (% change since 2000)
Races - Black alone (%)
Races - Black alone (% change since 2000)
Races - American Indian alone (%)
Races - American Indian alone (% change since 2000)
Races - Asian alone (%)
Races - Asian alone (% change since 2000)
Races - Hispanic (%)
Races - Hispanic (% change since 2000)
Races - Native Hawaiian and Other Pacific Islander alone (%)
Races - Native Hawaiian and Other Pacific Islander alone (% change since 2000)
Races - Two or more races (%)
Races - Two or more races (% change since 2000)
Races - Other race alone (%)
Races - Other race alone (% change since 2000)
Racial diversity
Unemployment (%)
Unemployment (% change since 2000)
Unemployment (%) - White
Unemployment (%) - Black or African American
Unemployment (%) - Asian
Unemployment (%) - Hispanic or Latino
Unemployment (%) - American Indian and Alaska Native
Unemployment (%) - Multirace
Unemployment (%) - Other Race
Population density (people per square mile)
Population - Males (%)
Population - Females (%)
Population - Males (%) - White
Population - Males (%) - Black or African American
Population - Males (%) - Asian
Population - Males (%) - Hispanic or Latino
Population - Males (%) - American Indian and Alaska Native
Population - Males (%) - Multirace
Population - Males (%) - Other Race
Population - Females (%) - White
Population - Females (%) - Black or African American
Population - Females (%) - Asian
Population - Females (%) - Hispanic or Latino
Population - Females (%) - American Indian and Alaska Native
Population - Females (%) - Multirace
Population - Females (%) - Other Race
Coronavirus confirmed cases (Apr 25, 2024)
Deaths caused by coronavirus (Apr 25, 2024)
Coronavirus confirmed cases (per 100k population) (Apr 25, 2024)
Deaths caused by coronavirus (per 100k population) (Apr 25, 2024)
Daily increase in number of cases (Apr 25, 2024)
Weekly increase in number of cases (Apr 25, 2024)
Cases doubled (in days) (Apr 25, 2024)
Hospitalized patients (Apr 18, 2022)
Negative test results (Apr 18, 2022)
Total test results (Apr 18, 2022)
COVID Vaccine doses distributed (per 100k population) (Sep 19, 2023)
COVID Vaccine doses administered (per 100k population) (Sep 19, 2023)
COVID Vaccine doses distributed (Sep 19, 2023)
COVID Vaccine doses administered (Sep 19, 2023)
Likely homosexual households (%)
Likely homosexual households (% change since 2000)
Likely homosexual households - Lesbian couples (%)
Likely homosexual households - Lesbian couples (% change since 2000)
Likely homosexual households - Gay men (%)
Likely homosexual households - Gay men (% change since 2000)
Cost of living index
Median gross rent ($)
Median contract rent ($)
Median monthly housing costs ($)
Median house or condo value ($)
Median house or condo value ($ change since 2000)
Mean house or condo value by units in structure - 1, detached ($)
Mean house or condo value by units in structure - 1, attached ($)
Mean house or condo value by units in structure - 2 ($)
Mean house or condo value by units in structure by units in structure - 3 or 4 ($)
Mean house or condo value by units in structure - 5 or more ($)
Mean house or condo value by units in structure - Boat, RV, van, etc. ($)
Mean house or condo value by units in structure - Mobile home ($)
Median house or condo value ($) - White
Median house or condo value ($) - Black or African American
Median house or condo value ($) - Asian
Median house or condo value ($) - Hispanic or Latino
Median house or condo value ($) - American Indian and Alaska Native
Median house or condo value ($) - Multirace
Median house or condo value ($) - Other Race
Median resident age
Resident age diversity
Median resident age - Males
Median resident age - Females
Median resident age - White
Median resident age - Black or African American
Median resident age - Asian
Median resident age - Hispanic or Latino
Median resident age - American Indian and Alaska Native
Median resident age - Multirace
Median resident age - Other Race
Median resident age - Males - White
Median resident age - Males - Black or African American
Median resident age - Males - Asian
Median resident age - Males - Hispanic or Latino
Median resident age - Males - American Indian and Alaska Native
Median resident age - Males - Multirace
Median resident age - Males - Other Race
Median resident age - Females - White
Median resident age - Females - Black or African American
Median resident age - Females - Asian
Median resident age - Females - Hispanic or Latino
Median resident age - Females - American Indian and Alaska Native
Median resident age - Females - Multirace
Median resident age - Females - Other Race
Commute - mean travel time to work (minutes)
Travel time to work - Less than 5 minutes (%)
Travel time to work - Less than 5 minutes (% change since 2000)
Travel time to work - 5 to 9 minutes (%)
Travel time to work - 5 to 9 minutes (% change since 2000)
Travel time to work - 10 to 19 minutes (%)
Travel time to work - 10 to 19 minutes (% change since 2000)
Travel time to work - 20 to 29 minutes (%)
Travel time to work - 20 to 29 minutes (% change since 2000)
Travel time to work - 30 to 39 minutes (%)
Travel time to work - 30 to 39 minutes (% change since 2000)
Travel time to work - 40 to 59 minutes (%)
Travel time to work - 40 to 59 minutes (% change since 2000)
Travel time to work - 60 to 89 minutes (%)
Travel time to work - 60 to 89 minutes (% change since 2000)
Travel time to work - 90 or more minutes (%)
Travel time to work - 90 or more minutes (% change since 2000)
Marital status - Never married (%)
Marital status - Now married (%)
Marital status - Separated (%)
Marital status - Widowed (%)
Marital status - Divorced (%)
Median family income ($)
Median family income (% change since 2000)
Median non-family income ($)
Median non-family income (% change since 2000)
Median per capita income ($)
Median per capita income (% change since 2000)
Median family income ($) - White
Median family income ($) - Black or African American
Median family income ($) - Asian
Median family income ($) - Hispanic or Latino
Median family income ($) - American Indian and Alaska Native
Median family income ($) - Multirace
Median family income ($) - Other Race
Median year house/condo built
Median year apartment built
Year house built - Built 2005 or later (%)
Year house built - Built 2000 to 2004 (%)
Year house built - Built 1990 to 1999 (%)
Year house built - Built 1980 to 1989 (%)
Year house built - Built 1970 to 1979 (%)
Year house built - Built 1960 to 1969 (%)
Year house built - Built 1950 to 1959 (%)
Year house built - Built 1940 to 1949 (%)
Year house built - Built 1939 or earlier (%)
Average household size
Household density (households per square mile)
Average household size - White
Average household size - Black or African American
Average household size - Asian
Average household size - Hispanic or Latino
Average household size - American Indian and Alaska Native
Average household size - Multirace
Average household size - Other Race
Occupied housing units (%)
Vacant housing units (%)
Owner occupied housing units (%)
Renter occupied housing units (%)
Vacancy status - For rent (%)
Vacancy status - For sale only (%)
Vacancy status - Rented or sold, not occupied (%)
Vacancy status - For seasonal, recreational, or occasional use (%)
Vacancy status - For migrant workers (%)
Vacancy status - Other vacant (%)
Residents with income below the poverty level (%)
Residents with income below 50% of the poverty level (%)
Children below poverty level (%)
Poor families by family type - Married-couple family (%)
Poor families by family type - Male, no wife present (%)
Poor families by family type - Female, no husband present (%)
Poverty status for native-born residents (%)
Poverty status for foreign-born residents (%)
Poverty among high school graduates not in families (%)
Poverty among people who did not graduate high school not in families (%)
Residents with income below the poverty level (%) - White
Residents with income below the poverty level (%) - Black or African American
Residents with income below the poverty level (%) - Asian
Residents with income below the poverty level (%) - Hispanic or Latino
Residents with income below the poverty level (%) - American Indian and Alaska Native
Residents with income below the poverty level (%) - Multirace
Residents with income below the poverty level (%) - Other Race
Air pollution - Air Quality Index (AQI)
Air pollution - CO
Air pollution - NO2
Air pollution - SO2
Air pollution - Ozone
Air pollution - PM10
Air pollution - PM25
Air pollution - Pb
Crime - Murders per 100,000 population
Crime - Rapes per 100,000 population
Crime - Robberies per 100,000 population
Crime - Assaults per 100,000 population
Crime - Burglaries per 100,000 population
Crime - Thefts per 100,000 population
Crime - Auto thefts per 100,000 population
Crime - Arson per 100,000 population
Crime - City-data.com crime index
Crime - Violent crime index
Crime - Property crime index
Crime - Murders per 100,000 population (5 year average)
Crime - Rapes per 100,000 population (5 year average)
Crime - Robberies per 100,000 population (5 year average)
Crime - Assaults per 100,000 population (5 year average)
Crime - Burglaries per 100,000 population (5 year average)
Crime - Thefts per 100,000 population (5 year average)
Crime - Auto thefts per 100,000 population (5 year average)
Crime - Arson per 100,000 population (5 year average)
Crime - City-data.com crime index (5 year average)
Crime - Violent crime index (5 year average)
Crime - Property crime index (5 year average)
1996 Presidential Elections Results (%) - Democratic Party (Clinton)
1996 Presidential Elections Results (%) - Republican Party (Dole)
1996 Presidential Elections Results (%) - Other
2000 Presidential Elections Results (%) - Democratic Party (Gore)
2000 Presidential Elections Results (%) - Republican Party (Bush)
2000 Presidential Elections Results (%) - Other
2004 Presidential Elections Results (%) - Democratic Party (Kerry)
2004 Presidential Elections Results (%) - Republican Party (Bush)
2004 Presidential Elections Results (%) - Other
2008 Presidential Elections Results (%) - Democratic Party (Obama)
2008 Presidential Elections Results (%) - Republican Party (McCain)
2008 Presidential Elections Results (%) - Other
2012 Presidential Elections Results (%) - Democratic Party (Obama)
2012 Presidential Elections Results (%) - Republican Party (Romney)
2012 Presidential Elections Results (%) - Other
2016 Presidential Elections Results (%) - Democratic Party (Clinton)
2016 Presidential Elections Results (%) - Republican Party (Trump)
2016 Presidential Elections Results (%) - Other
2020 Presidential Elections Results (%) - Democratic Party (Biden)
2020 Presidential Elections Results (%) - Republican Party (Trump)
2020 Presidential Elections Results (%) - Other
Ancestries Reported - Arab (%)
Ancestries Reported - Czech (%)
Ancestries Reported - Danish (%)
Ancestries Reported - Dutch (%)
Ancestries Reported - English (%)
Ancestries Reported - French (%)
Ancestries Reported - French Canadian (%)
Ancestries Reported - German (%)
Ancestries Reported - Greek (%)
Ancestries Reported - Hungarian (%)
Ancestries Reported - Irish (%)
Ancestries Reported - Italian (%)
Ancestries Reported - Lithuanian (%)
Ancestries Reported - Norwegian (%)
Ancestries Reported - Polish (%)
Ancestries Reported - Portuguese (%)
Ancestries Reported - Russian (%)
Ancestries Reported - Scotch-Irish (%)
Ancestries Reported - Scottish (%)
Ancestries Reported - Slovak (%)
Ancestries Reported - Subsaharan African (%)
Ancestries Reported - Swedish (%)
Ancestries Reported - Swiss (%)
Ancestries Reported - Ukrainian (%)
Ancestries Reported - United States (%)
Ancestries Reported - Welsh (%)
Ancestries Reported - West Indian (%)
Ancestries Reported - Other (%)
Educational Attainment - No schooling completed (%)
Educational Attainment - Less than high school (%)
Educational Attainment - High school or equivalent (%)
Educational Attainment - Less than 1 year of college (%)
Educational Attainment - 1 or more years of college (%)
Educational Attainment - Associate degree (%)
Educational Attainment - Bachelor's degree (%)
Educational Attainment - Master's degree (%)
Educational Attainment - Professional school degree (%)
Educational Attainment - Doctorate degree (%)
School Enrollment - Nursery, preschool (%)
School Enrollment - Kindergarten (%)
School Enrollment - Grade 1 to 4 (%)
School Enrollment - Grade 5 to 8 (%)
School Enrollment - Grade 9 to 12 (%)
School Enrollment - College undergrad (%)
School Enrollment - Graduate or professional (%)
School Enrollment - Not enrolled in school (%)
School enrollment - Public schools (%)
School enrollment - Private schools (%)
School enrollment - Not enrolled (%)
Median number of rooms in houses and condos
Median number of rooms in apartments
Housing units lacking complete plumbing facilities (%)
Housing units lacking complete kitchen facilities (%)
Density of houses
Urban houses (%)
Rural houses (%)
Households with people 60 years and over (%)
Households with people 65 years and over (%)
Households with people 75 years and over (%)
Households with one or more nonrelatives (%)
Households with no nonrelatives (%)
Population in households (%)
Family households (%)
Nonfamily households (%)
Population in families (%)
Family households with own children (%)
Median number of bedrooms in owner occupied houses
Mean number of bedrooms in owner occupied houses
Median number of bedrooms in renter occupied houses
Mean number of bedrooms in renter occupied houses
Median number of vehichles in owner occupied houses
Mean number of vehichles in owner occupied houses
Median number of vehichles in renter occupied houses
Mean number of vehichles in renter occupied houses
Mortgage status - with mortgage (%)
Mortgage status - with second mortgage (%)
Mortgage status - with home equity loan (%)
Mortgage status - with both second mortgage and home equity loan (%)
Mortgage status - without a mortgage (%)
Average family size
Average family size - White
Average family size - Black or African American
Average family size - Asian
Average family size - Hispanic or Latino
Average family size - American Indian and Alaska Native
Average family size - Multirace
Average family size - Other Race
Geographical mobility - Same house 1 year ago (%)
Geographical mobility - Moved within same county (%)
Geographical mobility - Moved from different county within same state (%)
Geographical mobility - Moved from different state (%)
Geographical mobility - Moved from abroad (%)
Place of birth - Born in state of residence (%)
Place of birth - Born in other state (%)
Place of birth - Native, outside of US (%)
Place of birth - Foreign born (%)
Housing units in structures - 1, detached (%)
Housing units in structures - 1, attached (%)
Housing units in structures - 2 (%)
Housing units in structures - 3 or 4 (%)
Housing units in structures - 5 to 9 (%)
Housing units in structures - 10 to 19 (%)
Housing units in structures - 20 to 49 (%)
Housing units in structures - 50 or more (%)
Housing units in structures - Mobile home (%)
Housing units in structures - Boat, RV, van, etc. (%)
House/condo owner moved in on average (years ago)
Renter moved in on average (years ago)
Year householder moved into unit - Moved in 1999 to March 2000 (%)
Year householder moved into unit - Moved in 1995 to 1998 (%)
Year householder moved into unit - Moved in 1990 to 1994 (%)
Year householder moved into unit - Moved in 1980 to 1989 (%)
Year householder moved into unit - Moved in 1970 to 1979 (%)
Year householder moved into unit - Moved in 1969 or earlier (%)
Means of transportation to work - Drove car alone (%)
Means of transportation to work - Carpooled (%)
Means of transportation to work - Public transportation (%)
Means of transportation to work - Bus or trolley bus (%)
Means of transportation to work - Streetcar or trolley car (%)
Means of transportation to work - Subway or elevated (%)
Means of transportation to work - Railroad (%)
Means of transportation to work - Ferryboat (%)
Means of transportation to work - Taxicab (%)
Means of transportation to work - Motorcycle (%)
Means of transportation to work - Bicycle (%)
Means of transportation to work - Walked (%)
Means of transportation to work - Other means (%)
Working at home (%)
Industry diversity
Most Common Industries - Agriculture, forestry, fishing and hunting, and mining (%)
Most Common Industries - Agriculture, forestry, fishing and hunting (%)
Most Common Industries - Mining, quarrying, and oil and gas extraction (%)
Most Common Industries - Construction (%)
Most Common Industries - Manufacturing (%)
Most Common Industries - Wholesale trade (%)
Most Common Industries - Retail trade (%)
Most Common Industries - Transportation and warehousing, and utilities (%)
Most Common Industries - Transportation and warehousing (%)
Most Common Industries - Utilities (%)
Most Common Industries - Information (%)
Most Common Industries - Finance and insurance, and real estate and rental and leasing (%)
Most Common Industries - Finance and insurance (%)
Most Common Industries - Real estate and rental and leasing (%)
Most Common Industries - Professional, scientific, and management, and administrative and waste management services (%)
Most Common Industries - Professional, scientific, and technical services (%)
Most Common Industries - Management of companies and enterprises (%)
Most Common Industries - Administrative and support and waste management services (%)
Most Common Industries - Educational services, and health care and social assistance (%)
Most Common Industries - Educational services (%)
Most Common Industries - Health care and social assistance (%)
Most Common Industries - Arts, entertainment, and recreation, and accommodation and food services (%)
Most Common Industries - Arts, entertainment, and recreation (%)
Most Common Industries - Accommodation and food services (%)
Most Common Industries - Other services, except public administration (%)
Most Common Industries - Public administration (%)
Occupation diversity
Most Common Occupations - Management, business, science, and arts occupations (%)
Most Common Occupations - Management, business, and financial occupations (%)
Most Common Occupations - Management occupations (%)
Most Common Occupations - Business and financial operations occupations (%)
Most Common Occupations - Computer, engineering, and science occupations (%)
Most Common Occupations - Computer and mathematical occupations (%)
Most Common Occupations - Architecture and engineering occupations (%)
Most Common Occupations - Life, physical, and social science occupations (%)
Most Common Occupations - Education, legal, community service, arts, and media occupations (%)
Most Common Occupations - Community and social service occupations (%)
Most Common Occupations - Legal occupations (%)
Most Common Occupations - Education, training, and library occupations (%)
Most Common Occupations - Arts, design, entertainment, sports, and media occupations (%)
Most Common Occupations - Healthcare practitioners and technical occupations (%)
Most Common Occupations - Health diagnosing and treating practitioners and other technical occupations (%)
Most Common Occupations - Health technologists and technicians (%)
Most Common Occupations - Service occupations (%)
Most Common Occupations - Healthcare support occupations (%)
Most Common Occupations - Protective service occupations (%)
Most Common Occupations - Fire fighting and prevention, and other protective service workers including supervisors (%)
Most Common Occupations - Law enforcement workers including supervisors (%)
Most Common Occupations - Food preparation and serving related occupations (%)
Most Common Occupations - Building and grounds cleaning and maintenance occupations (%)
Most Common Occupations - Personal care and service occupations (%)
Most Common Occupations - Sales and office occupations (%)
Most Common Occupations - Sales and related occupations (%)
Most Common Occupations - Office and administrative support occupations (%)
Most Common Occupations - Natural resources, construction, and maintenance occupations (%)
Most Common Occupations - Farming, fishing, and forestry occupations (%)
Most Common Occupations - Construction and extraction occupations (%)
Most Common Occupations - Installation, maintenance, and repair occupations (%)
Most Common Occupations - Production, transportation, and material moving occupations (%)
Most Common Occupations - Production occupations (%)
Most Common Occupations - Transportation occupations (%)
Most Common Occupations - Material moving occupations (%)
People in Group quarters - Institutionalized population (%)
People in Group quarters - Correctional institutions (%)
People in Group quarters - Federal prisons and detention centers (%)
People in Group quarters - Halfway houses (%)
People in Group quarters - Local jails and other confinement facilities (including police lockups) (%)
People in Group quarters - Military disciplinary barracks (%)
People in Group quarters - State prisons (%)
People in Group quarters - Other types of correctional institutions (%)
People in Group quarters - Nursing homes (%)
People in Group quarters - Hospitals/wards, hospices, and schools for the handicapped (%)
People in Group quarters - Hospitals/wards and hospices for chronically ill (%)
People in Group quarters - Hospices or homes for chronically ill (%)
People in Group quarters - Military hospitals or wards for chronically ill (%)
People in Group quarters - Other hospitals or wards for chronically ill (%)
People in Group quarters - Hospitals or wards for drug/alcohol abuse (%)
People in Group quarters - Mental (Psychiatric) hospitals or wards (%)
People in Group quarters - Schools, hospitals, or wards for the mentally retarded (%)
People in Group quarters - Schools, hospitals, or wards for the physically handicapped (%)
People in Group quarters - Institutions for the deaf (%)
People in Group quarters - Institutions for the blind (%)
People in Group quarters - Orthopedic wards and institutions for the physically handicapped (%)
People in Group quarters - Wards in general hospitals for patients who have no usual home elsewhere (%)
People in Group quarters - Wards in military hospitals for patients who have no usual home elsewhere (%)
People in Group quarters - Juvenile institutions (%)
People in Group quarters - Long-term care (%)
People in Group quarters - Homes for abused, dependent, and neglected children (%)
People in Group quarters - Residential treatment centers for emotionally disturbed children (%)
People in Group quarters - Training schools for juvenile delinquents (%)
People in Group quarters - Short-term care, detention or diagnostic centers for delinquent children (%)
People in Group quarters - Type of juvenile institution unknown (%)
People in Group quarters - Noninstitutionalized population (%)
People in Group quarters - College dormitories (includes college quarters off campus) (%)
People in Group quarters - Military quarters (%)
People in Group quarters - On base (%)
People in Group quarters - Barracks, unaccompanied personnel housing (UPH), (Enlisted/Officer), ;and similar group living quarters for military personnel (%)
People in Group quarters - Transient quarters for temporary residents (%)
People in Group quarters - Military ships (%)
People in Group quarters - Group homes (%)
People in Group quarters - Homes or halfway houses for drug/alcohol abuse (%)
People in Group quarters - Homes for the mentally ill (%)
People in Group quarters - Homes for the mentally retarded (%)
People in Group quarters - Homes for the physically handicapped (%)
People in Group quarters - Other group homes (%)
People in Group quarters - Religious group quarters (%)
People in Group quarters - Dormitories (%)
People in Group quarters - Agriculture workers' dormitories on farms (%)
People in Group quarters - Job Corps and vocational training facilities (%)
People in Group quarters - Other workers' dormitories (%)
People in Group quarters - Crews of maritime vessels (%)
People in Group quarters - Other nonhousehold living situations (%)
People in Group quarters - Other noninstitutional group quarters (%)
Residents speaking English at home (%)
Residents speaking English at home - Born in the United States (%)
Residents speaking English at home - Native, born elsewhere (%)
Residents speaking English at home - Foreign born (%)
Residents speaking Spanish at home (%)
Residents speaking Spanish at home - Born in the United States (%)
Residents speaking Spanish at home - Native, born elsewhere (%)
Residents speaking Spanish at home - Foreign born (%)
Residents speaking other language at home (%)
Residents speaking other language at home - Born in the United States (%)
Residents speaking other language at home - Native, born elsewhere (%)
Residents speaking other language at home - Foreign born (%)
Class of Workers - Employee of private company (%)
Class of Workers - Self-employed in own incorporated business (%)
Class of Workers - Private not-for-profit wage and salary workers (%)
Class of Workers - Local government workers (%)
Class of Workers - State government workers (%)
Class of Workers - Federal government workers (%)
Class of Workers - Self-employed workers in own not incorporated business and Unpaid family workers (%)
House heating fuel used in houses and condos - Utility gas (%)
House heating fuel used in houses and condos - Bottled, tank, or LP gas (%)
House heating fuel used in houses and condos - Electricity (%)
House heating fuel used in houses and condos - Fuel oil, kerosene, etc. (%)
House heating fuel used in houses and condos - Coal or coke (%)
House heating fuel used in houses and condos - Wood (%)
House heating fuel used in houses and condos - Solar energy (%)
House heating fuel used in houses and condos - Other fuel (%)
House heating fuel used in houses and condos - No fuel used (%)
House heating fuel used in apartments - Utility gas (%)
House heating fuel used in apartments - Bottled, tank, or LP gas (%)
House heating fuel used in apartments - Electricity (%)
House heating fuel used in apartments - Fuel oil, kerosene, etc. (%)
House heating fuel used in apartments - Coal or coke (%)
House heating fuel used in apartments - Wood (%)
House heating fuel used in apartments - Solar energy (%)
House heating fuel used in apartments - Other fuel (%)
House heating fuel used in apartments - No fuel used (%)
Armed forces status - In Armed Forces (%)
Armed forces status - Civilian (%)
Armed forces status - Civilian - Veteran (%)
Armed forces status - Civilian - Nonveteran (%)
Fatal accidents locations in years 2005-2021
Fatal accidents locations in 2005
Fatal accidents locations in 2006
Fatal accidents locations in 2007
Fatal accidents locations in 2008
Fatal accidents locations in 2009
Fatal accidents locations in 2010
Fatal accidents locations in 2011
Fatal accidents locations in 2012
Fatal accidents locations in 2013
Fatal accidents locations in 2014
Fatal accidents locations in 2015
Fatal accidents locations in 2016
Fatal accidents locations in 2017
Fatal accidents locations in 2018
Fatal accidents locations in 2019
Fatal accidents locations in 2020
Fatal accidents locations in 2021
Alcohol use - People drinking some alcohol every month (%)
Alcohol use - People not drinking at all (%)
Alcohol use - Average days/month drinking alcohol
Alcohol use - Average drinks/week
Alcohol use - Average days/year people drink much
Audiometry - Average condition of hearing (%)
Audiometry - People that can hear a whisper from across a quiet room (%)
Audiometry - People that can hear normal voice from across a quiet room (%)
Audiometry - Ears ringing, roaring, buzzing (%)
Audiometry - Had a job exposure to loud noise (%)
Audiometry - Had off-work exposure to loud noise (%)
Blood Pressure & Cholesterol - Has high blood pressure (%)
Blood Pressure & Cholesterol - Checking blood pressure at home (%)
Blood Pressure & Cholesterol - Frequently checking blood cholesterol (%)
Blood Pressure & Cholesterol - Has high cholesterol level (%)
Consumer Behavior - Money monthly spent on food at supermarket/grocery store
Consumer Behavior - Money monthly spent on food at other stores
Consumer Behavior - Money monthly spent on eating out
Consumer Behavior - Money monthly spent on carryout/delivered foods
Consumer Behavior - Income spent on food at supermarket/grocery store (%)
Consumer Behavior - Income spent on food at other stores (%)
Consumer Behavior - Income spent on eating out (%)
Consumer Behavior - Income spent on carryout/delivered foods (%)
Current Health Status - General health condition (%)
Current Health Status - Blood donors (%)
Current Health Status - Has blood ever tested for HIV virus (%)
Current Health Status - Left-handed people (%)
Dermatology - People using sunscreen (%)
Diabetes - Diabetics (%)
Diabetes - Had a blood test for high blood sugar (%)
Diabetes - People taking insulin (%)
Diet Behavior & Nutrition - Diet health (%)
Diet Behavior & Nutrition - Milk product consumption (# of products/month)
Diet Behavior & Nutrition - Meals not home prepared (#/week)
Diet Behavior & Nutrition - Meals from fast food or pizza place (#/week)
Diet Behavior & Nutrition - Ready-to-eat foods (#/month)
Diet Behavior & Nutrition - Frozen meals/pizza (#/month)
Drug Use - People that ever used marijuana or hashish (%)
Drug Use - Ever used hard drugs (%)
Drug Use - Ever used any form of cocaine (%)
Drug Use - Ever used heroin (%)
Drug Use - Ever used methamphetamine (%)
Health Insurance - People covered by health insurance (%)
Kidney Conditions-Urology - Avg. # of times urinating at night
Medical Conditions - People with asthma (%)
Medical Conditions - People with anemia (%)
Medical Conditions - People with psoriasis (%)
Medical Conditions - People with overweight (%)
Medical Conditions - Elderly people having difficulties in thinking or remembering (%)
Medical Conditions - People who ever received blood transfusion (%)
Medical Conditions - People having trouble seeing even with glass/contacts (%)
Medical Conditions - People with arthritis (%)
Medical Conditions - People with gout (%)
Medical Conditions - People with congestive heart failure (%)
Medical Conditions - People with coronary heart disease (%)
Medical Conditions - People with angina pectoris (%)
Medical Conditions - People who ever had heart attack (%)
Medical Conditions - People who ever had stroke (%)
Medical Conditions - People with emphysema (%)
Medical Conditions - People with thyroid problem (%)
Medical Conditions - People with chronic bronchitis (%)
Medical Conditions - People with any liver condition (%)
Medical Conditions - People who ever had cancer or malignancy (%)
Mental Health - People who have little interest in doing things (%)
Mental Health - People feeling down, depressed, or hopeless (%)
Mental Health - People who have trouble sleeping or sleeping too much (%)
Mental Health - People feeling tired or having little energy (%)
Mental Health - People with poor appetite or overeating (%)
Mental Health - People feeling bad about themself (%)
Mental Health - People who have trouble concentrating on things (%)
Mental Health - People moving or speaking slowly or too fast (%)
Mental Health - People having thoughts they would be better off dead (%)
Oral Health - Average years since last visit a dentist
Oral Health - People embarrassed because of mouth (%)
Oral Health - People with gum disease (%)
Oral Health - General health of teeth and gums (%)
Oral Health - Average days a week using dental floss/device
Oral Health - Average days a week using mouthwash for dental problem
Oral Health - Average number of teeth
Pesticide Use - Households using pesticides to control insects (%)
Pesticide Use - Households using pesticides to kill weeds (%)
Physical Activity - People doing vigorous-intensity work activities (%)
Physical Activity - People doing moderate-intensity work activities (%)
Physical Activity - People walking or bicycling (%)
Physical Activity - People doing vigorous-intensity recreational activities (%)
Physical Activity - People doing moderate-intensity recreational activities (%)
Physical Activity - Average hours a day doing sedentary activities
Physical Activity - Average hours a day watching TV or videos
Physical Activity - Average hours a day using computer
Physical Functioning - People having limitations keeping them from working (%)
Physical Functioning - People limited in amount of work they can do (%)
Physical Functioning - People that need special equipment to walk (%)
Physical Functioning - People experiencing confusion/memory problems (%)
Physical Functioning - People requiring special healthcare equipment (%)
Prescription Medications - Average number of prescription medicines taking
Preventive Aspirin Use - Adults 40+ taking low-dose aspirin (%)
Reproductive Health - Vaginal deliveries (%)
Reproductive Health - Cesarean deliveries (%)
Reproductive Health - Deliveries resulted in a live birth (%)
Reproductive Health - Pregnancies resulted in a delivery (%)
Reproductive Health - Women breastfeeding newborns (%)
Reproductive Health - Women that had a hysterectomy (%)
Reproductive Health - Women that had both ovaries removed (%)
Reproductive Health - Women that have ever taken birth control pills (%)
Reproductive Health - Women taking birth control pills (%)
Reproductive Health - Women that have ever used Depo-Provera or injectables (%)
Reproductive Health - Women that have ever used female hormones (%)
Sexual Behavior - People 18+ that ever had sex (vaginal, anal, or oral) (%)
Sexual Behavior - Males 18+ that ever had vaginal sex with a woman (%)
Sexual Behavior - Males 18+ that ever performed oral sex on a woman (%)
Sexual Behavior - Males 18+ that ever had anal sex with a woman (%)
Sexual Behavior - Males 18+ that ever had any sex with a man (%)
Sexual Behavior - Females 18+ that ever had vaginal sex with a man (%)
Sexual Behavior - Females 18+ that ever performed oral sex on a man (%)
Sexual Behavior - Females 18+ that ever had anal sex with a man (%)
Sexual Behavior - Females 18+ that ever had any kind of sex with a woman (%)
Sexual Behavior - Average age people first had sex
Sexual Behavior - Average number of female sex partners in lifetime (males 18+)
Sexual Behavior - Average number of female vaginal sex partners in lifetime (males 18+)
Sexual Behavior - Average age people first performed oral sex on a woman (18+)
Sexual Behavior - Average number of woman performed oral sex on in lifetime (18+)
Sexual Behavior - Average number of male sex partners in lifetime (males 18+)
Sexual Behavior - Average number of male anal sex partners in lifetime (males 18+)
Sexual Behavior - Average age people first performed oral sex on a man (18+)
Sexual Behavior - Average number of male oral sex partners in lifetime (18+)
Sexual Behavior - People using protection when performing oral sex (%)
Sexual Behavior - Average number of times people have vaginal or anal sex a year
Sexual Behavior - People having sex without condom (%)
Sexual Behavior - Average number of male sex partners in lifetime (females 18+)
Sexual Behavior - Average number of male vaginal sex partners in lifetime (females 18+)
Sexual Behavior - Average number of female sex partners in lifetime (females 18+)
Sexual Behavior - Circumcised males 18+ (%)
Sleep Disorders - Average hours sleeping at night
Sleep Disorders - People that has trouble sleeping (%)
Smoking-Cigarette Use - People smoking cigarettes (%)
Taste & Smell - People 40+ having problems with smell (%)
Taste & Smell - People 40+ having problems with taste (%)
Taste & Smell - People 40+ that ever had wisdom teeth removed (%)
Taste & Smell - People 40+ that ever had tonsils teeth removed (%)
Taste & Smell - People 40+ that ever had a loss of consciousness because of a head injury (%)
Taste & Smell - People 40+ that ever had a broken nose or other serious injury to face or skull (%)
Taste & Smell - People 40+ that ever had two or more sinus infections (%)
Weight - Average height (inches)
Weight - Average weight (pounds)
Weight - Average BMI
Weight - People that are obese (%)
Weight - People that ever were obese (%)
Weight - People trying to lose weight (%)
Urban population: 9,686
Rural population: 1,292
Estimated median house/condo value in 2022: $173,731
62010:
$173,731Illinois:
$251,600
According to our research of Illinois and other state lists, there were 12 registered sex offenders living in 62010 zip code as of April 25, 2024 . The ratio of all residents to sex offenders in zip code 62010 is 979 to 1.The ratio of registered sex offenders to all residents in this zip code is lower than the state average.
Median resident age: This zip code:
41.5 yearsIllinois median age:
39.1 years
Average household size: This zip code:
2.4 peopleIllinois:
2.4 people
Averages for the 2020 tax year for zip code 62010, filed in 2021:
Average Adjusted Gross Income (AGI) in 2020: $65,220 (Individual Income Tax Returns) Here:
$65,220State:
$82,626
Salary/wage: $58,565 (reported on 79.1% of returns )Here:
$58,565State:
$66,640
(% of AGI for various income ranges: 1080.4% for AGIs below $25k , 3316.2% for AGIs $25k-50k , 5920.7% for AGIs $50k-75k , 8921.0% for AGIs $75k-100k , 15273.9% for AGIs $100k-200k , 48232.9% for AGIs over 200k ) Taxable interest for individuals: $1,040 (reported on 31.3% of returns )This zip code:
$1,040Illinois:
$2,376
(% of AGI for various income ranges: 20.3% for AGIs below $25k , 24.6% for AGIs $25k-50k , 44.2% for AGIs $50k-75k , 72.9% for AGIs $75k-100k , 90.0% for AGIs $100k-200k , 188.6% for AGIs over 200k ) Ordinary dividends: $3,205 (reported on 20.0% of returns )(% of AGI for various income ranges: 21.3% for AGIs below $25k , 33.9% for AGIs $25k-50k , 88.8% for AGIs $50k-75k , 163.3% for AGIs $75k-100k , 177.8% for AGIs $100k-200k , 744.3% for AGIs over 200k ) Net capital gain/loss in AGI: +$8,107 (reported on 16.5% of returns )Here:
+$8,107State:
+$31,684
(% of AGI for various income ranges: 7.6% for AGIs below $25k , 18.5% for AGIs $25k-50k , 90.0% for AGIs $50k-75k , 79.0% for AGIs $75k-100k , 265.7% for AGIs $100k-200k , 6282.9% for AGIs over 200k ) Profit/loss from business: +$13,736 (reported on 10.8% of returns )Here:
+$13,736State:
+$12,175
(% of AGI for various income ranges: 70.1% for AGIs below $25k , 57.5% for AGIs $25k-50k , 133.9% for AGIs $50k-75k , 156.4% for AGIs $75k-100k , 409.1% for AGIs $100k-200k , 3628.6% for AGIs over 200k ) Taxable individual retirement arrangement distribution: $18,238 (reported on 11.9% of returns )62010:
$18,238Illinois:
$21,613
(% of AGI for various income ranges: 65.6% for AGIs below $25k , 134.8% for AGIs $25k-50k , 233.7% for AGIs $50k-75k , 365.0% for AGIs $75k-100k , 790.6% for AGIs $100k-200k , 2252.9% for AGIs over 200k ) Total itemized deductions: $28,329 (reported on 4.4% of returns )Here:
$28,329State:
$34,948
(% of AGI for various income ranges: 75.4% for AGIs below $25k , 153.9% for AGIs $50k-75k , 210.0% for AGIs $75k-100k , 380.3% for AGIs $100k-200k , 2278.6% for AGIs over 200k ) Charity contributions: $10,879 (reported on 3.5% of returns )Here:
$10,879State:
$13,122
(% of AGI for various income ranges: 6.5% for AGIs below $25k , 27.0% for AGIs $50k-75k , 48.3% for AGIs $75k-100k , 136.4% for AGIs $100k-200k , 1027.1% for AGIs over 200k ) Taxes paid: $7,454 (reported on 4.4% of returns )(% of AGI for various income ranges: 11.6% for AGIs below $25k , 29.8% for AGIs $50k-75k , 60.5% for AGIs $75k-100k , 118.2% for AGIs $100k-200k , 621.4% for AGIs over 200k ) Earned income credit: $1,969 (reported on 11.7% of returns )(% of AGI for various income ranges: 65.7% for AGIs below $25k , 48.3% for AGIs $25k-50k ) Percentage of individuals using paid preparers for their 2020 taxes: 95.8%(% for various income ranges: 94.5% for AGIs below $25k , 96.0% for AGIs $25k-50k , 97.4% for AGIs $50k-75k , 96.7% for AGIs $75k-100k , 95.1% for AGIs $100k-200k , 100.0% for AGIs over 200k )
Averages for the 2012 tax year for zip code 62010, filed in 2013:
Average Adjusted Gross Income (AGI) in 2012: $54,487 (Individual Income Tax Returns) Here:
$54,487State:
$68,058
Salary/wage: $49,016 (reported on 82.0% of returns )Here:
$49,016State:
$55,396
(% of AGI for various income ranges: 69.9% for AGIs below $25k , 70.4% for AGIs $25k-50k , 73.2% for AGIs $50k-75k , 77.0% for AGIs $75k-100k , 80.1% for AGIs $100k-200k , 57.8% for AGIs over 200k ) Taxable interest for individuals: $1,086 (reported on 39.1% of returns )This zip code:
$1,086Illinois:
$1,969
(% of AGI for various income ranges: 1.6% for AGIs below $25k , 0.9% for AGIs $25k-50k , 1.0% for AGIs $50k-75k , 0.5% for AGIs $75k-100k , 0.6% for AGIs $100k-200k , 0.6% for AGIs over 200k ) Ordinary dividends: $2,499 (reported on 20.9% of returns )(% of AGI for various income ranges: 1.4% for AGIs below $25k , 1.2% for AGIs $25k-50k , 1.0% for AGIs $50k-75k , 0.7% for AGIs $75k-100k , 0.9% for AGIs $100k-200k , 0.9% for AGIs over 200k ) Net capital gain/loss in AGI: +$4,532 (reported on 15.0% of returns )Here:
+$4,532State:
+$22,183
(% of AGI for various income ranges: 0.5% for AGIs $50k-75k , 0.1% for AGIs $75k-100k , 0.7% for AGIs $100k-200k , 8.7% for AGIs over 200k ) Profit/loss from business: +$9,203 (reported on 11.0% of returns )Here:
+$9,203State:
+$12,903
(% of AGI for various income ranges: 4.1% for AGIs below $25k , 2.2% for AGIs $25k-50k , 1.4% for AGIs $50k-75k , 1.6% for AGIs $75k-100k , 2.1% for AGIs $100k-200k ) Taxable individual retirement arrangement distribution: $11,202 (reported on 12.3% of returns )62010:
$11,202Illinois:
$17,929
(% of AGI for various income ranges: 3.2% for AGIs below $25k , 3.0% for AGIs $25k-50k , 3.0% for AGIs $50k-75k , 2.5% for AGIs $75k-100k , 2.4% for AGIs $100k-200k , 0.9% for AGIs over 200k ) Total itemized deductions: $18,739 (20% of AGI, reported on 32.8% of returns )Here:
$18,739State:
$26,433
Here:
19.6% of AGIState:
19.2% of AGI
(% of AGI for various income ranges: 8.7% for AGIs below $25k , 8.7% for AGIs $25k-50k , 10.8% for AGIs $50k-75k , 11.4% for AGIs $75k-100k , 13.6% for AGIs $100k-200k , 10.7% for AGIs over 200k ) Charity contributions: $3,711 (reported on 24.3% of returns )(% of AGI for various income ranges: 0.6% for AGIs below $25k , 1.1% for AGIs $25k-50k , 1.3% for AGIs $50k-75k , 1.5% for AGIs $75k-100k , 2.1% for AGIs $100k-200k , 2.5% for AGIs over 200k ) Taxes paid: $7,974 (reported on 32.6% of returns )62010:
$7,974State:
$11,968
(% of AGI for various income ranges: 1.6% for AGIs below $25k , 2.6% for AGIs $25k-50k , 3.9% for AGIs $50k-75k , 4.8% for AGIs $75k-100k , 6.6% for AGIs $100k-200k , 6.0% for AGIs over 200k ) Earned income credit: $2,096 (reported on 13.9% of returns )(% of AGI for various income ranges: 4.8% for AGIs below $25k , 0.9% for AGIs $25k-50k ) Percentage of individuals using paid preparers for their 2012 taxes: 59.6%(% for various income ranges: 51.5% for AGIs below $25k , 57.4% for AGIs $25k-50k , 68.4% for AGIs $50k-75k , 62.1% for AGIs $75k-100k , 70.0% for AGIs $100k-200k , 88.9% for AGIs over 200k )
Averages for the 2004 tax year for zip code 62010, filed in 2005:
Average Adjusted Gross Income (AGI) in 2004: $42,989 (Individual Income Tax Returns) Here:
$42,989State:
$54,625
Salary/wage: $40,318 (reported on 83.5% of returns )Here:
$40,318State:
$46,811
(% of AGI for various income ranges: 116.1% for AGIs below $10k , 65.9% for AGIs $10k-25k , 77.5% for AGIs $25k-50k , 79.4% for AGIs $50k-75k , 86.1% for AGIs $75k-100k , 73.8% for AGIs over 100k ) Taxable interest for individuals: $1,246 (reported on 48.7% of returns )This zip code:
$1,246Illinois:
$2,101
(% of AGI for various income ranges: 7.5% for AGIs below $10k , 3.6% for AGIs $10k-25k , 1.5% for AGIs $25k-50k , 1.1% for AGIs $50k-75k , 0.8% for AGIs $75k-100k , 0.9% for AGIs over 100k ) Taxable dividends: $1,523 (reported on 23.8% of returns )(% of AGI for various income ranges: 3.9% for AGIs below $10k , 1.9% for AGIs $10k-25k , 0.9% for AGIs $25k-50k , 0.8% for AGIs $50k-75k , 0.2% for AGIs $75k-100k , 0.8% for AGIs over 100k ) Net capital gain/loss: +$3,166 (reported on 16.9% of returns )Here:
+$3,166State:
+$17,321
(% of AGI for various income ranges: -3.8% for AGIs below $10k , -0.1% for AGIs $10k-25k , 0.2% for AGIs $25k-50k , 0.9% for AGIs $50k-75k , 0.6% for AGIs $75k-100k , 3.6% for AGIs over 100k ) Profit/loss from business: +$10,821 (reported on 11.6% of returns )Here:
+$10,821State:
+$11,771
(% of AGI for various income ranges: 3.3% for AGIs below $10k , 3.4% for AGIs $10k-25k , 2.7% for AGIs $25k-50k , 2.6% for AGIs $50k-75k , 0.9% for AGIs $75k-100k , 4.6% for AGIs over 100k ) IRA payment deduction: $3,160 (reported on 2.1% of returns )62010:
$3,160Illinois:
$3,087
(% of AGI for various income ranges: 0.2% for AGIs $10k-25k , 0.3% for AGIs $25k-50k , 0.2% for AGIs $50k-75k , 0.1% for AGIs $75k-100k , 0.1% for AGIs over 100k ) Self-employed pension: $12,826 (reported on 0.4% of returns )Here:
$12,826Illinois:
$16,965
Total itemized deductions: $15,562 (21% of AGI, reported on 31.0% of returns )Here:
$15,562State:
$20,239
Here:
20.6% of AGIState:
19.5% of AGI
(% of AGI for various income ranges: 11.6% for AGIs below $10k , 8.0% for AGIs $10k-25k , 8.5% for AGIs $25k-50k , 11.6% for AGIs $50k-75k , 11.5% for AGIs $75k-100k , 13.7% for AGIs over 100k ) Charity contributions deductions: $3,204 (4% of AGI, reported on 26.1% of returns )Here:
4.0% of AGIState:
3.4% of AGI
(% of AGI for various income ranges: 0.9% for AGIs below $10k , 0.8% for AGIs $10k-25k , 1.2% for AGIs $25k-50k , 2.0% for AGIs $50k-75k , 1.6% for AGIs $75k-100k , 3.1% for AGIs over 100k ) Total tax: $5,615 (reported on 77.7% of returns )(% of AGI for various income ranges: 2.6% for AGIs below $10k , 4.0% for AGIs $10k-25k , 7.2% for AGIs $25k-50k , 8.9% for AGIs $50k-75k , 10.2% for AGIs $75k-100k , 15.8% for AGIs over 100k ) Earned income credit: $1,640 (reported on 11.5% of returns )Percentage of individuals using paid preparers for their 2004 taxes: 64.0%(% for various income ranges: 51.8% for AGIs below $10k , 64.6% for AGIs $10k-25k , 66.3% for AGIs $25k-50k , 70.2% for AGIs $50k-75k , 66.0% for AGIs $75k-100k , 71.3% for AGIs over 100k )
Estimated median household income in 2022: This zip code:
$68,942Illinois:
$76,708
Nearest zip codes: 62018 ,
62024 ,
62067 ,
62095 ,
62002 ,
62084 .
Wood River Zip Code Map
Percentage of family households: This zip code:
46.2%Illinois:
44.2%
Percentage of households with unmarried partners: This zip code:
11.1%Illinois:
45.1%
Likely homosexual households (counted as self-reported same-sex unmarried-partner households)
Lesbian couples: 0.2% of all households Gay men: 0.0% of all households
Household received Food Stamps/SNAP in the past 12 months: 562Household did not receive Food Stamps/SNAP in the past 12 months: 4,058
Women who had a birth in the past 12 months: 156 (101 now married , 54 unmarried) Women who did not have a birth in the past 12 months: 2,131 (1,113 now married , 1,008 unmarried)
Housing units in zip code 62010 with a mortgage: 2,304 (140
second mortgage , 104
both second mortgage and home equity loan )
Houses without a mortgage: 55
Median monthly owner costs for units with a mortgage: $1,363
Median monthly owner costs for units without a mortgage: $670
Residents with income below the poverty level in 2022:
This zip code:
10.5%Whole state:
11.9%
Residents with income below 50% of the poverty level in 2022:
This zip code:
3.7%Whole state:
5.7%
Median number of rooms in houses and condos: Median number of rooms in apartments: Notable locations in this zip code not listed on our city pages
Click to draw/clear zip code borders Notable locations in zip code 62010: (A) , Bethalto City Hall (B) , Fosterburg Fire Protection District Station 1 (C) , Meadowbrook Volunteer Fire Department (D) , Saint Louis Regional Airport Fire Department (E) , Bethalto Fire Department (F) . Display/hide their locations on the map
Shopping Center: (1) . Display/hide its location on the map
Cemeteries: (1) , Rose Lawn Memory Gardens (2) , Montgomery Family Cemetery (3) , Preuitt Family Cemetery (4) . Display/hide their locations on the map
Parks in zip code 62010 include: (1) , Khoury League Park (2) , Belk Park (3) . Display/hide their locations on the map
Year house built (houses)
27 2020 or later329 2010 to 2019633 2000 to 2009451 1990 to 1999892 1980 to 1989871 1970 to 1979739 1960 to 1969613 1950 to 1959344 1940 to 1949203 1939 or earlier
Zip code 62010 household income distribution in 2022 131 Less than $10,000161 $10,000 to $14,99972 $15,000 to $19,999226 $20,000 to $24,999186 $25,000 to $29,99990 $30,000 to $34,999166 $35,000 to $39,999293 $40,000 to $44,999125 $45,000 to $49,999349 $50,000 to $59,999735 $60,000 to $74,999674 $75,000 to $99,999445 $100,000 to $124,999305 $125,000 to $149,999419 $150,000 to $199,999265 $200,000 or moreEstimate of home value of owner-occupied houses/condos in 2022 in zip code 62010 4 Less than $10,0006 $10,000 to $14,99918 $15,000 to $19,9999 $25,000 to $29,99974 $50,000 to $59,99913 $60,000 to $69,999156 $70,000 to $79,999145 $80,000 to $89,999200 $90,000 to $99,999406 $100,000 to $124,999358 $125,000 to $149,999489 $150,000 to $174,999167 $175,000 to $199,999551 $200,000 to $249,999492 $250,000 to $299,999254 $300,000 to $399,999146 $400,000 to $499,99934 $500,000 to $749,999Rent paid by renters in 2022 in zip code 62010 44 $100 to $14913 $150 to $1997 $400 to $44934 $450 to $4998 $500 to $549110 $550 to $599105 $600 to $64990 $650 to $69952 $700 to $74913 $750 to $799187 $800 to $899103 $900 to $99931 $1,000 to $1,2494 $1,250 to $1,49936 $1,500 to $1,99949 $2,000 to $2,49950 No cash rent
Median gross rent in 2022: $899.
Estimated median house (or condo) value in 2022 for: White Non-Hispanic householders: $172,048American Indian or Alaska Native householders: $199,812Two or more races householders: $178,779Hispanic or Latino householders: $115,680Estimated median house or condo value in 2022: $173,731
62010:
$173,731Illinois:
$251,600
Lower value quartile - upper value quartile: $117,954 - $251,508
Mean price in 2022: Detached houses: $233,185Here:
$233,185State:
$310,164
Townhouses or other attached units: $152,809Here:
$152,809State:
$286,230
In 2-unit structures: $143,175Here:
$143,175State:
$299,638
In 3-to-4-unit structures: $91,138Here:
$91,138State:
$330,907
In 5-or-more-unit structures: $72,788Here:
$72,788State:
$318,887
Mobile homes: $39,452Here:
$39,452State:
$78,855
Housing units in structures:
One, detached: 4,084One, attached: 100Two: 1023 or 4: 2615 to 9: 24010 to 19: 2450 or more: 183Mobile homes: 59Unemployment : 5.1%
Means of transportation to work in zip code 62010 82.3% 4,270 Drove a car alone3.0% 157 Carpooled1.0% 51 Bus or trolley bus1.6% 84 Walked1.1% 56 Other means10.2% 530 Worked at homeTravel time to work (commute) in zip code 62010 145 Less than 5 minutes462 5 to 9 minutes466 10 to 14 minutes586 15 to 19 minutes865 20 to 24 minutes373 25 to 29 minutes387 30 to 34 minutes418 35 to 39 minutes214 40 to 44 minutes425 45 to 59 minutes197 60 to 89 minutes35 90 or more minutes
Percentage of zip code residents living and working in this county: 71.3%
Household type by relationship:
Households: 10,979
Male householders: 2,347 (444 living alone ), Female householders: 2,285 (703 living alone )2,522 spouses (2,498 opposite-sex spouses ), 511 unmarried partners , (511 opposite-sex unmarried partners ), 2,930 children (2,632 natural , 98 adopted , 204 stepchildren ), 87 grandchildren , 104 brothers or sisters , 41 parents , 30 foster children , 74 other relatives , 61 non-relatives In group quarters: 62 (-1 institutionalized population )
Size of family households: 1,446 2-persons , 867 3-persons , 667 4-persons , 145 5-persons , 14 6-persons , 30 7-or-more-persons
Size of nonfamily households: 1,144 1-person , 256 2-persons , 47 3-persons , 16 4-persons
1,704 married couples with children. single-parent households (142 men , 447 women ).
99.3% of residents of 62010 zip code speak English at home. of residents speak Spanish at home (87% very well, 13% well ).of residents speak Asian or Pacific Island language at home (100% well ).
Foreign born population: 22 (0.2%)
(100.0%
of them are naturalized citizens )
This zip code:
0.2%Whole state:
14.4%
45% Eritrea 32% Thailand 9% Honduras 25% German 24% American 11% English 10% Irish 4% Italian 2% Northern European 2% European
Year of entry for the foreign-born population
12 2010 or later 0 2000 to 2009 8 1990 to 1999 27 Before 1990
Facilities with environmental interests located in this zip code:
ILLINOIS POWER CO (960 E. AIRLINE DRIVE in BETHALTO, IL)
STATE MASTER (Illinois EPA Project) - AIR PROGRAM, HAZARDOUS WASTE PROGRAM, SOLID WASTE PROGRAM AIR MINOR (AIRS/AFS) CRITERIA AND HAZARDOUS AIR POLLUTANT INVENTORY (Inventory of air pollution sources) Business SIC classification: ELECTRIC AND OTHER SERVICES COMBINEDAlternative names: ILLINOIS POWER COMPANY RIVER BEND SERV AREA
ROSELAWN MEMORY GARDENS INC (10 ERWIN PLEGGE BLVD. in BETHALTO, IL)
STATE MASTER (Illinois EPA Project) - AIR PROGRAM AIR MINOR (AIRS/AFS) CRITERIA AND HAZARDOUS AIR POLLUTANT INVENTORY (Inventory of air pollution sources) Business SIC classification: GENERAL INDUSTRIAL MACHINERY AND EQUIPMENT
JR DRY CLEANER (120 W BETHALTO BLVD in BETHALTO, IL)
STATE MASTER (Illinois EPA Project) - HAZARDOUS WASTE PROGRAM Small Quantity Generators, between 100 kg and 1000 kg of hazardous waste/month (Resource Conservation and Recovery Act (tracking hazardous waste)) - notification Organizations: DURBIN JERRY (CONTACT/OWNER)
PAUL F BRUNE TRUST (601 BETHALTO in BETHALTO, IL)
STATE MASTER (Illinois EPA Project) - SOLID WASTE PROGRAM, HAZARDOUS WASTE PROGRAM Small Quantity Generators, between 100 kg and 1000 kg of hazardous waste/month (Resource Conservation and Recovery Act (tracking hazardous waste)) - notification Organizations: BRUNE PAUL F TRUST (CONTACT/OWNER)
Alternative names: BRUNE PAUL F TRUST
CIVIC MEMORIAL HIGH SCHOOL (200 SCHOOL ST in BETHALTO, IL)
(Geographic Names Information System) (National Center for Education Statistics) - STATE ID-4105700800001 Organizations: BETHALTO C U SCHOOL DIST 8 (SCHOOL DISTRICT)
PARKSIDE ELEMENTARY (600 EAST CENTRAL in BETHALTO, IL)
(National Center for Education Statistics) - STATE ID-4105700802009 Organizations: BETHALTO C U SCHOOL DIST 8 (SCHOOL DISTRICT)
REXING TRUCKING?NORMAN E. (4166 RUSH LANE in BETHALTO, IL)
National Pollutant Discharge Elimination System NON-MAJOR (Tracking pollutant discharge elimination systems) - permit Alternative names: REXING, NORMAN E. TRUCKING
OUR LADY QUEEN OF PEACE (618 N PRAIRIE ST in BETHALTO, IL)
COMPLIANCE ACTIVITY (Tracking inspections of insecticide, fungicide, and rodenticide, and toxic substances)
Housing units lacking complete plumbing facilities: 2.9%
Housing units lacking complete kitchen facilities: 5.2%
56.3% Utility gas 38.3% Electricity 4.9% Bottled, tank, or LP gas
Population in 1990: 10,587. Population change in the 1990s: +61 (+0.6%).
Place of birth for U.S.-born residents:
This state: 8,415Northeast: 78Midwest: 1,687South: 509West: 209
58% of the 62010 zip code residents lived in the same house 5 years ago.
Out of people who lived in different houses, 78% lived in this county.
Out of people who lived in different counties, 50% lived in Illinois.
91% of the 62010 zip code residents lived in the same house 1 year ago.
Out of people who lived in different houses, 79% moved from this county.
Out of people who lived in different houses, 17% moved from different state.
Private vs. public school enrollment:
Students in private schools in grades 1 to 8 (elementary and middle school): 86
Students in private schools in grades 9 to 12 (high school): 21
Students in private undergraduate colleges: 21
Occupation by median earnings in the past 12 months ($)
85,535 Architecture and engineering occupations 84,266 Management occupations 81,479 Construction and extraction occupations 79,265 Business and financial operations occupations 64,568 Installation, maintenance, and repair occupations 60,743 Production occupations
Top industries in this zip code by the number of employees in 2005:
Accommodation and Food Services: Limited-Service Restaurants (100-249 employees: 1 establishment, 20-49 employees: 4 establishments, 10-19 employees: 6 establishments)Health Care and Social Assistance: Nursing Care Facilities (100-249: 1)Other Services (except Public Administration): Religious Organizations (50-99: 1, 20-49: 1, 5-9: 4, 1-4: 5)Accommodation and Food Services: Full-Service Restaurants (50-99: 1, 20-49: 1, 10-19: 2, 1-4: 1)Construction: Plumbing, Heating, and Air-Conditioning Contractors (50-99: 1, 5-9: 2, 1-4: 2)Wholesale Trade: Other Electronic Parts and Equipment Merchant Wholesalers (50-99: 1)Finance and Insurance: Commercial Banking (20-49: 1, 10-19: 1, 5-9: 1)
People in group quarters in 2010:
92 people in nursing facilities/skilled-nursing facilities
People in group quarters in 2000:
94 people in nursing homes
Fatal accident statistics in 2013:
Fatal accident count: 2Vehicles involved in fatal accidents: 3Fatal accidents caused by drunken drivers: 0Fatalities: 2Persons involved in fatal accidents: 8Pedestrians involved in fatal accidents: 0
Home Mortgage Disclosure Act Aggregated Statistics For Year 2009(Based on 2 full and 10 partial tracts) A) FHA, FSA/RHS & VA B) Conventional C) Refinancings D) Home Improvement Loans E) Loans on Dwellings For 5+ Families F) Non-occupant Loans on G) Loans On Manufactured Number Average Value Number Average Value Number Average Value Number Average Value Number Average Value Number Average Value Number Average Value
LOANS ORIGINATED 132 $110,714 126 $117,384 754 $129,237 49 $35,478 2 $139,930 51 $101,465 2 $30,180 APPLICATIONS APPROVED, NOT ACCEPTED 4 $117,645 7 $134,379 42 $123,725 8 $14,010 0 $0 1 $52,200 0 $0 APPLICATIONS DENIED 10 $130,020 7 $96,603 118 $122,768 26 $34,135 0 $0 5 $73,644 2 $39,355 APPLICATIONS WITHDRAWN 7 $131,376 15 $106,416 100 $121,987 5 $42,024 0 $0 7 $82,017 0 $0 FILES CLOSED FOR INCOMPLETENESS 0 $0 0 $0 15 $134,979 1 $59,320 0 $0 0 $0 0 $0
Aggregated Statistics For Year 2008(Based on 2 full and 10 partial tracts) A) FHA, FSA/RHS & VA B) Conventional C) Refinancings D) Home Improvement Loans E) Loans on Dwellings For 5+ Families F) Non-occupant Loans on G) Loans On Manufactured Number Average Value Number Average Value Number Average Value Number Average Value Number Average Value Number Average Value Number Average Value
LOANS ORIGINATED 85 $121,174 158 $128,379 448 $128,029 34 $29,284 10 $241,422 77 $135,169 0 $0 APPLICATIONS APPROVED, NOT ACCEPTED 8 $107,734 17 $127,676 50 $116,540 5 $37,474 0 $0 8 $77,620 2 $59,740 APPLICATIONS DENIED 7 $94,107 20 $116,896 140 $116,310 43 $55,311 0 $0 10 $80,421 1 $30,660 APPLICATIONS WITHDRAWN 11 $155,606 20 $101,692 89 $119,482 13 $73,740 3 $341,503 4 $77,992 0 $0 FILES CLOSED FOR INCOMPLETENESS 2 $90,140 0 $0 21 $114,943 1 $43,420 0 $0 0 $0 0 $0
Aggregated Statistics For Year 2007(Based on 2 full and 10 partial tracts) A) FHA, FSA/RHS & VA B) Conventional C) Refinancings D) Home Improvement Loans E) Loans on Dwellings For 5+ Families F) Non-occupant Loans on G) Loans On Manufactured Number Average Value Number Average Value Number Average Value Number Average Value Number Average Value Number Average Value Number Average Value
LOANS ORIGINATED 33 $102,148 315 $111,836 414 $110,415 99 $39,054 4 $252,872 71 $94,893 0 $0 APPLICATIONS APPROVED, NOT ACCEPTED 2 $117,750 22 $116,387 54 $122,925 20 $46,920 0 $0 2 $101,890 0 $0 APPLICATIONS DENIED 4 $123,215 67 $109,574 262 $120,057 58 $51,878 0 $0 9 $65,569 2 $20,120 APPLICATIONS WITHDRAWN 8 $77,865 35 $114,973 102 $110,835 14 $76,819 0 $0 5 $86,610 0 $0 FILES CLOSED FOR INCOMPLETENESS 1 $100,150 4 $118,495 25 $129,326 4 $22,888 0 $0 2 $72,735 0 $0
Aggregated Statistics For Year 2006(Based on 2 full and 10 partial tracts) A) FHA, FSA/RHS & VA B) Conventional C) Refinancings D) Home Improvement Loans E) Loans on Dwellings For 5+ Families F) Non-occupant Loans on G) Loans On Manufactured Number Average Value Number Average Value Number Average Value Number Average Value Number Average Value Number Average Value Number Average Value
LOANS ORIGINATED 32 $105,902 379 $99,756 451 $104,692 67 $44,109 2 $156,820 64 $77,463 1 $118,190 APPLICATIONS APPROVED, NOT ACCEPTED 0 $0 32 $127,026 69 $114,157 11 $45,610 0 $0 6 $109,605 5 $79,608 APPLICATIONS DENIED 8 $107,861 83 $99,587 229 $107,150 47 $65,030 0 $0 5 $69,652 8 $95,166 APPLICATIONS WITHDRAWN 1 $146,340 31 $108,622 137 $128,397 12 $97,899 0 $0 7 $112,857 1 $13,110 FILES CLOSED FOR INCOMPLETENESS 0 $0 10 $111,796 25 $113,049 4 $127,365 0 $0 2 $49,645 0 $0
Aggregated Statistics For Year 2005(Based on 2 full and 10 partial tracts) A) FHA, FSA/RHS & VA B) Conventional C) Refinancings D) Home Improvement Loans E) Loans on Dwellings For 5+ Families F) Non-occupant Loans on G) Loans On Manufactured Number Average Value Number Average Value Number Average Value Number Average Value Number Average Value Number Average Value Number Average Value
LOANS ORIGINATED 55 $109,721 349 $113,093 481 $113,473 70 $46,481 3 $120,713 61 $96,145 1 $32,380 APPLICATIONS APPROVED, NOT ACCEPTED 3 $72,753 35 $95,765 74 $100,175 13 $19,758 0 $0 3 $31,077 2 $44,920 APPLICATIONS DENIED 2 $98,310 89 $68,760 246 $110,981 53 $42,133 0 $0 15 $49,291 18 $40,904 APPLICATIONS WITHDRAWN 2 $86,665 35 $92,961 202 $115,555 25 $146,916 0 $0 8 $70,500 0 $0 FILES CLOSED FOR INCOMPLETENESS 0 $0 20 $59,234 40 $120,229 5 $56,848 0 $0 2 $15,475 0 $0
Aggregated Statistics For Year 2004(Based on 2 full and 10 partial tracts) A) FHA, FSA/RHS & VA B) Conventional C) Refinancings D) Home Improvement Loans E) Loans on Dwellings For 5+ Families F) Non-occupant Loans on G) Loans On Manufactured Number Average Value Number Average Value Number Average Value Number Average Value Number Average Value Number Average Value Number Average Value
LOANS ORIGINATED 59 $93,605 293 $101,093 542 $97,193 55 $34,618 2 $182,215 71 $76,365 4 $119,658 APPLICATIONS APPROVED, NOT ACCEPTED 1 $153,690 28 $90,131 80 $94,738 5 $87,696 0 $0 3 $44,880 3 $45,430 APPLICATIONS DENIED 12 $92,854 55 $69,264 215 $91,828 41 $25,103 0 $0 9 $87,216 19 $43,973 APPLICATIONS WITHDRAWN 4 $60,180 13 $88,541 166 $104,222 8 $13,166 0 $0 3 $84,700 0 $0 FILES CLOSED FOR INCOMPLETENESS 0 $0 10 $75,958 19 $101,438 2 $25,585 0 $0 0 $0 0 $0
Aggregated Statistics For Year 2003(Based on 2 full and 10 partial tracts) A) FHA, FSA/RHS & VA B) Conventional C) Refinancings D) Home Improvement Loans F) Non-occupant Loans on Number Average Value Number Average Value Number Average Value Number Average Value Number Average Value
LOANS ORIGINATED 77 $88,779 289 $107,273 1,262 $93,454 42 $23,642 102 $74,137 APPLICATIONS APPROVED, NOT ACCEPTED 7 $112,663 16 $110,211 126 $95,352 5 $41,806 1 $99,680 APPLICATIONS DENIED 11 $103,169 37 $84,718 272 $90,736 19 $52,014 17 $62,596 APPLICATIONS WITHDRAWN 1 $129,080 39 $86,669 171 $88,533 1 $22,280 2 $57,880 FILES CLOSED FOR INCOMPLETENESS 3 $106,220 5 $123,132 24 $82,144 0 $0 0 $0
Aggregated Statistics For Year 2002(Based on 8 partial tracts) A) FHA, FSA/RHS & VA B) Conventional C) Refinancings D) Home Improvement Loans F) Non-occupant Loans on Number Average Value Number Average Value Number Average Value Number Average Value Number Average Value
LOANS ORIGINATED 14 $97,308 70 $110,462 268 $111,401 13 $26,075 10 $97,155 APPLICATIONS APPROVED, NOT ACCEPTED 1 $135,250 4 $116,135 20 $111,936 3 $37,523 0 $0 APPLICATIONS DENIED 1 $105,640 8 $97,180 40 $96,976 5 $20,132 1 $83,590 APPLICATIONS WITHDRAWN 0 $0 6 $141,105 31 $107,152 0 $0 0 $0 FILES CLOSED FOR INCOMPLETENESS 1 $112,530 1 $126,610 6 $125,995 0 $0 0 $0
Aggregated Statistics For Year 2001(Based on 8 partial tracts) A) FHA, FSA/RHS & VA B) Conventional C) Refinancings D) Home Improvement Loans F) Non-occupant Loans on Number Average Value Number Average Value Number Average Value Number Average Value Number Average Value
LOANS ORIGINATED 12 $93,014 64 $110,082 219 $98,407 16 $29,281 13 $62,270 APPLICATIONS APPROVED, NOT ACCEPTED 0 $0 3 $99,910 20 $97,448 1 $28,400 0 $0 APPLICATIONS DENIED 1 $93,430 3 $99,790 49 $91,760 5 $11,340 0 $0 APPLICATIONS WITHDRAWN 0 $0 5 $111,346 23 $77,340 1 $65,080 1 $60,000 FILES CLOSED FOR INCOMPLETENESS 0 $0 1 $78,900 5 $112,650 0 $0 0 $0
Aggregated Statistics For Year 2000(Based on 8 partial tracts) A) FHA, FSA/RHS & VA B) Conventional C) Refinancings D) Home Improvement Loans F) Non-occupant Loans on Number Average Value Number Average Value Number Average Value Number Average Value Number Average Value
LOANS ORIGINATED 9 $90,001 70 $102,324 64 $84,929 18 $14,237 9 $72,782 APPLICATIONS APPROVED, NOT ACCEPTED 1 $107,370 6 $66,952 14 $80,074 2 $13,595 0 $0 APPLICATIONS DENIED 1 $146,610 10 $85,137 24 $79,070 9 $12,251 0 $0 APPLICATIONS WITHDRAWN 2 $107,325 6 $101,577 16 $72,933 2 $36,865 1 $96,710 FILES CLOSED FOR INCOMPLETENESS 0 $0 1 $89,870 3 $91,377 0 $0 0 $0
Aggregated Statistics For Year 1999(Based on 5 partial tracts) A) FHA, FSA/RHS & VA B) Conventional C) Refinancings D) Home Improvement Loans E) Loans on Dwellings For 5+ Families F) Non-occupant Loans on Number Average Value Number Average Value Number Average Value Number Average Value Number Average Value Number Average Value
LOANS ORIGINATED 38 $71,798 112 $73,427 218 $74,590 37 $14,930 1 $53,380 22 $48,118 APPLICATIONS APPROVED, NOT ACCEPTED 0 $0 9 $64,552 34 $68,081 8 $24,438 0 $0 1 $42,680 APPLICATIONS DENIED 2 $72,115 33 $48,903 81 $63,806 14 $20,706 1 $73,920 5 $45,158 APPLICATIONS WITHDRAWN 2 $66,925 9 $63,376 47 $63,003 9 $29,241 0 $0 0 $0 FILES CLOSED FOR INCOMPLETENESS 3 $43,177 2 $73,130 16 $62,501 0 $0 0 $0 0 $0
Private Mortgage Insurance Companies Aggregated Statistics For Year 2009(Based on 2 full and 10 partial tracts) A) Conventional B) Refinancings Number Average Value Number Average Value
LOANS ORIGINATED 33 $135,310 35 $158,708 APPLICATIONS APPROVED, NOT ACCEPTED 8 $142,028 6 $162,495 APPLICATIONS DENIED 1 $289,780 13 $128,927 APPLICATIONS WITHDRAWN 3 $120,513 14 $189,551 FILES CLOSED FOR INCOMPLETENESS 0 $0 2 $178,140
Aggregated Statistics For Year 2008(Based on 2 full and 10 partial tracts) A) Conventional B) Refinancings C) Non-occupant Loans on Number Average Value Number Average Value Number Average Value
LOANS ORIGINATED 71 $128,299 45 $159,410 1 $96,780 APPLICATIONS APPROVED, NOT ACCEPTED 9 $150,218 19 $135,014 0 $0 APPLICATIONS DENIED 6 $130,923 2 $190,920 0 $0 APPLICATIONS WITHDRAWN 7 $126,054 3 $140,170 0 $0 FILES CLOSED FOR INCOMPLETENESS 0 $0 0 $0 0 $0
Aggregated Statistics For Year 2007(Based on 2 full and 10 partial tracts) A) Conventional B) Refinancings C) Non-occupant Loans on Number Average Value Number Average Value Number Average Value
LOANS ORIGINATED 126 $119,822 43 $126,802 1 $163,130 APPLICATIONS APPROVED, NOT ACCEPTED 14 $98,728 12 $107,919 2 $90,985 APPLICATIONS DENIED 0 $0 2 $76,605 0 $0 APPLICATIONS WITHDRAWN 8 $99,909 3 $89,130 0 $0 FILES CLOSED FOR INCOMPLETENESS 0 $0 0 $0 0 $0
Aggregated Statistics For Year 2006(Based on 2 full and 10 partial tracts) A) Conventional B) Refinancings C) Non-occupant Loans on Number Average Value Number Average Value Number Average Value
LOANS ORIGINATED 91 $114,603 41 $119,744 4 $72,148 APPLICATIONS APPROVED, NOT ACCEPTED 8 $120,510 13 $113,145 2 $41,785 APPLICATIONS DENIED 2 $54,165 0 $0 0 $0 APPLICATIONS WITHDRAWN 9 $130,294 3 $172,403 2 $104,480 FILES CLOSED FOR INCOMPLETENESS 2 $99,045 0 $0 0 $0
Aggregated Statistics For Year 2005(Based on 2 full and 10 partial tracts) A) Conventional B) Refinancings C) Non-occupant Loans on Number Average Value Number Average Value Number Average Value
LOANS ORIGINATED 80 $107,277 66 $116,110 2 $55,715 APPLICATIONS APPROVED, NOT ACCEPTED 9 $133,853 14 $118,798 0 $0 APPLICATIONS DENIED 0 $0 0 $0 0 $0 APPLICATIONS WITHDRAWN 3 $79,960 5 $87,860 0 $0 FILES CLOSED FOR INCOMPLETENESS 0 $0 2 $58,035 0 $0
Aggregated Statistics For Year 2004(Based on 2 full and 10 partial tracts) A) Conventional B) Refinancings C) Non-occupant Loans on Number Average Value Number Average Value Number Average Value
LOANS ORIGINATED 62 $100,712 78 $107,091 7 $56,766 APPLICATIONS APPROVED, NOT ACCEPTED 8 $130,673 12 $129,250 0 $0 APPLICATIONS DENIED 0 $0 0 $0 0 $0 APPLICATIONS WITHDRAWN 5 $100,452 6 $128,122 0 $0 FILES CLOSED FOR INCOMPLETENESS 0 $0 0 $0 0 $0
Aggregated Statistics For Year 2003(Based on 2 full and 10 partial tracts) A) Conventional B) Refinancings C) Non-occupant Loans on Number Average Value Number Average Value Number Average Value
LOANS ORIGINATED 103 $99,058 125 $98,882 4 $68,958 APPLICATIONS APPROVED, NOT ACCEPTED 11 $100,198 32 $97,798 0 $0 APPLICATIONS DENIED 0 $0 0 $0 0 $0 APPLICATIONS WITHDRAWN 6 $91,175 13 $90,627 0 $0 FILES CLOSED FOR INCOMPLETENESS 2 $95,950 0 $0 0 $0
Aggregated Statistics For Year 2002(Based on 8 partial tracts) A) Conventional B) Refinancings Number Average Value Number Average Value
LOANS ORIGINATED 20 $112,789 22 $125,350 APPLICATIONS APPROVED, NOT ACCEPTED 2 $129,890 3 $159,693 APPLICATIONS DENIED 1 $89,820 0 $0 APPLICATIONS WITHDRAWN 0 $0 2 $105,060 FILES CLOSED FOR INCOMPLETENESS 0 $0 0 $0
Aggregated Statistics For Year 2001(Based on 8 partial tracts) A) Conventional B) Refinancings C) Non-occupant Loans on Number Average Value Number Average Value Number Average Value
LOANS ORIGINATED 13 $128,261 14 $118,357 1 $60,750 APPLICATIONS APPROVED, NOT ACCEPTED 2 $142,870 3 $123,067 0 $0 APPLICATIONS DENIED 0 $0 1 $132,100 0 $0 APPLICATIONS WITHDRAWN 0 $0 1 $128,440 0 $0 FILES CLOSED FOR INCOMPLETENESS 0 $0 0 $0 0 $0
Aggregated Statistics For Year 2000(Based on 8 partial tracts) A) Conventional B) Refinancings C) Non-occupant Loans on Number Average Value Number Average Value Number Average Value
LOANS ORIGINATED 16 $101,872 3 $164,917 1 $109,430 APPLICATIONS APPROVED, NOT ACCEPTED 2 $104,515 1 $85,300 1 $21,630 APPLICATIONS DENIED 0 $0 0 $0 0 $0 APPLICATIONS WITHDRAWN 1 $90,080 1 $86,540 0 $0 FILES CLOSED FOR INCOMPLETENESS 0 $0 0 $0 0 $0
Aggregated Statistics For Year 1999(Based on 5 partial tracts) A) Conventional B) Refinancings C) Non-occupant Loans on Number Average Value Number Average Value Number Average Value
LOANS ORIGINATED 34 $84,050 16 $97,818 2 $48,045 APPLICATIONS APPROVED, NOT ACCEPTED 5 $69,958 4 $86,475 0 $0 APPLICATIONS DENIED 2 $30,800 1 $93,300 0 $0 APPLICATIONS WITHDRAWN 0 $0 1 $150,470 0 $0 FILES CLOSED FOR INCOMPLETENESS 0 $0 0 $0 0 $0
2002 - 2018 National Fire Incident Reporting System (NFIRS) incidents See full 2006 National Fire Incident Reporting System statistics for zip code 62010, Illinois
Most common first names in zip code 62010 among deceased individuals Name Count Lived (average)
William 63 77.1 years Mary 62 79.3 years Charles 55 75.4 years John 54 73.9 years James 44 73.6 years Robert 40 68.2 years Helen 38 82.8 years George 37 78.1 years Dorothy 32 79.8 years Anna 28 84.4 years
Most common last names in zip code 62010 among deceased individuals Last name Count Lived (average)
Smith 22 74.2 years Davis 21 70.7 years Miller 20 75.3 years Johnson 20 76.4 years Williams 16 77.5 years Brown 14 79.6 years Cooper 13 80.1 years Martin 11 78.8 years King 10 73.3 years Moore 10 78.6 years
Businesses in zip code 62010
Name Count Name Count
Ace Hardware 1 MasterBrand Cabinets 4 Arby's 1 McDonald's 1 Burger King 1 Pizza Hut 1 Dairy Queen 1 Subway 1 Domino's Pizza 1 Taco Bell 1 FedEx 1 U-Haul 1 H&R Block 1 UPS 3 Jones New York 1 Walgreens 1 KFC 1
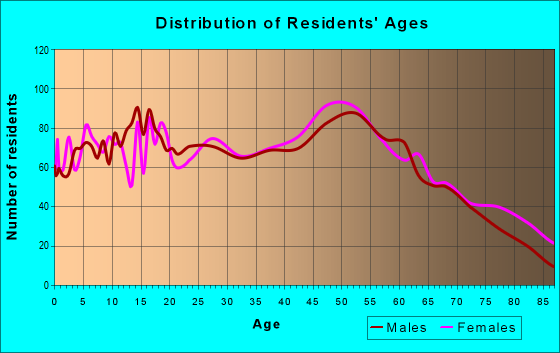
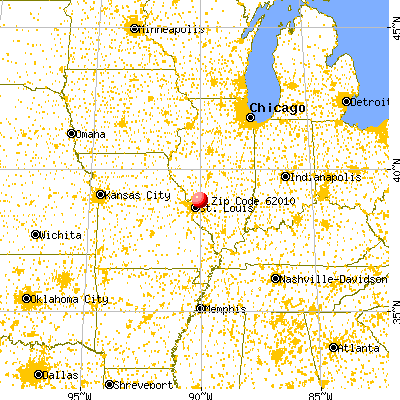


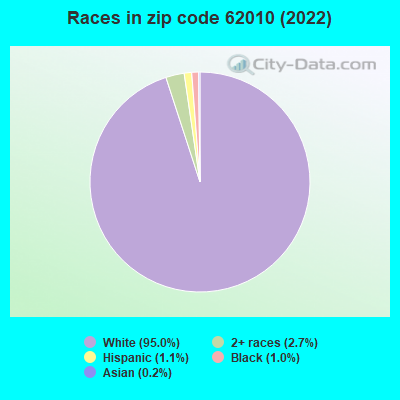


 Nearest zip codes: 62018, 62024, 62067, 62095, 62002, 62084.
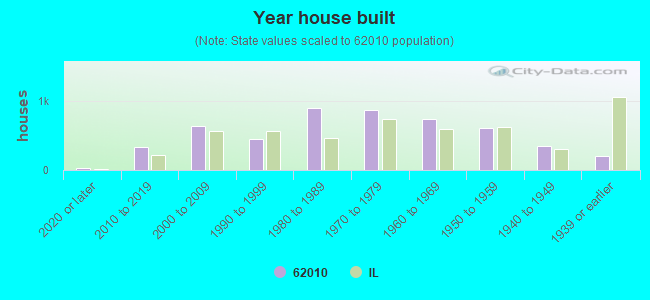


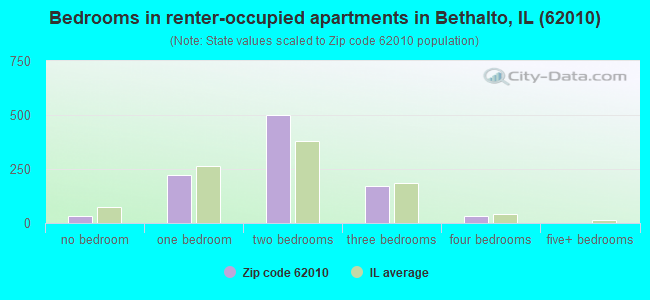
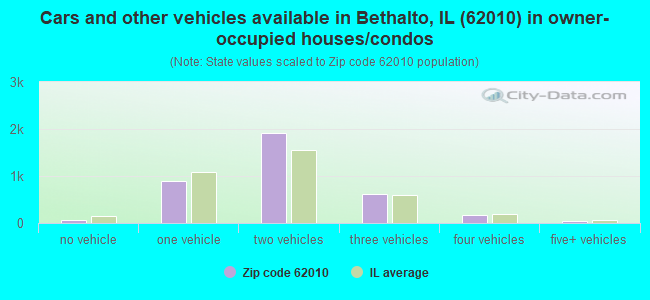
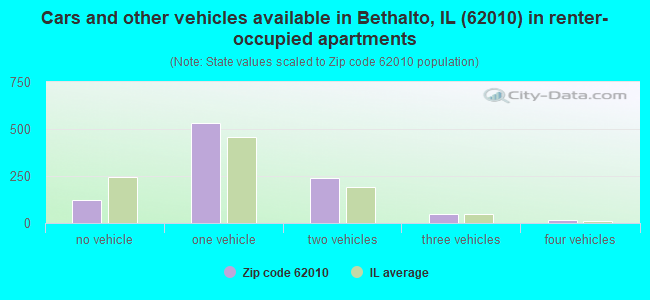


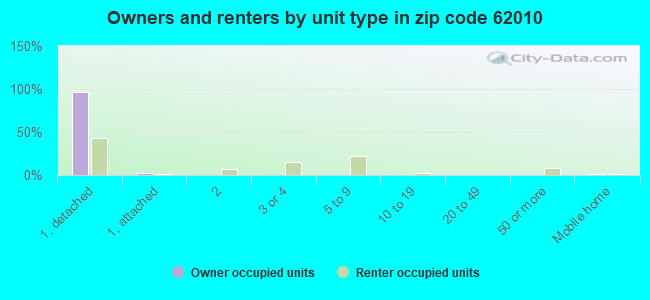
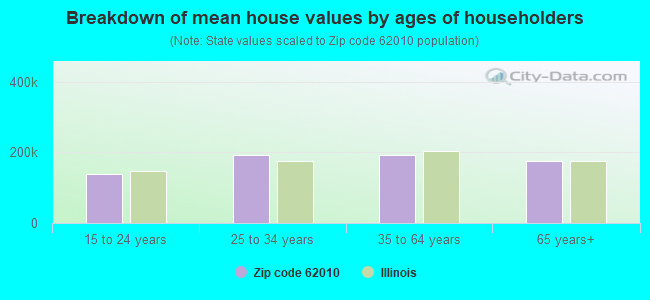


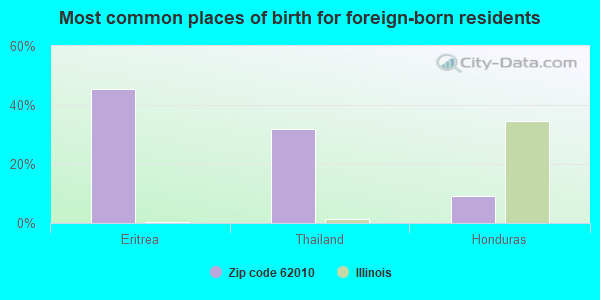
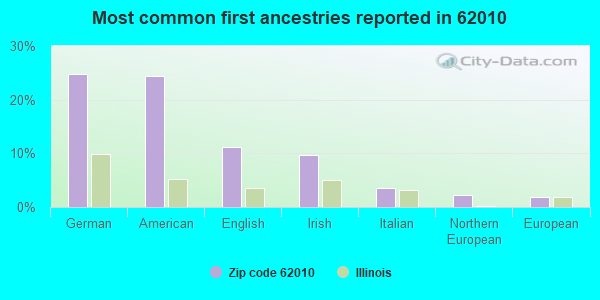
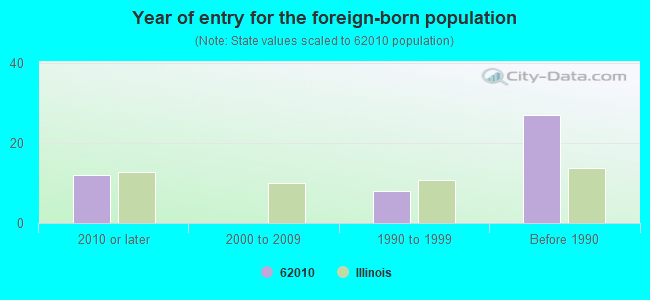


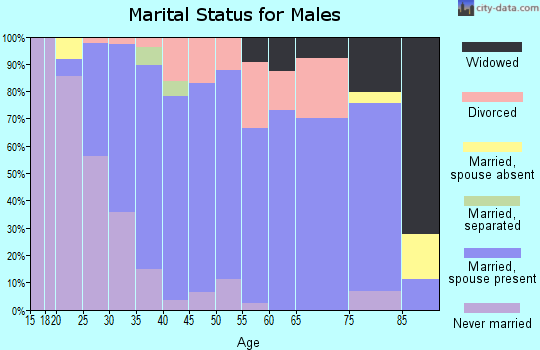
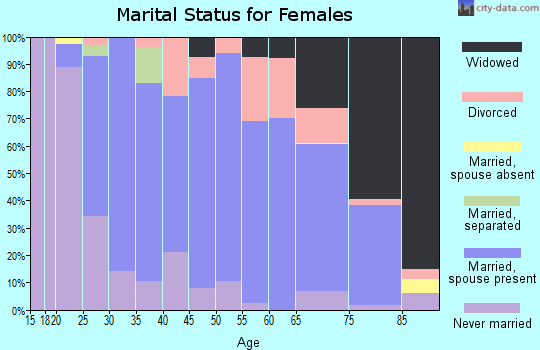
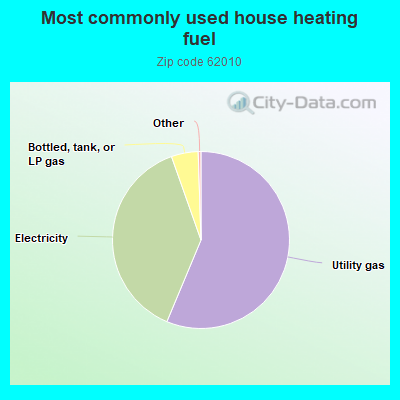
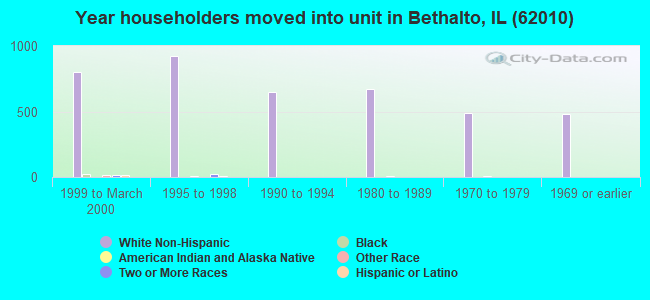
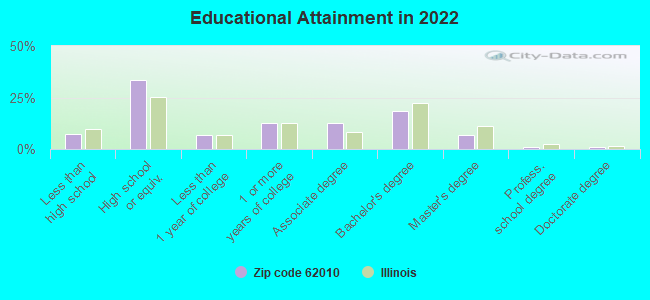
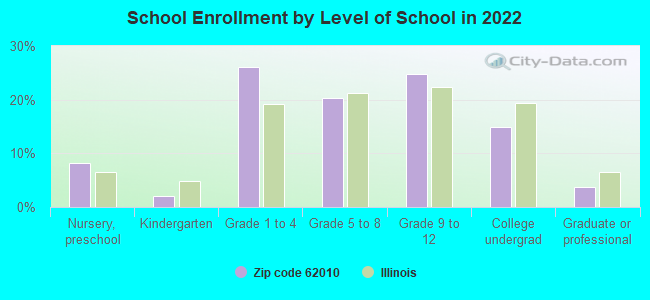
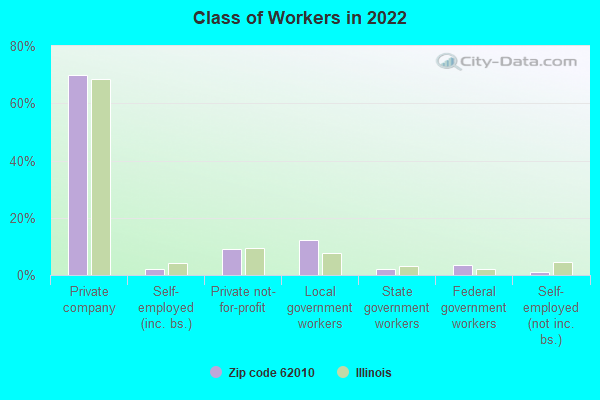
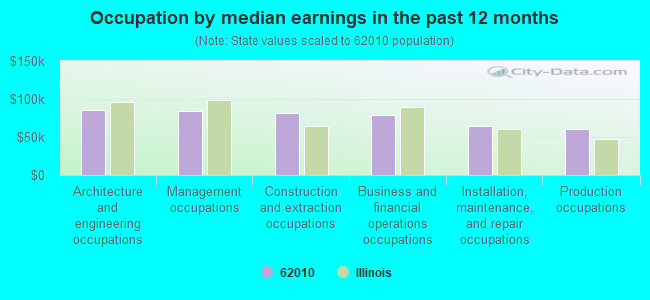
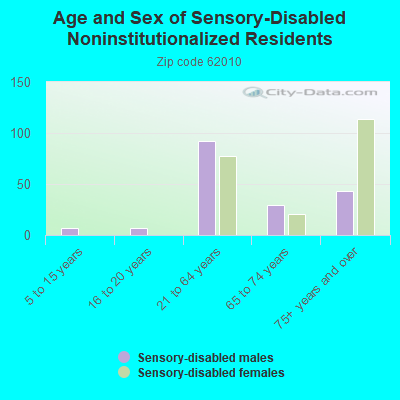
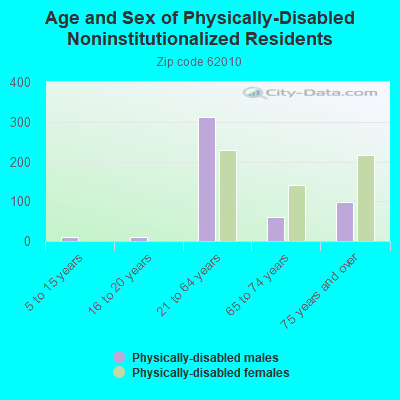
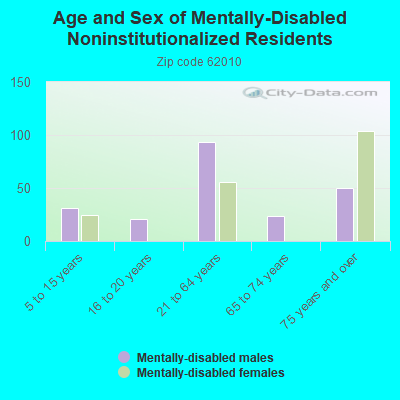
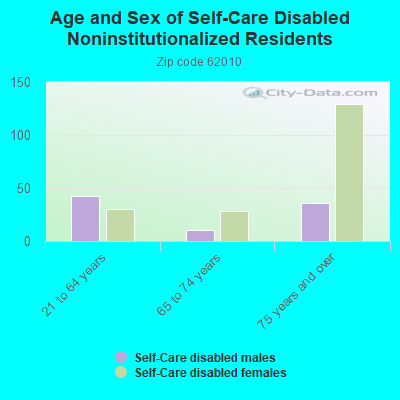
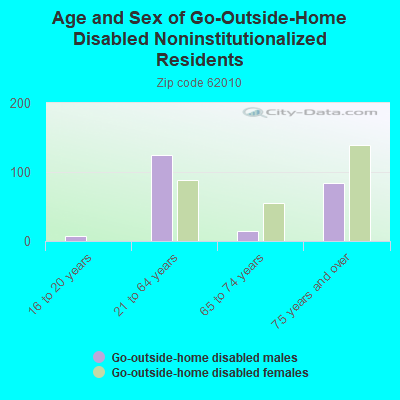
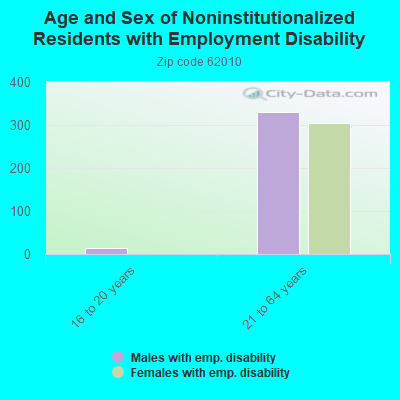
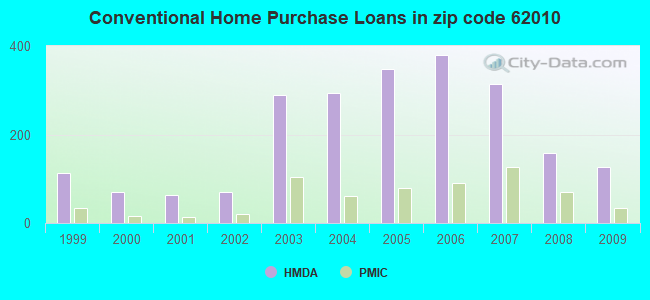
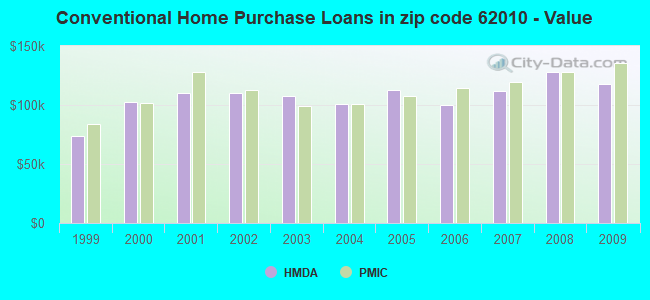
 Based on the data from the years 2002 - 2018 the average number of fires per year is 29. The highest number of reported fire incidents - 57 took place in 2011, and the least - 6 in 2005. The data has a decreasing trend.
 When looking into fire subcategories, the most incidents belonged to: Structure Fires (47.6%), and Outside Fires (23.8%).