Estimated zip code population in 2022: 5,826 Zip code population in 2010: 7,960 Zip code population in 2000: 10,725
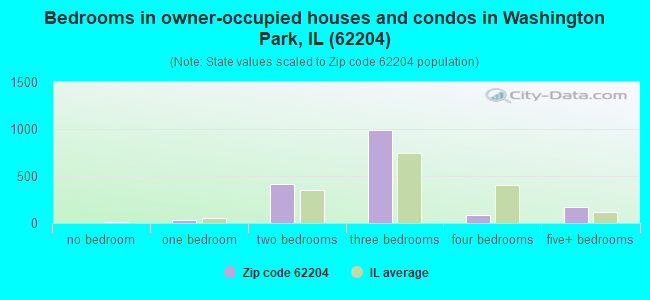
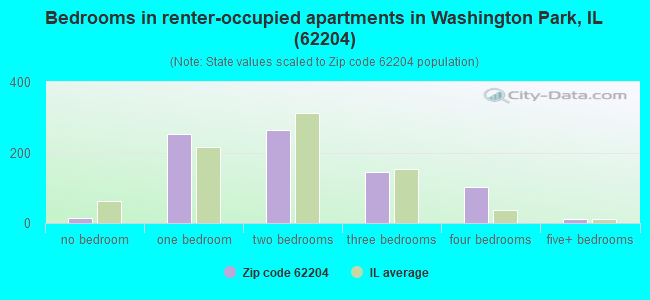
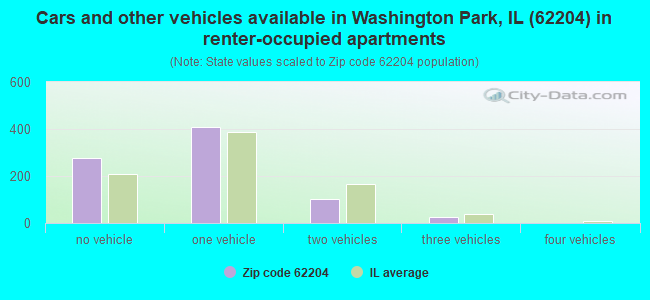
Houses and condos: 3,713 Renter-occupied apartments: 802
% of renters here:
32%
State:
33%
March 2022 cost of living index in zip code 62204: 93.2 (less than average, U.S. average is 100)
Land area: 5.6 sq. mi. Water area: 0.2 sq. mi.
Population density: 1,041 people per square mile
(low).
OSM Map
General Map
Google Map
MSN Map
OSM Map
General Map
Google Map
MSN Map
OSM Map
General Map
Google Map
MSN Map
OSM Map
General Map
Google Map
MSN Map
Please wait while loading the map...
Real estate property taxes paid for housing units in 2022:
This zip code:
2.4% ($1,182)
Illinois:
2.0% ($4,912)
Median real estate property taxes paid for housing units with mortgages in 2022: $1,138 (2.0%) Median real estate property taxes paid for housing units with no mortgage in 2022: $1,242 (2.6%)
Business Search- 14 Million verified businesses
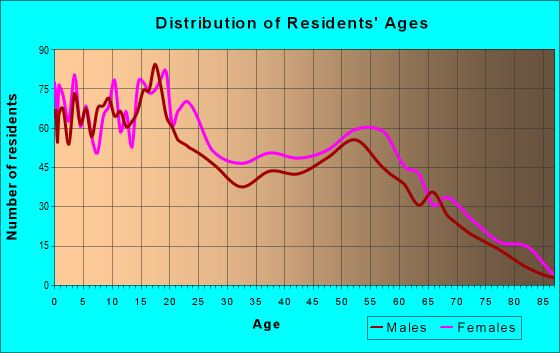
Males: 2,550
(43.8%)
Females: 3,275
(56.2%)
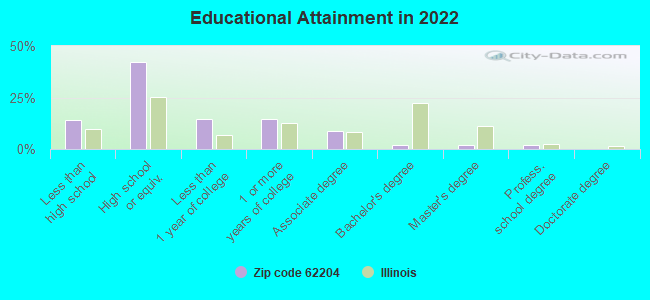
For population 25 years and over in 62204:
High school or higher: 83.8%
Bachelor's degree or higher: 5.7%
Graduate or professional degree: 3.7%
Unemployed: 11.6%
Mean travel time to work (commute): 22.3 minutes
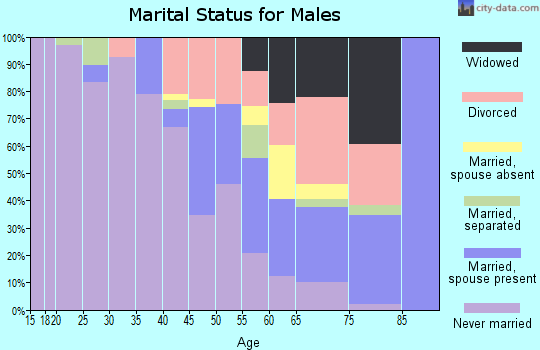
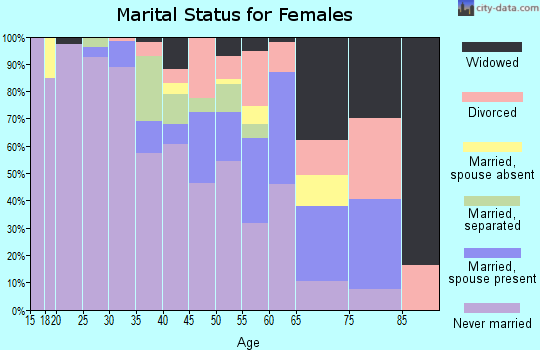
For population 15 years and over in 62204:
Never married: 45.8%
Now married: 21.7%
Separated: 9.0%
Widowed: 11.2%
Divorced: 12.3%
Zip code 62204 compared to state average:
Median household income significantly below state average.
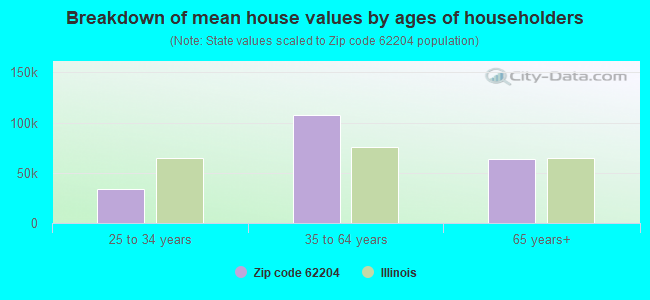
Median house value significantly below state average.
Unemployed percentage above state average.
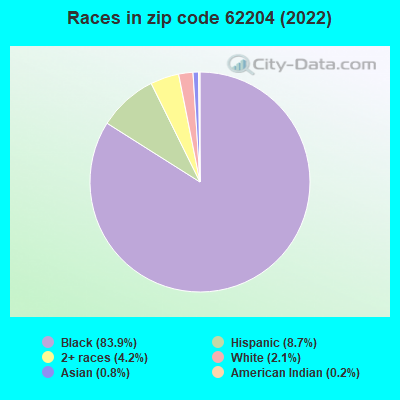
Black race population percentage significantly above state average.
Hispanic race population percentage below state average.
Foreign-born population percentage significantly below state average.
Length of stay since moving in significantly above state average.
Number of college students significantly below state average.
Percentage of population with a bachelor's degree or higher significantly below state average.
Averages for the 2020 tax year for zip code 62204, filed in 2021:
Average Adjusted Gross Income (AGI) in 2020: $24,211 (Individual Income Tax Returns)
Here:
$24,211
State:
$82,626
Salary/wage: $21,435 (reported on 86.4% of returns)
Here:
$21,435
State:
$66,640
(% of AGI for various income ranges: 1106.4% for AGIs below $25k, 3752.9% for AGIs $25k-50k, 6536.2% for AGIs $50k-75k, 12130.0% for AGIs $75k-100k)
Taxable interest for individuals: $158 (reported on 6.5% of returns)
This zip code:
$158
Illinois:
$2,376
(% of AGI for various income ranges: 0.9% for AGIs below $25k, 1.6% for AGIs $25k-50k, 5.0% for AGIs $50k-75k)
Ordinary dividends: $350 (reported on 1.1% of returns)
Here:
$350
State:
$9,061
(% of AGI for various income ranges: 0.7% for AGIs below $25k)
Profit/loss from business: +$1,604 (reported on 12.5% of returns)
Here:
+$1,604
State:
+$12,175
(% of AGI for various income ranges: 52.9% for AGIs below $25k)
Taxable individual retirement arrangement distribution: $6,133 (reported on 1.6% of returns)
62204:
$6,133
Illinois:
$21,613
(% of AGI for various income ranges: 48.4% for AGIs $25k-50k)
Total itemized deductions: $30,625 (reported on 2.2% of returns)
Here:
$30,625
State:
$34,948
(% of AGI for various income ranges: 56.5% for AGIs below $25k, 832.5% for AGIs $50k-75k)
Taxes paid: $3,000 (reported on 2.2% of returns)
62204:
$3,000
State:
$8,563
(% of AGI for various income ranges: 150.0% for AGIs $50k-75k)
Earned income credit: $2,809 (reported on 47.8% of returns)
Here:
$2,809
State:
$2,311
(% of AGI for various income ranges: 202.8% for AGIs below $25k, 122.1% for AGIs $25k-50k)
Percentage of individuals using paid preparers for their 2020 taxes: 91.3%
Here:
91%
State:
93%
(% for various income ranges: 92.2% for AGIs below $25k, 92.0% for AGIs $25k-50k, 83.3% for AGIs $50k-75k, 83.3% for AGIs $75k-100k)
Averages for the 2012 tax year for zip code 62204, filed in 2013:
Average Adjusted Gross Income (AGI) in 2012: $21,321 (Individual Income Tax Returns)
Here:
$21,321
State:
$68,058
Salary/wage: $19,240 (reported on 83.7% of returns)
Here:
$19,240
State:
$55,396
(% of AGI for various income ranges: 72.9% for AGIs below $25k, 85.6% for AGIs $25k-50k, 73.1% for AGIs $50k-75k, 59.4% for AGIs $75k-100k)
Taxable interest for individuals: $135 (reported on 6.9% of returns)
This zip code:
$135
Illinois:
$1,969
(% of AGI for various income ranges: 9.5% for AGIs $50k-75k)
Ordinary dividends: $180 (reported on 2.0% of returns)
Here:
$180
State:
$7,786
Profit/loss from business: +$7,349 (reported on 19.9% of returns)
Here:
+$7,349
State:
+$12,903
Taxable individual retirement arrangement distribution: $12,450 (reported on 1.6% of returns)
62204:
$12,450
Illinois:
$17,929
Total itemized deductions: $15,228 (32% of AGI, reported on 7.3% of returns)
Here:
$15,228
State:
$26,433
Here:
31.8% of AGI
State:
19.2% of AGI
(% of AGI for various income ranges: 1.8% for AGIs below $25k, 6.2% for AGIs $25k-50k, 9.0% for AGIs $50k-75k, 10.8% for AGIs $75k-100k)
Charity contributions: $4,427 (reported on 6.1% of returns)
Here:
$4,427
State:
$4,525
(% of AGI for various income ranges: 0.4% for AGIs below $25k, 1.3% for AGIs $25k-50k, 2.6% for AGIs $50k-75k, 3.0% for AGIs $75k-100k)
Taxes paid: $3,441 (reported on 6.9% of returns)
62204:
$3,441
State:
$11,968
(% of AGI for various income ranges: 0.2% for AGIs below $25k, 1.2% for AGIs $25k-50k, 2.2% for AGIs $50k-75k, 3.0% for AGIs $75k-100k)
Earned income credit: $2,989 (reported on 58.1% of returns)
Here:
$2,989
State:
$2,349
(% of AGI for various income ranges: 17.5% for AGIs below $25k, 1.9% for AGIs $25k-50k)
Percentage of individuals using paid preparers for their 2012 taxes: 48.8%
Here:
49%
State:
57%
(% for various income ranges: 48.9% for AGIs below $25k, 45.1% for AGIs $25k-50k, 54.5% for AGIs $50k-75k, 66.7% for AGIs $75k-100k)
Averages for the 2004 tax year for zip code 62204, filed in 2005:
Average Adjusted Gross Income (AGI) in 2004: $19,339 (Individual Income Tax Returns)
Here:
$19,339
State:
$54,625
Salary/wage: $18,064 (reported on 93.9% of returns)
Here:
$18,064
State:
$46,811
(% of AGI for various income ranges: 87.3% for AGIs below $10k, 89.6% for AGIs $10k-25k, 88.8% for AGIs $25k-50k, 86.1% for AGIs $50k-75k, 83.5% for AGIs $75k-100k, 72.4% for AGIs over 100k)
Taxable interest for individuals: $243 (reported on 8.6% of returns)
This zip code:
$243
Illinois:
$2,101
(% of AGI for various income ranges: 0.1% for AGIs below $10k, 0.1% for AGIs $10k-25k, 0.1% for AGIs $25k-50k, 0.2% for AGIs $50k-75k, 0.0% for AGIs $75k-100k, 0.2% for AGIs over 100k)
Taxable dividends: $800 (reported on 2.4% of returns)
Here:
$800
State:
$4,306
Profit/loss from business: +$2,869 (reported on 6.3% of returns)
Here:
+$2,869
State:
+$11,771
(% of AGI for various income ranges: 4.3% for AGIs below $10k, 2.0% for AGIs $10k-25k, -0.6% for AGIs $25k-50k, 0.2% for AGIs $50k-75k)
IRA payment deduction: $1,500 (reported on 0.3% of returns)
62204:
$1,500
Illinois:
$3,087
Total itemized deductions: $12,355 (27% of AGI, reported on 8.8% of returns)
Here:
$12,355
State:
$20,239
Here:
27.3% of AGI
State:
19.5% of AGI
(% of AGI for various income ranges: 2.4% for AGIs $10k-25k, 7.5% for AGIs $25k-50k, 9.6% for AGIs $50k-75k, 10.6% for AGIs $75k-100k, 10.9% for AGIs over 100k)
Charity contributions deductions: $3,520 (8% of AGI, reported on 7.7% of returns)
Here:
$3,520
State:
$3,719
Here:
7.7% of AGI
State:
3.4% of AGI
(% of AGI for various income ranges: 0.4% for AGIs $10k-25k, 1.6% for AGIs $25k-50k, 2.6% for AGIs $50k-75k, 4.1% for AGIs $75k-100k, 4.0% for AGIs over 100k)
Total tax: $2,317 (reported on 42.0% of returns)
62204:
$2,317
State:
$9,882
(% of AGI for various income ranges: 1.1% for AGIs below $10k, 1.8% for AGIs $10k-25k, 5.5% for AGIs $25k-50k, 9.8% for AGIs $50k-75k, 12.0% for AGIs $75k-100k, 13.5% for AGIs over 100k)
Earned income credit: $2,189 (reported on 58.1% of returns)
Here:
$2,189
State:
$1,788
Percentage of individuals using paid preparers for their 2004 taxes: 71.9%
Here:
72%
State:
61%
(% for various income ranges: 72.5% for AGIs below $10k, 76.5% for AGIs $10k-25k, 62.2% for AGIs $25k-50k, 67.1% for AGIs $50k-75k, 64.9% for AGIs $75k-100k, 70.6% for AGIs over 100k)
Household received Food Stamps/SNAP in the past 12 months: 1,028 Household did not receive Food Stamps/SNAP in the past 12 months: 1,547
Women who had a birth in the past 12 months: 32 (0 now married, 33 unmarried) Women who did not have a birth in the past 12 months: 1,141 (186 now married, 964 unmarried)
Housing units in zip code 62204 with a mortgage: 577 (7 second mortgage, 7 both second mortgage and home equity loan) Houses without a mortgage: 12
Median monthly owner costs for units with a mortgage: $1,021 Median monthly owner costs for units without a mortgage: $423
Residents with income below the poverty level in 2022:
This zip code:
31.1%
Whole state:
11.9%
Residents with income below 50% of the poverty level in 2022:
This zip code:
9.9%
Whole state:
5.7%
Median number of rooms in houses and condos:
Here:
5.8
State:
6.4
Median number of rooms in apartments:
Here:
4.3
State:
4.1
Notable locations in this zip code not listed on our city pages
Notable locations in zip code 62204: MedStar Ambulance (A), Washington Park Fire Department (B), East Saint Louis Fire Department Company 422 (C), City of East Saint Louis Engine House Number 2 (D). Display/hide their locations on the map
Churches in zip code 62204 include: Faith Baptist Church (A), Forest Chapel General Baptist Church (B), Friendly Church of God (C), Grace Methodist Church (D), Holy Angels Roman Catholic Church (E), Lansdowne Baptist Church (F), Lansdowne Church of Christ (G), Mount Olive Free Pentecostal Church (H), Reorganized Church of Jesus Christ of Latter Day Saints (I). Display/hide their locations on the map
In group quarters: 14 (-1 institutionalized population)
Size of family households: 440 2-persons, 196 3-persons, 259 4-persons, 165 5-persons, 51 6-persons, 13 7-or-more-persons
Size of nonfamily households: 1,274 1-person, 95 2-persons
5 married couples with children.
1,138 single-parent households (162 men, 976 women).
95.8% of residents of 62204 zip code speak English at home.
3.7% of residents speak Spanish at home (36% very well, 35% well, 18% not well, 10% not at all).
0.1% of residents speak other language at home (100% very well).
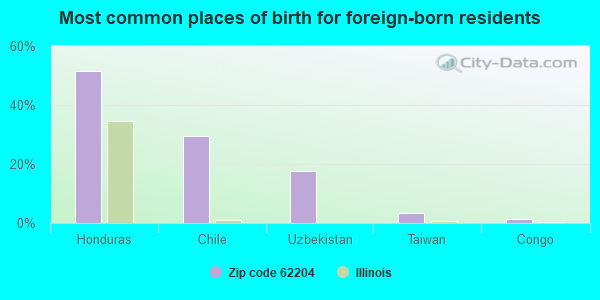
Foreign born population: 291 (5.0%) (2.8% of them are naturalized citizens)
This zip code:
5.0%
Whole state:
14.4%
51%Honduras
29%Chile
17%Uzbekistan
3%Taiwan
1%Congo
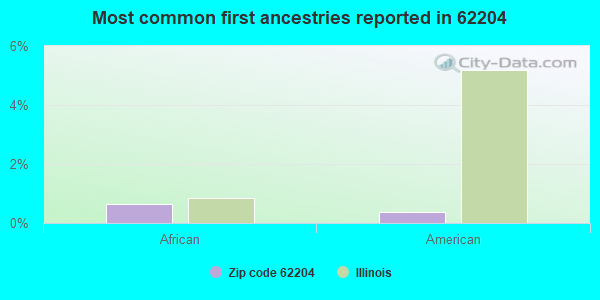
1%African
0%American
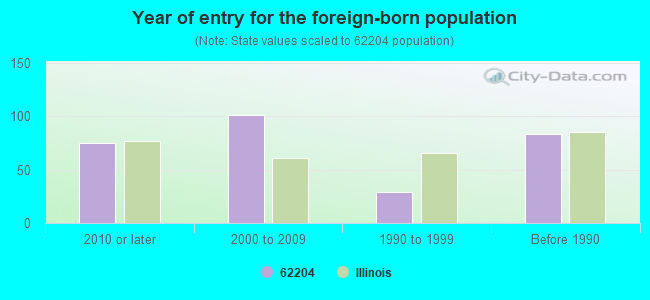
Year of entry for the foreign-born population
752010 or later
1012000 to 2009
291990 to 1999
83Before 1990
Major facilities with environmental interests located in this zip code:
HAYDEN WRECKING CORP (999 N 40TH ST. in E ST LOUIS, IL)
STATE MASTER (Illinois EPA Project) - SOLID WASTE PROGRAM (Resource Conservation and Recovery Act (tracking hazardous waste)) Organizations: RONALD K HAYDEN (CONTACT/OWNER)
MATERIAL RESOURCES INC (901 KINGS HIGHWAY in WASHINGTON PARK, IL)
STATE MASTER (Illinois EPA Project) - AIR PROGRAM, AIR MINOR (AIRS/AFS) CRITERIA AND HAZARDOUS AIR POLLUTANT INVENTORY (Inventory of air pollution sources) Business SIC classification: PREPARED FEEDS AND FEED INGREDIENTS FOR ANIMALS AND FOWLS, EXCEPT DOGS AND CATS Alternative names: MATERIAL RESOURCES LLC
LOISEL CLEANERS (1230 KINGSHIGHWAY in EAST SAINT LOUIS, IL)
STATE MASTER (Illinois EPA Project) - HAZARDOUS WASTE PROGRAM Small Quantity Generators, between 100 kg and 1000 kg of hazardous waste/month (Resource Conservation and Recovery Act (tracking hazardous waste)) - notification Organizations: DAMMRICH JOE (CONTACT/OWNER)
METALS RECYCLING CORP (59TH & INDUSTRIAL AVE in WASHINGTON PARK, IL)
STATE MASTER (Illinois EPA Project) - AIR PROGRAM AIR MINOR (AIRS/AFS) Business SIC classification: MINERALS AND EARTHS, GROUND OR OTHERWISE TREATED
PALLET PLACE (57TH AND INDUSTRIAL AVE in WASHINGTON PARK, IL)
STATE MASTER (Illinois EPA Project) - AIR PROGRAM AIR MINOR (AIRS/AFS) Business SIC classification: ELECTROPLATING, PLATING, POLISHING, ANODIZING, AND COLORING
CLARK OIL 1984 (1401 KINGS HWY in WASHINGTON PARK, IL)
STATE MASTER (Illinois EPA Project) - SOLID WASTE PROGRAM, HAZARDOUS WASTE PROGRAM Small Quantity Generators, between 100 kg and 1000 kg of hazardous waste/month (Resource Conservation and Recovery Act (tracking hazardous waste)) - notification Organizations: CLARK REFINING & MARKETING (CONTACT/OWNER)
Alternative names: CLARK OIL STA #1984
HAWTHORNE ELEM SCHOOL (1600 N 40TH ST in EAST SAINT LOUIS, IL)
(National Center for Education Statistics) - STATE ID-5008218902046 Organizations: EAST ST LOUIS SCHOOL DIST 189 (SCHOOL DISTRICT)
LANSDOWNE JR HIGH SCHOOL (3939 CASEYVILLE AVE in EAST SAINT LOUIS, IL)
(National Center for Education Statistics) - STATE ID-5008218901025 Organizations: EAST ST LOUIS SCHOOL DIST 189 (SCHOOL DISTRICT)
MANNERS ELEM SCHOOL (1915 N 55TH ST in EAST SAINT LOUIS, IL)
(National Center for Education Statistics) - STATE ID-5008218902029 Organizations: EAST ST LOUIS SCHOOL DIST 189 (SCHOOL DISTRICT)
MARTIN INDUSTRIES INC (4251 ST. CLAIR AVE. in WASHINGTON PARK, IL)
AIR MINOR (AIRS/AFS) HAZARDOUS WASTE BIENNIAL REPORTER (Resource Conservation and Recovery Act (tracking hazardous waste)) Small Quantity Generators, between 100 kg and 1000 kg of hazardous waste/month (Resource Conservation and Recovery Act (tracking hazardous waste)) TRI REPORTER (Tracking of toxic chemicals releasing facilities) Business SIC classification: HEATING EQUIPMENT, EXCEPT ELECTRIC AND WARM AIR FURNACES Organizations: LOCKE STOVE COMPANY (CONTACT/OWNER)
Alternative names: LOCKE STOVE CO
NELSON MANDELA SCHOOL (1800 N 25TH ST in EAST SAINT LOUIS, IL)
(National Center for Education Statistics) - STATE ID-5008218902020 Organizations: EAST ST LOUIS SCHOOL DIST 189 (SCHOOL DISTRICT)
PARCO MAINTENANCE, INC. (6301 ST. CLAIR AVENUE in EAST ST. LOUIS, IL)
National Pollutant Discharge Elimination System NON-MAJOR (Tracking pollutant discharge elimination systems) - permit
KINGS HWY AMOCO (1205 KINGS HWY in WASHINGTON PARK, IL)
(Resource Conservation and Recovery Act (tracking hazardous waste))
Housing units lacking complete plumbing facilities: 12.3% Housing units lacking complete kitchen facilities: 6.2%
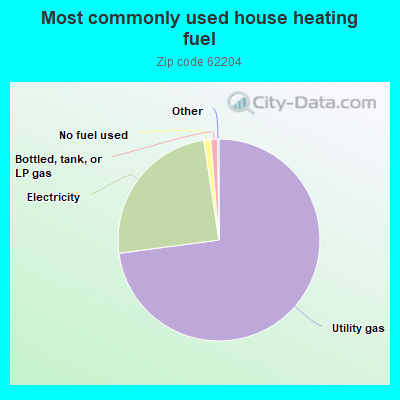
72.9%Utility gas
24.7%Electricity
1.1%No fuel used
1.1%Bottled, tank, or LP gas
Population in 1990: 14,425.
Place of birth for U.S.-born residents:
This state: 3,222
Northeast: 4
Midwest: 1,052
South: 926
West: 310
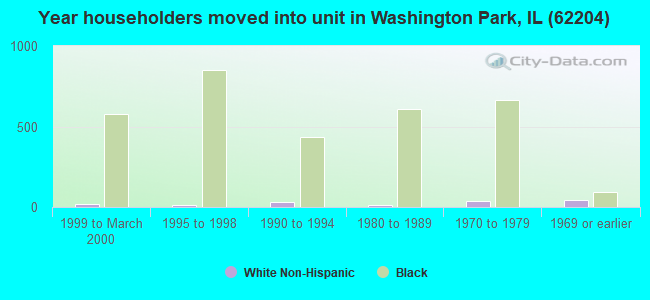
64% of the 62204 zip code residents lived in the same house 5 years ago. Out of people who lived in different houses, 82% lived in this county. Out of people who lived in different counties, 50% lived in Illinois.
96% of the 62204 zip code residents lived in the same house 1 year ago. Out of people who lived in different houses, 55% moved from this county. Out of people who lived in different houses, 9% moved from different county within same state. Out of people who lived in different houses, 11% moved from different state. Out of people who lived in different houses, 27% moved from abroad.
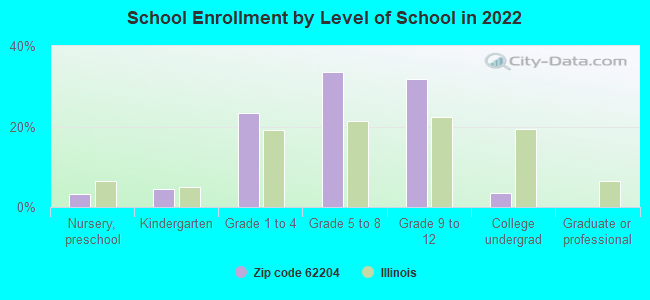
Private vs. public school enrollment:
Students in private schools in grades 1 to 8 (elementary and middle school): 52
Here:
6.6%
Illinois:
13.3%
Students in private schools in grades 9 to 12 (high school): 12
Here:
2.8%
Illinois:
9.9%
Students in private undergraduate colleges: 11
Here:
22.6%
Illinois:
27.4%
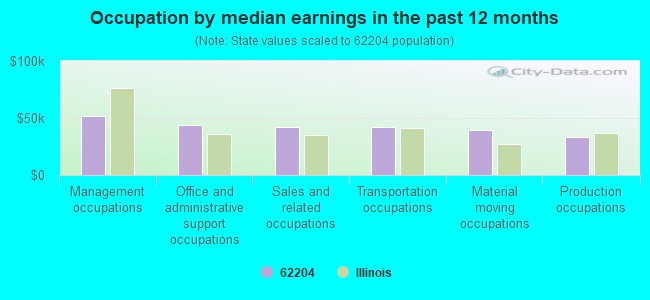
Occupation by median earnings in the past 12 months ($)
52,004Management occupations
43,913Office and administrative support occupations
42,435Sales and related occupations
41,830Transportation occupations
39,248Material moving occupations
32,929Production occupations
Companies with federal contracts located in this zip code:
R & W BUILDERS, INC (1403 N 54TH ST in EAST SAINT LOU, IL; small business) : $1,071,015 in 12 contractsfrom 2002 to 2006
Contracts for Maintenance, Repair or Alteration of Real Property -- Office Buildings, Textile Fabrics, Construction of Structures and Facilities -- Heating and Cooling Plants, Maintenance, Repair or Alteration of Real Property -- Other Non-Building Facilities, and moreby Air Force Signed by year:2000: $0; 2001: $0; 2002: $5,650; 2003: $0; 2004: $29,000; 2005: $993,691; 2006: $42,674.
Biggest contracts:
$749,187 with Air Force for Maintenance, Repair or Alteration of Real Property -- Office Buildings. Signed on 2005-09-16. Completion date: 2006-02-28.
$211,465, same as above.Signed on 2005-11-16. Completion date: 2005-12-04.
$29,000 with Air Force for Textile Fabrics. Signed on 2004-09-29. Completion date: 2004-11-28.
$25,000 with Air Force for Maintenance, Repair or Alteration of Real Property -- Office Buildings. Signed on 2006-02-13. Completion date: 2006-03-06.
Top industries in this zip code by the number of employees in 2005:
2002 - 2018 National Fire Incident Reporting System (NFIRS) incidents
According to the data from the years 2002 - 2018 the average number of fire incidents per year is 181. The highest number of fire incidents - 304 took place in 2012, and the least - 23 in 2004. The data has a growing trend.
When looking into fire subcategories, the most reports belonged to: Structure Fires (42.8%), and Outside Fires (38.3%).
Fire incident types reported to NFIRS in Zip Code 62204
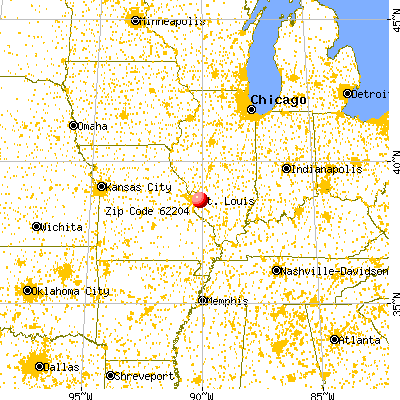


 Nearest zip codes: 62203, 62205, 62201, 62207, 62060, 62059.


 According to the data from the years 2002 - 2018 the average number of fire incidents per year is 181. The highest number of fire incidents - 304 took place in 2012, and the least - 23 in 2004. The data has a growing trend.
 When looking into fire subcategories, the most reports belonged to: Structure Fires (42.8%), and Outside Fires (38.3%).