Estimated zip code population in 2022: 1,871 Zip code population in 2010: 1,674 Zip code population in 2000: 1,636
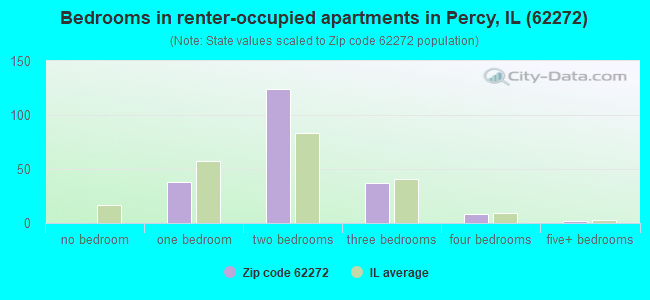
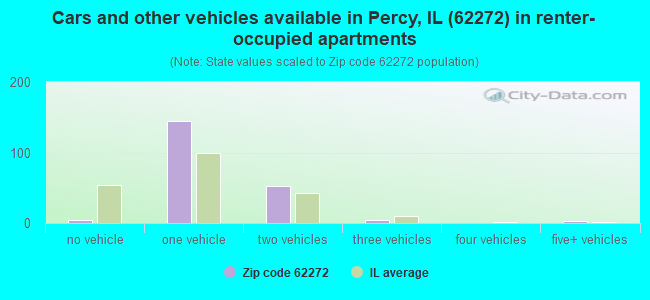
Houses and condos: 844 Renter-occupied apartments: 211
% of renters here:
29%
State:
33%
March 2022 cost of living index in zip code 62272: 75.1 (low, U.S. average is 100)
Land area: 37.9 sq. mi. Water area: 0.6 sq. mi.
Population density: 49 people per square mile
(very low).
OSM Map
General Map
Google Map
MSN Map
OSM Map
General Map
Google Map
MSN Map
OSM Map
General Map
Google Map
MSN Map
OSM Map
General Map
Google Map
MSN Map
Please wait while loading the map...
Real estate property taxes paid for housing units in 2022:
This zip code:
1.4% ($1,631)
Illinois:
2.0% ($4,912)
Median real estate property taxes paid for housing units with mortgages in 2022: $1,897 (1.0%) Median real estate property taxes paid for housing units with no mortgage in 2022: $1,380 (1.2%)
Business Search- 14 Million verified businesses
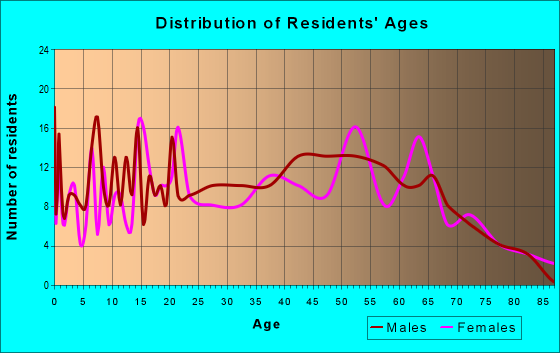
Males: 933
(49.9%)
Females: 938
(50.1%)
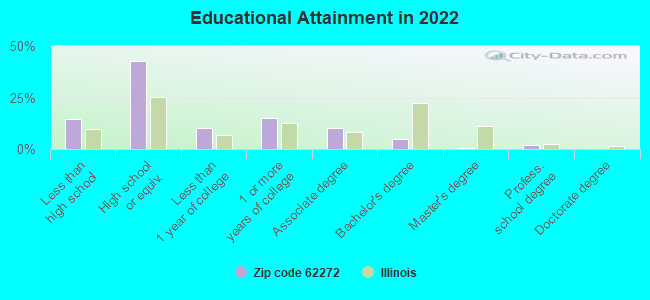
For population 25 years and over in 62272:
High school or higher: 83.0%
Bachelor's degree or higher: 7.2%
Graduate or professional degree: 2.4%
Unemployed: 0.7%
Mean travel time to work (commute): 20.5 minutes
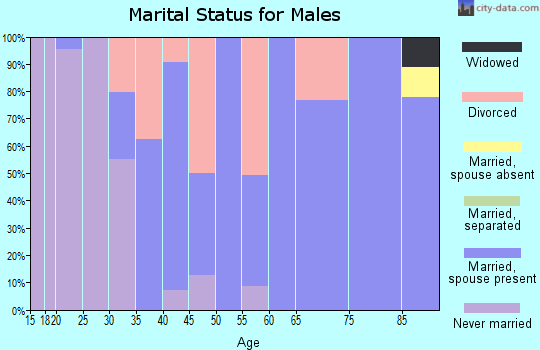
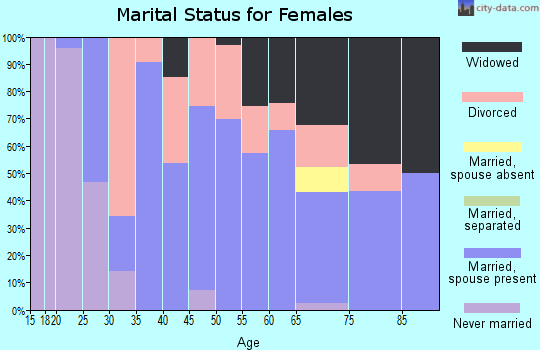
For population 15 years and over in 62272:
Never married: 26.6%
Now married: 51.1%
Separated: 0.8%
Widowed: 6.0%
Divorced: 15.4%
Zip code 62272 compared to state average:
Median household income below state average.
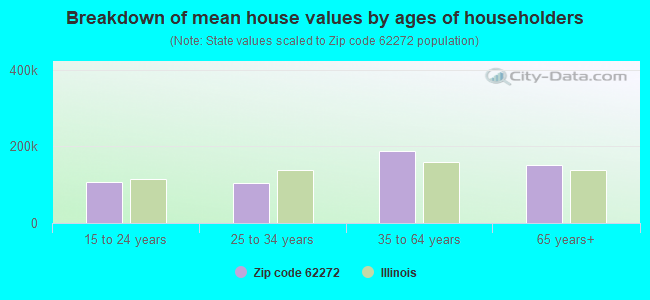
Median house value below state average.
Unemployed percentage significantly below state average.
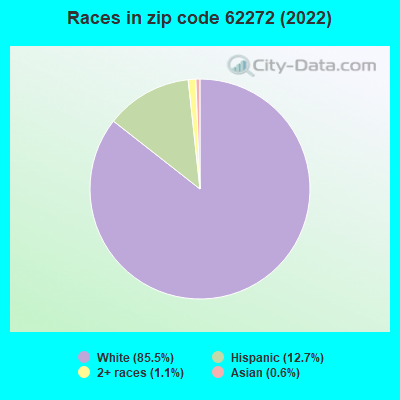
Black race population percentage significantly below state average.
Length of stay since moving in significantly above state average.
Number of college students significantly below state average.
Percentage of population with a bachelor's degree or higher significantly below state average.
Averages for the 2020 tax year for zip code 62272, filed in 2021:
Average Adjusted Gross Income (AGI) in 2020: $47,425 (Individual Income Tax Returns)
Here:
$47,425
State:
$82,626
Salary/wage: $40,952 (reported on 77.6% of returns)
Here:
$40,952
State:
$66,640
(% of AGI for various income ranges: 1075.3% for AGIs below $25k, 3268.6% for AGIs $25k-50k, 5208.8% for AGIs $50k-75k, 9540.0% for AGIs $75k-100k, 13816.0% for AGIs $100k-200k)
Taxable interest for individuals: $546 (reported on 41.8% of returns)
This zip code:
$546
Illinois:
$2,376
(% of AGI for various income ranges: 28.2% for AGIs below $25k, 20.7% for AGIs $25k-50k, 55.0% for AGIs $50k-75k, 37.5% for AGIs $75k-100k, 34.0% for AGIs $100k-200k)
Ordinary dividends: $1,517 (reported on 17.9% of returns)
Here:
$1,517
State:
$9,061
(% of AGI for various income ranges: 57.6% for AGIs below $25k, 46.2% for AGIs $50k-75k, 94.0% for AGIs $100k-200k)
Net capital gain/loss in AGI: +$2,870 (reported on 14.9% of returns)
Here:
+$2,870
State:
+$31,684
(% of AGI for various income ranges: 42.4% for AGIs below $25k, 85.0% for AGIs $50k-75k, 294.0% for AGIs $100k-200k)
Profit/loss from business: +$4,486 (reported on 10.4% of returns)
Here:
+$4,486
State:
+$12,175
(% of AGI for various income ranges: 136.5% for AGIs below $25k, 102.5% for AGIs $50k-75k)
Taxable individual retirement arrangement distribution: $12,067 (reported on 9.0% of returns)
62272:
$12,067
Illinois:
$21,613
(% of AGI for various income ranges: 140.0% for AGIs below $25k, 607.5% for AGIs $50k-75k)
Earned income credit: $2,245 (reported on 16.4% of returns)
Here:
$2,245
State:
$2,311
(% of AGI for various income ranges: 91.8% for AGIs below $25k, 65.0% for AGIs $25k-50k)
Percentage of individuals using paid preparers for their 2020 taxes: 97.0%
Here:
97%
State:
93%
(% for various income ranges: 96.2% for AGIs below $25k, 94.4% for AGIs $25k-50k, 100.0% for AGIs $50k-75k, 100.0% for AGIs $75k-100k, 100.0% for AGIs $100k-200k)
Averages for the 2012 tax year for zip code 62272, filed in 2013:
Average Adjusted Gross Income (AGI) in 2012: $39,060 (Individual Income Tax Returns)
Here:
$39,060
State:
$68,058
Salary/wage: $33,777 (reported on 81.4% of returns)
Here:
$33,777
State:
$55,396
(% of AGI for various income ranges: 73.9% for AGIs below $25k, 76.0% for AGIs $25k-50k, 74.0% for AGIs $50k-75k, 76.1% for AGIs $75k-100k, 54.4% for AGIs $100k-200k)
Taxable interest for individuals: $1,130 (reported on 38.6% of returns)
This zip code:
$1,130
Illinois:
$1,969
(% of AGI for various income ranges: 2.9% for AGIs below $25k, 1.0% for AGIs $25k-50k, 0.5% for AGIs $50k-75k, 0.7% for AGIs $75k-100k, 0.9% for AGIs $100k-200k)
Ordinary dividends: $1,485 (reported on 18.6% of returns)
Here:
$1,485
State:
$7,786
(% of AGI for various income ranges: 1.5% for AGIs below $25k, 0.9% for AGIs $25k-50k, 0.7% for AGIs $50k-75k, 0.6% for AGIs $100k-200k)
Net capital gain/loss in AGI: +$980 (reported on 14.3% of returns)
Here:
+$980
State:
+$22,183
(% of AGI for various income ranges: 0.2% for AGIs $25k-50k, 1.6% for AGIs $75k-100k)
Profit/loss from business: +$3,357 (reported on 10.0% of returns)
Here:
+$3,357
State:
+$12,903
Taxable individual retirement arrangement distribution: $7,133 (reported on 8.6% of returns)
62272:
$7,133
Illinois:
$17,929
Total itemized deductions: $22,225 (23% of AGI, reported on 11.4% of returns)
Here:
$22,225
State:
$26,433
Here:
23.2% of AGI
State:
19.2% of AGI
(% of AGI for various income ranges: 5.9% for AGIs $25k-50k, 6.2% for AGIs $50k-75k, 9.2% for AGIs $75k-100k, 9.6% for AGIs $100k-200k)
Charity contributions: $3,933 (reported on 8.6% of returns)
Here:
$3,933
State:
$4,525
Taxes paid: $6,662 (reported on 11.4% of returns)
62272:
$6,662
State:
$11,968
(% of AGI for various income ranges: 1.0% for AGIs $25k-50k, 1.9% for AGIs $50k-75k, 2.7% for AGIs $75k-100k, 3.7% for AGIs $100k-200k)
Earned income credit: $2,092 (reported on 17.1% of returns)
Here:
$2,092
State:
$2,349
(% of AGI for various income ranges: 4.3% for AGIs below $25k, 1.1% for AGIs $25k-50k)
Percentage of individuals using paid preparers for their 2012 taxes: 65.7%
Here:
66%
State:
57%
(% for various income ranges: 58.1% for AGIs below $25k, 63.2% for AGIs $25k-50k, 77.8% for AGIs $50k-75k, 83.3% for AGIs $75k-100k, 80.0% for AGIs $100k-200k)
Averages for the 2004 tax year for zip code 62272, filed in 2005:
Average Adjusted Gross Income (AGI) in 2004: $32,073 (Individual Income Tax Returns)
Here:
$32,073
State:
$54,625
Salary/wage: $29,887 (reported on 83.6% of returns)
Here:
$29,887
State:
$46,811
(% of AGI for various income ranges: 80.1% for AGIs below $10k, 70.6% for AGIs $10k-25k, 83.0% for AGIs $25k-50k, 82.9% for AGIs $50k-75k, 75.7% for AGIs $75k-100k, 61.3% for AGIs over 100k)
Taxable interest for individuals: $1,631 (reported on 45.5% of returns)
This zip code:
$1,631
Illinois:
$2,101
(% of AGI for various income ranges: 9.4% for AGIs below $10k, 5.3% for AGIs $10k-25k, 1.8% for AGIs $25k-50k, 0.8% for AGIs $50k-75k, 0.4% for AGIs $75k-100k, 3.4% for AGIs over 100k)
Taxable dividends: $791 (reported on 19.2% of returns)
Here:
$791
State:
$4,306
(% of AGI for various income ranges: 0.8% for AGIs below $10k, 0.7% for AGIs $10k-25k, 0.8% for AGIs $25k-50k, 0.1% for AGIs $50k-75k, 0.3% for AGIs $75k-100k)
Net capital gain/loss: +$1,917 (reported on 13.8% of returns)
Here:
+$1,917
State:
+$17,321
(% of AGI for various income ranges: 1.5% for AGIs $10k-25k, 1.3% for AGIs $25k-50k, 0.7% for AGIs $50k-75k, -0.2% for AGIs $75k-100k)
Profit/loss from business: +$4,178 (reported on 10.5% of returns)
Here:
+$4,178
State:
+$11,771
Total itemized deductions: $13,309 (21% of AGI, reported on 9.8% of returns)
Here:
$13,309
State:
$20,239
Here:
20.9% of AGI
State:
19.5% of AGI
Charity contributions deductions: $4,075 (5% of AGI, reported on 5.7% of returns)
Here:
$4,075
State:
$3,719
Here:
5.5% of AGI
State:
3.4% of AGI
Total tax: $3,676 (reported on 70.9% of returns)
62272:
$3,676
State:
$9,882
(% of AGI for various income ranges: 2.1% for AGIs below $10k, 3.8% for AGIs $10k-25k, 6.5% for AGIs $25k-50k, 8.8% for AGIs $50k-75k, 11.1% for AGIs $75k-100k, 17.3% for AGIs over 100k)
Earned income credit: $1,714 (reported on 18.1% of returns)
Here:
$1,714
State:
$1,788
Percentage of individuals using paid preparers for their 2004 taxes: 75.0%
Here:
75%
State:
61%
(% for various income ranges: 68.2% for AGIs below $10k, 75.6% for AGIs $10k-25k, 80.1% for AGIs $25k-50k, 71.2% for AGIs $50k-75k, 83.3% for AGIs $75k-100k, 80.0% for AGIs over 100k)
Household received Food Stamps/SNAP in the past 12 months: 140 Household did not receive Food Stamps/SNAP in the past 12 months: 579
Women who had a birth in the past 12 months: 14 (10 now married, 3 unmarried) Women who did not have a birth in the past 12 months: 299 (157 now married, 140 unmarried)
Housing units in zip code 62272 with a mortgage: 215 (18 second mortgage, 16 both second mortgage and home equity loan) Median monthly owner costs for units with a mortgage: $950 Median monthly owner costs for units without a mortgage: $437
Residents with income below the poverty level in 2022:
This zip code:
19.5%
Whole state:
11.9%
Residents with income below 50% of the poverty level in 2022:
This zip code:
3.5%
Whole state:
5.7%
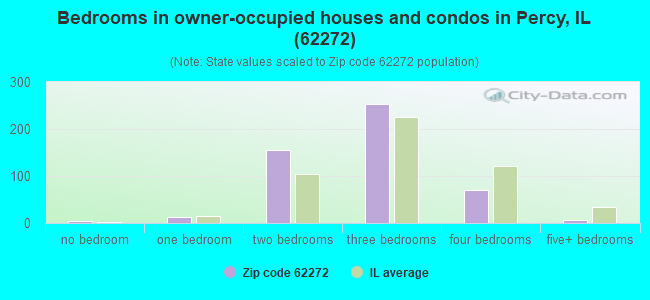
Median number of rooms in houses and condos:
Here:
6.2
State:
6.4
Median number of rooms in apartments:
Here:
4.4
State:
4.1
Notable locations in this zip code not listed on our city pages
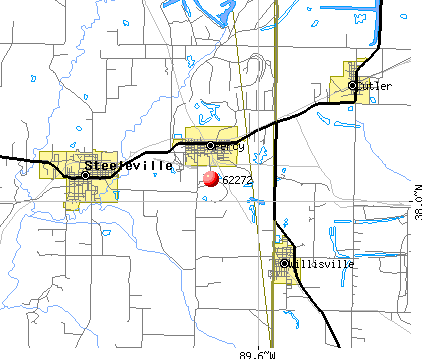
Notable locations in zip code 62272: Pinckneyville Ambulance Service Willisville (A), Percy Volunteer Fire Department (B), Willisville Volunteer Fire Department (C). Display/hide their locations on the map
Cemeteries: Independent Order of Odd Fellows Cemetery (1), Saint Joseph Cemetery (2), Gillespie Cemetery (3), Stoker Cemetery (4). Display/hide their locations on the map
Size of family households: 185 2-persons, 110 3-persons, 59 4-persons, 67 5-persons, 14 6-persons, 13 7-or-more-persons
Size of nonfamily households: 253 1-person, 7 4-persons
407 married couples with children.
140 single-parent households (44 men, 96 women).
89.1% of residents of 62272 zip code speak English at home.
7.1% of residents speak Spanish at home (78% very well, 22% not well).
0.3% of residents speak other Indo-European language at home (100% very well).
0.3% of residents speak Asian or Pacific Island language at home (100% very well).
2.3% of residents speak other language at home (36% well, 41% not well, 23% not at all).
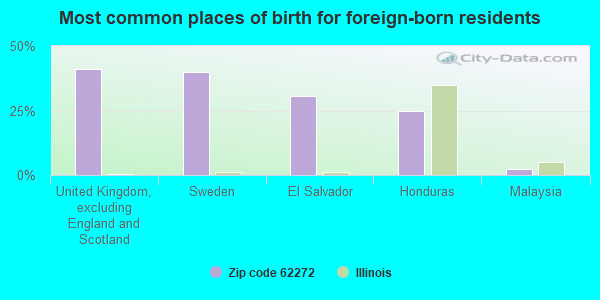
Foreign born population: 184 (9.9%) (6.5% of them are naturalized citizens)
This zip code:
9.9%
Whole state:
14.4%
41%United Kingdom, excluding England and Scotland
40%Sweden
31%El Salvador
25%Honduras
2%Malaysia
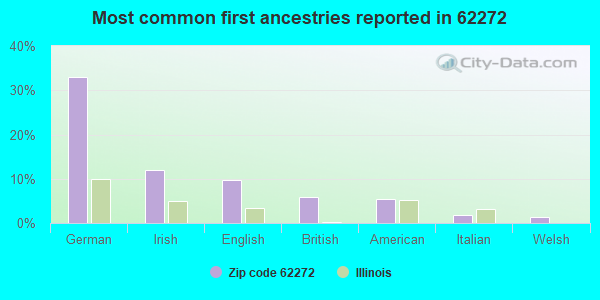
33%German
12%Irish
10%English
6%British
5%American
2%Italian
1%Welsh
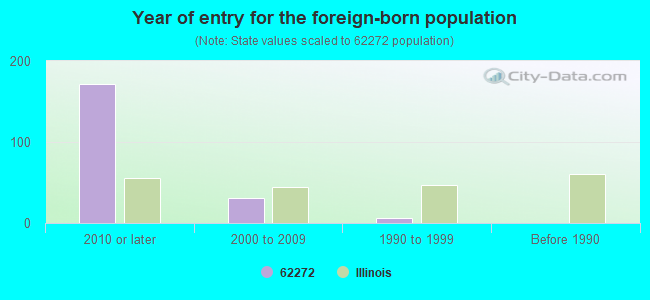
Year of entry for the foreign-born population
1712010 or later
312000 to 2009
61990 to 1999
0Before 1990
Facilities with environmental interests located in this zip code:
ARCH OF ILLINOIS INC (RURAL ROUTE 1 in PERCY, IL)
STATE MASTER (Illinois EPA Project) - AIR PROGRAM AIR MINOR (AIRS/AFS) Business SIC classification: LUBRICATING OILS AND GREASES Alternative names: ARCH OF ILLINOIS/DIV. OF APOGEE COAL CO.
ARCH OF ILLINOIS INC (DENMARK MINE in PERCY, IL)
STATE MASTER (Illinois EPA Project) - SOLID WASTE PROGRAM, HAZARDOUS WASTE PROGRAM Small Quantity Generators, between 100 kg and 1000 kg of hazardous waste/month (Resource Conservation and Recovery Act (tracking hazardous waste)) - notification
PERCY MART/A1 FOOD MART LLC (302 E PINE ST in PERCY, IL)
STATE MASTER (Illinois EPA Project) - AIR PROGRAM AIR MINOR (AIRS/AFS) Business SIC classification: NONCLASSIFIABLE ESTABLISHMENTS
PERCY STP (CLYDE STEELE STREET in PERCY, IL)
STATE MASTER (Illinois EPA Project) - National Pollutant Discharge Elimination System Permit National Pollutant Discharge Elimination System NON-MAJOR (Tracking pollutant discharge elimination systems) - permit Business SIC classification: SEWERAGE SYSTEMS Alternative names: PERCY STP, VILLAGE OF
ARCH OF ILLINOIS INC.-CAPTAIN MINE (3 MILES EAST SOUTHEAST OF CUTLER OFF PYAT in PERCY, IL)
AIR SYNTHETIC MINOR (AIRS/AFS) CRITERIA AND HAZARDOUS AIR POLLUTANT INVENTORY (Inventory of air pollution sources) Small Quantity Generators, between 100 kg and 1000 kg of hazardous waste/month (Resource Conservation and Recovery Act (tracking hazardous waste)) - notification Business SIC and NAICS classification: BITUMINOUS COAL AND LIGNITE SURFACE MINING
ILLINOIS CENTRAL RAILROAD CORP (INT. OF 5TH STREET & RR TRACKS in PERCY, IL)
National Pollutant Discharge Elimination System NON-MAJOR (Tracking pollutant discharge elimination systems) - permit
ILLINOIS CENTRAL RAILROAD CORP (INT. OF PHAYT ST. & RR TRACKS in PERCY, IL)
National Pollutant Discharge Elimination System NON-MAJOR (Tracking pollutant discharge elimination systems) - permit
RANDOLPH SERVICE CO (1BLK S OF RTE 4 in PERCY, IL)
(Resource Conservation and Recovery Act (tracking hazardous waste)) Organizations: RANDOLPH SERVICE COMPANY (CONTACT/OWNER)
ICGG PIPELINE GAS DEMONSTRATION PLANT (TRICO RD 1 MI S PYATT RD in PERCY, IL) . Federal Facility. DOE - ENERGY, SCIENCE & ENVIRONMENT
(Resource Conservation and Recovery Act (tracking hazardous waste))
KNIGHT HAWK COAL-ROYAL FALCON (2.5 MILES WEST OF ROYALTON in PERCY, IL)
National Pollutant Discharge Elimination System NON-MAJOR (Tracking pollutant discharge elimination systems) - permit Business SIC classification: BITUMINOUS COAL AND LIGNITE SURFACE MINING
MDC OF ILLINOIS (1 MILE SOUTH OF PERCY in PERCY, IL)
AIR MINOR (AIRS/AFS) Business SIC classification: NONCLASSIFIABLE ESTABLISHMENTS
ARCH OF ILLINOIS COAL CO (PO BOX 308 in PERCY, IL)
COMPLIANCE ACTIVITY (Tracking inspections of insecticide, fungicide, and rodenticide, and toxic substances)
Housing units lacking complete plumbing facilities: 5.5% Housing units lacking complete kitchen facilities: 6.2%
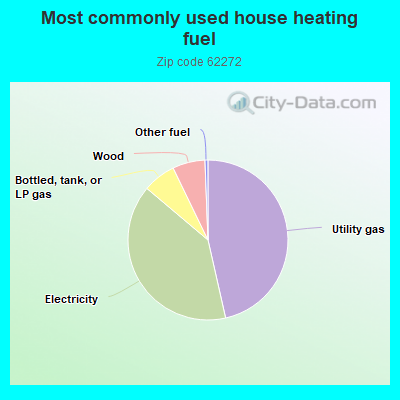
46.7%Utility gas
39.9%Electricity
6.7%Bottled, tank, or LP gas
6.6%Wood
0.6%Other fuel
Population in 1990: 1,241. Population change in the 1990s: +395 (+31.8%).
Place of birth for U.S.-born residents:
This state: 1,354
Northeast: 11
Midwest: 228
South: 51
West: 38
63% of the 62272 zip code residents lived in the same house 5 years ago. Out of people who lived in different houses, 52% lived in this county. Out of people who lived in different counties, 50% lived in Illinois.
91% of the 62272 zip code residents lived in the same house 1 year ago. Out of people who lived in different houses, 33% moved from this county. Out of people who lived in different houses, 48% moved from different county within same state. Out of people who lived in different houses, 2% moved from different state. Out of people who lived in different houses, 19% moved from abroad.
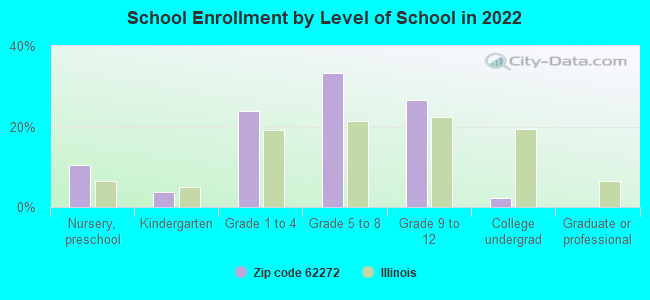
Private vs. public school enrollment:
Students in private schools in grades 1 to 8 (elementary and middle school):
Here:
0.0%
Illinois:
13.3%
Students in private schools in grades 9 to 12 (high school):
Here:
0.0%
Illinois:
9.9%
Students in private undergraduate colleges: 4
Here:
39.1%
Illinois:
27.4%
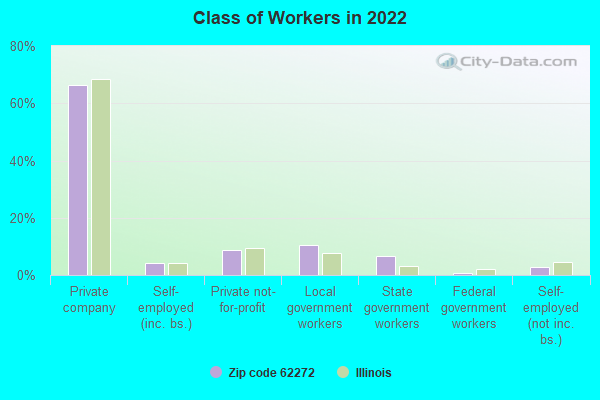
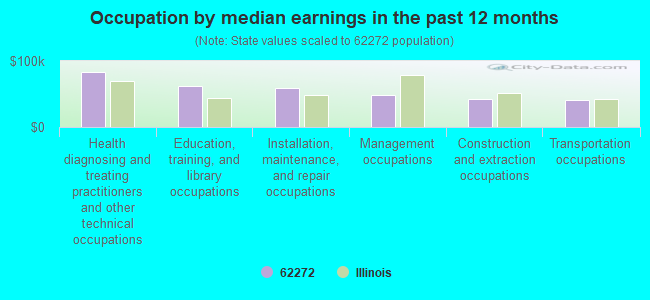
Occupation by median earnings in the past 12 months ($)
83,908Health diagnosing and treating practitioners and other technical occupations
61,451Education, training, and library occupations
59,352Installation, maintenance, and repair occupations
48,667Management occupations
43,091Construction and extraction occupations
41,192Transportation occupations
Top industries in this zip code by the number of employees in 2005:
Administrative and Support and Waste Management and Remediation Services: Landscaping Services (5-9: 1)
Other Services (except Public Administration): Automotive Body, Paint, and Interior Repair and Maintenance (5-9: 1)
Finance and Insurance: Commercial Banking (5-9: 1)
Other Services (except Public Administration): Religious Organizations (1-4: 2)
Health Care and Social Assistance: Child Day Care Services (1-4: 1)
Construction: All Other Specialty Trade Contractors (1-4: 1)
People in group quarters in 2000:
39 people in nursing homes
Fatal accident statistics in 2013:
Fatal accident count: 1
Vehicles involved in fatal accidents: 1
Fatal accidents caused by drunken drivers: 0
Fatalities: 1
Persons involved in fatal accidents: 2
Pedestrians involved in fatal accidents: 1
Fatal accident statistics in 2010:
Fatal accident count: 1
Vehicles involved in fatal accidents: 2
Fatal accidents caused by drunken drivers: 1
Fatalities: 2
Persons involved in fatal accidents: 3
Pedestrians involved in fatal accidents: 0
2002 - 2018 National Fire Incident Reporting System (NFIRS) incidents
According to the data from the years 2002 - 2018 the average number of fires per year is 9. The highest number of fire incidents - 19 took place in 2013, and the least - 0 in 2003. The data has a growing trend.
When looking into fire subcategories, the most reports belonged to: Structure Fires (50.0%), and Outside Fires (30.8%).
Fire incident types reported to NFIRS in Zip Code 62272
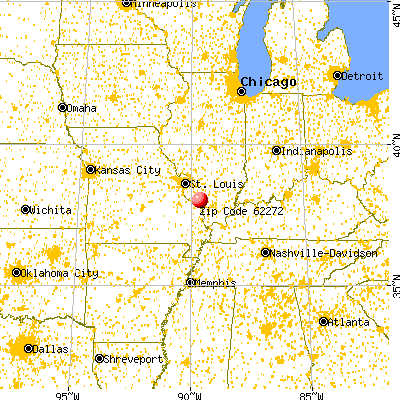


 Nearest zip codes: 62997, 62916, 62238, 62288, 62280, 62907.
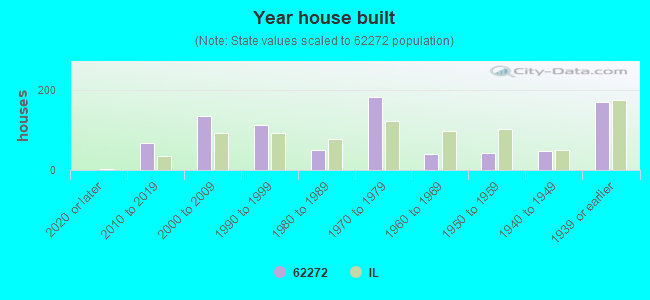


 According to the data from the years 2002 - 2018 the average number of fires per year is 9. The highest number of fire incidents - 19 took place in 2013, and the least - 0 in 2003. The data has a growing trend.
 When looking into fire subcategories, the most reports belonged to: Structure Fires (50.0%), and Outside Fires (30.8%).