Estimated zip code population in 2022: 3,128 Zip code population in 2010: 3,404 Zip code population in 2000: 3,684
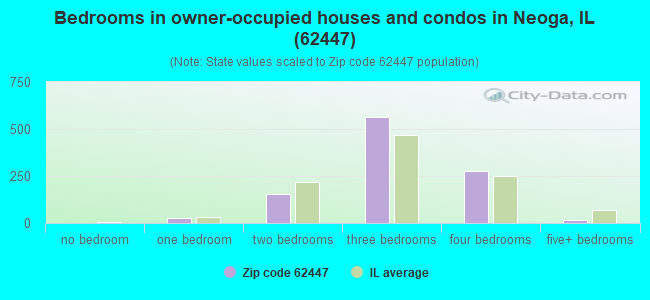
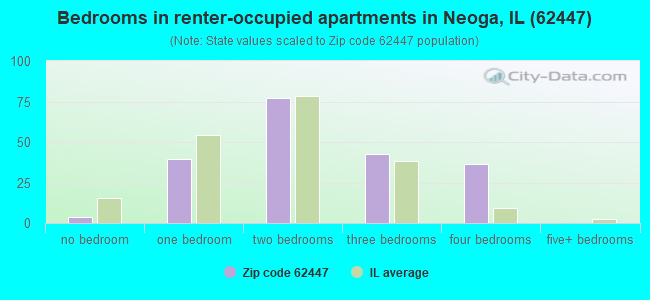
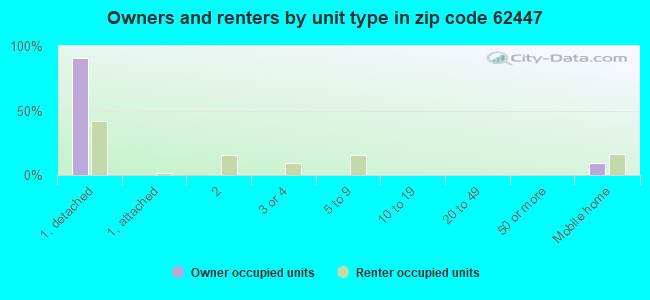
Houses and condos: 1,501 Renter-occupied apartments: 202
% of renters here:
16%
State:
33%
March 2022 cost of living index in zip code 62447: 84.0 (less than average, U.S. average is 100)
Land area: 59.8 sq. mi. Water area: 1.4 sq. mi.
Population density: 52 people per square mile
(very low).
OSM Map
General Map
Google Map
MSN Map
OSM Map
General Map
Google Map
MSN Map
OSM Map
General Map
Google Map
MSN Map
OSM Map
General Map
Google Map
MSN Map
Please wait while loading the map...
Real estate property taxes paid for housing units in 2022:
This zip code:
1.6% ($2,614)
Illinois:
2.0% ($4,912)
Median real estate property taxes paid for housing units with mortgages in 2022: $2,468 (1.6%) Median real estate property taxes paid for housing units with no mortgage in 2022: $2,940 (1.8%)
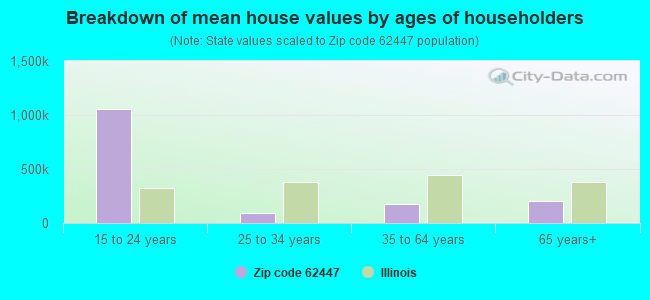
Estimated median house/condo value in 2022: $163,103
62447:
$163,103
Illinois:
$251,600
According to our research of Illinois and other state lists, there were 4 registered sex offenders living in 62447 zip code as of April 18, 2024. The ratio of all residents to sex offenders in zip code 62447 is 867 to 1. The ratio of registered sex offenders to all residents in this zip code is near the state average.
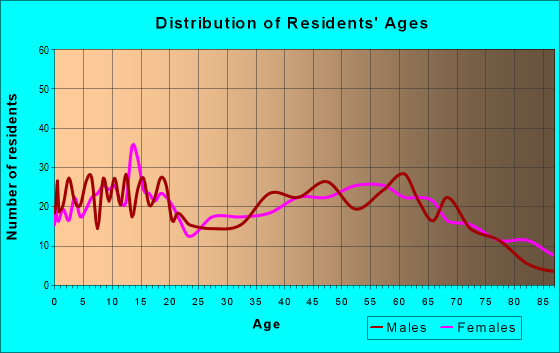
Median resident age:
This zip code:
43.6 years
Illinois median age:
39.1 years
Average household size:
This zip code:
2.4 people
Illinois:
2.4 people
Averages for the 2020 tax year for zip code 62447, filed in 2021:
Average Adjusted Gross Income (AGI) in 2020: $62,065 (Individual Income Tax Returns)
Here:
$62,065
State:
$82,626
Salary/wage: $49,438 (reported on 79.2% of returns)
Here:
$49,438
State:
$66,640
(% of AGI for various income ranges: 1180.6% for AGIs below $25k, 3278.2% for AGIs $25k-50k, 5688.2% for AGIs $50k-75k, 8042.3% for AGIs $75k-100k, 14128.6% for AGIs $100k-200k)
Taxable interest for individuals: $1,183 (reported on 38.9% of returns)
This zip code:
$1,183
Illinois:
$2,376
(% of AGI for various income ranges: 16.2% for AGIs below $25k, 42.5% for AGIs $25k-50k, 42.4% for AGIs $50k-75k, 30.0% for AGIs $75k-100k, 118.6% for AGIs $100k-200k)
Ordinary dividends: $3,210 (reported on 19.5% of returns)
Here:
$3,210
State:
$9,061
(% of AGI for various income ranges: 15.3% for AGIs below $25k, 42.5% for AGIs $25k-50k, 43.5% for AGIs $50k-75k, 90.0% for AGIs $75k-100k, 408.6% for AGIs $100k-200k)
Net capital gain/loss in AGI: +$7,640 (reported on 16.8% of returns)
Here:
+$7,640
State:
+$31,684
(% of AGI for various income ranges: 2.2% for AGIs below $25k, 28.6% for AGIs $25k-50k, 77.6% for AGIs $50k-75k, 48.5% for AGIs $75k-100k, 389.3% for AGIs $100k-200k)
Profit/loss from business: +$8,681 (reported on 14.1% of returns)
Here:
+$8,681
State:
+$12,175
(% of AGI for various income ranges: 42.2% for AGIs below $25k, 174.6% for AGIs $25k-50k, 167.6% for AGIs $50k-75k, 264.6% for AGIs $75k-100k, 407.1% for AGIs $100k-200k)
Taxable individual retirement arrangement distribution: $13,433 (reported on 12.1% of returns)
62447:
$13,433
Illinois:
$21,613
(% of AGI for various income ranges: 70.3% for AGIs below $25k, 118.6% for AGIs $25k-50k, 197.6% for AGIs $50k-75k, 333.8% for AGIs $75k-100k, 779.3% for AGIs $100k-200k)
Total itemized deductions: $35,250 (reported on 4.0% of returns)
Here:
$35,250
State:
$34,948
(% of AGI for various income ranges: 727.1% for AGIs $50k-75k, 627.9% for AGIs $100k-200k)
Charity contributions: $10,400 (reported on 2.0% of returns)
Here:
$10,400
State:
$13,122
(% of AGI for various income ranges: 240.0% for AGIs $75k-100k)
Taxes paid: $5,617 (reported on 4.0% of returns)
62447:
$5,617
State:
$8,563
(% of AGI for various income ranges: 87.1% for AGIs $50k-75k, 135.0% for AGIs $100k-200k)
Earned income credit: $2,311 (reported on 12.1% of returns)
Here:
$2,311
State:
$2,311
(% of AGI for various income ranges: 85.0% for AGIs below $25k, 51.4% for AGIs $25k-50k)
Percentage of individuals using paid preparers for their 2020 taxes: 96.6%
Here:
97%
State:
93%
(% for various income ranges: 95.7% for AGIs below $25k, 97.3% for AGIs $25k-50k, 95.7% for AGIs $50k-75k, 100.0% for AGIs $75k-100k, 95.7% for AGIs $100k-200k, 100.0% for AGIs over 200k)
Averages for the 2012 tax year for zip code 62447, filed in 2013:
Average Adjusted Gross Income (AGI) in 2012: $50,226 (Individual Income Tax Returns)
Here:
$50,226
State:
$68,058
Salary/wage: $39,421 (reported on 82.8% of returns)
Here:
$39,421
State:
$55,396
(% of AGI for various income ranges: 71.9% for AGIs below $25k, 72.3% for AGIs $25k-50k, 72.0% for AGIs $50k-75k, 63.4% for AGIs $75k-100k, 55.8% for AGIs $100k-200k)
Taxable interest for individuals: $1,039 (reported on 42.8% of returns)
This zip code:
$1,039
Illinois:
$1,969
(% of AGI for various income ranges: 1.1% for AGIs below $25k, 1.1% for AGIs $25k-50k, 0.6% for AGIs $50k-75k, 0.6% for AGIs $75k-100k, 1.1% for AGIs $100k-200k)
Ordinary dividends: $2,321 (reported on 19.3% of returns)
Here:
$2,321
State:
$7,786
(% of AGI for various income ranges: 0.4% for AGIs below $25k, 0.7% for AGIs $25k-50k, 0.9% for AGIs $50k-75k, 0.7% for AGIs $75k-100k, 1.2% for AGIs $100k-200k)
Net capital gain/loss in AGI: +$11,542 (reported on 13.1% of returns)
Here:
+$11,542
State:
+$22,183
(% of AGI for various income ranges: 0.3% for AGIs $50k-75k, 1.0% for AGIs $75k-100k, 8.2% for AGIs $100k-200k)
Profit/loss from business: +$6,752 (reported on 15.9% of returns)
Here:
+$6,752
State:
+$12,903
(% of AGI for various income ranges: 3.9% for AGIs below $25k, 2.6% for AGIs $25k-50k, 2.3% for AGIs $50k-75k, 2.0% for AGIs $75k-100k, 1.4% for AGIs $100k-200k)
Taxable individual retirement arrangement distribution: $10,341 (reported on 11.7% of returns)
62447:
$10,341
Illinois:
$17,929
(% of AGI for various income ranges: 2.6% for AGIs below $25k, 2.4% for AGIs $25k-50k, 2.8% for AGIs $50k-75k, 3.1% for AGIs $75k-100k, 1.8% for AGIs $100k-200k)
Total itemized deductions: $17,800 (19% of AGI, reported on 20.7% of returns)
Here:
$17,800
State:
$26,433
Here:
19.1% of AGI
State:
19.2% of AGI
(% of AGI for various income ranges: 4.9% for AGIs below $25k, 7.6% for AGIs $25k-50k, 5.5% for AGIs $50k-75k, 7.0% for AGIs $75k-100k, 9.3% for AGIs $100k-200k)
Charity contributions: $3,800 (reported on 14.5% of returns)
Here:
$3,800
State:
$4,525
(% of AGI for various income ranges: 1.1% for AGIs $25k-50k, 0.7% for AGIs $50k-75k, 1.0% for AGIs $75k-100k, 1.7% for AGIs $100k-200k)
Taxes paid: $7,077 (reported on 20.7% of returns)
62447:
$7,077
State:
$11,968
(% of AGI for various income ranges: 1.2% for AGIs below $25k, 1.8% for AGIs $25k-50k, 1.8% for AGIs $50k-75k, 2.6% for AGIs $75k-100k, 4.8% for AGIs $100k-200k)
Earned income credit: $2,221 (reported on 16.6% of returns)
Here:
$2,221
State:
$2,349
(% of AGI for various income ranges: 5.8% for AGIs below $25k, 1.2% for AGIs $25k-50k)
Percentage of individuals using paid preparers for their 2012 taxes: 66.2%
Here:
66%
State:
57%
(% for various income ranges: 59.3% for AGIs below $25k, 64.7% for AGIs $25k-50k, 68.0% for AGIs $50k-75k, 68.8% for AGIs $75k-100k, 87.5% for AGIs $100k-200k)
Averages for the 2004 tax year for zip code 62447, filed in 2005:
Average Adjusted Gross Income (AGI) in 2004: $37,002 (Individual Income Tax Returns)
Here:
$37,002
State:
$54,625
Salary/wage: $30,621 (reported on 84.0% of returns)
Here:
$30,621
State:
$46,811
(% of AGI for various income ranges: 115.0% for AGIs below $10k, 69.2% for AGIs $10k-25k, 73.0% for AGIs $25k-50k, 74.0% for AGIs $50k-75k, 77.5% for AGIs $75k-100k, 40.6% for AGIs over 100k)
Taxable interest for individuals: $1,191 (reported on 48.0% of returns)
This zip code:
$1,191
Illinois:
$2,101
(% of AGI for various income ranges: 4.8% for AGIs below $10k, 2.4% for AGIs $10k-25k, 1.2% for AGIs $25k-50k, 2.0% for AGIs $50k-75k, 1.1% for AGIs $75k-100k, 0.7% for AGIs over 100k)
Taxable dividends: $1,120 (reported on 23.9% of returns)
Here:
$1,120
State:
$4,306
(% of AGI for various income ranges: 1.1% for AGIs below $10k, 0.7% for AGIs $10k-25k, 0.8% for AGIs $25k-50k, 0.7% for AGIs $50k-75k, 0.6% for AGIs $75k-100k, 0.8% for AGIs over 100k)
Net capital gain/loss: +$1,415 (reported on 14.9% of returns)
Here:
+$1,415
State:
+$17,321
(% of AGI for various income ranges: -1.8% for AGIs below $10k, -0.2% for AGIs $10k-25k, 0.0% for AGIs $25k-50k, 1.0% for AGIs $50k-75k, 0.6% for AGIs $75k-100k, 1.7% for AGIs over 100k)
Profit/loss from business: +$5,127 (reported on 14.6% of returns)
Here:
+$5,127
State:
+$11,771
(% of AGI for various income ranges: 3.2% for AGIs below $10k, 2.8% for AGIs $10k-25k, 3.3% for AGIs $25k-50k, 2.6% for AGIs $50k-75k, 0.6% for AGIs $75k-100k)
Profit/loss from farming: +$8,450 (reported on 6.9% of returns)
Here:
+$8,450
State:
+$2,327
(% of AGI for various income ranges: -4.0% for AGIs below $10k, 0.6% for AGIs $10k-25k, 1.4% for AGIs $25k-50k, 0.2% for AGIs $50k-75k, 6.6% for AGIs $75k-100k)
IRA payment deduction: $2,438 (reported on 2.0% of returns)
62447:
$2,438
Illinois:
$3,087
Total itemized deductions: $15,018 (20% of AGI, reported on 17.6% of returns)
Here:
$15,018
State:
$20,239
Here:
20.0% of AGI
State:
19.5% of AGI
(% of AGI for various income ranges: 7.2% for AGIs $10k-25k, 6.6% for AGIs $25k-50k, 6.7% for AGIs $50k-75k, 9.6% for AGIs $75k-100k, 7.0% for AGIs over 100k)
Charity contributions deductions: $3,509 (4% of AGI, reported on 14.9% of returns)
Here:
$3,509
State:
$3,719
Here:
4.4% of AGI
State:
3.4% of AGI
(% of AGI for various income ranges: 0.7% for AGIs $10k-25k, 1.0% for AGIs $25k-50k, 1.5% for AGIs $50k-75k, 1.6% for AGIs $75k-100k, 2.4% for AGIs over 100k)
Total tax: $4,376 (reported on 73.4% of returns)
62447:
$4,376
State:
$9,882
(% of AGI for various income ranges: 2.4% for AGIs below $10k, 3.6% for AGIs $10k-25k, 6.5% for AGIs $25k-50k, 8.5% for AGIs $50k-75k, 10.5% for AGIs $75k-100k, 14.9% for AGIs over 100k)
Earned income credit: $1,711 (reported on 16.1% of returns)
Here:
$1,711
State:
$1,788
Percentage of individuals using paid preparers for their 2004 taxes: 66.4%
Here:
66%
State:
61%
(% for various income ranges: 57.9% for AGIs below $10k, 65.0% for AGIs $10k-25k, 70.8% for AGIs $25k-50k, 69.5% for AGIs $50k-75k, 69.6% for AGIs $75k-100k, 80.0% for AGIs over 100k)
Likely homosexual households (counted as self-reported same-sex unmarried-partner households)
Lesbian couples: 0.0% of all households
Gay men: 0.6% of all households
Household received Food Stamps/SNAP in the past 12 months: 142 Household did not receive Food Stamps/SNAP in the past 12 months: 1,098
Women who had a birth in the past 12 months: 32 (28 now married, 3 unmarried) Women who did not have a birth in the past 12 months: 572 (310 now married, 258 unmarried)
Housing units in zip code 62447 with a mortgage: 502 (28 second mortgage, 28 both second mortgage and home equity loan) Median monthly owner costs for units with a mortgage: $1,282 Median monthly owner costs for units without a mortgage: $679
Residents with income below the poverty level in 2022:
This zip code:
5.0%
Whole state:
11.9%
Residents with income below 50% of the poverty level in 2022:
This zip code:
2.0%
Whole state:
5.7%
Median number of rooms in houses and condos:
Here:
6.1
State:
6.4
Median number of rooms in apartments:
Here:
4.7
State:
4.1
Notable locations in this zip code not listed on our city pages
Churches in zip code 62447 include: Mount Zion Baptist Church (A), Brush Creek Church (B), First Christian Church of Neoga (C), Grace United Methodist Church (D), Saint Patricks Church (E). Display/hide their locations on the map
Cemeteries: Neoga Cemetery (1), Raney Cemetery (2), Illinois Central Railroad Cemetery (3), Lockhart Cemetery (4), Illinois Central Pioneer Cemetery (5), Drummond Cemetery (6), Saint Patick's Cemetery (7). Display/hide their locations on the map
Streams, rivers, and creeks: Copperas Creek (A), Clear Creek (B), Buck Branch (C), Brush Creek (D), Miller Creek (E). Display/hide their locations on the map
In group quarters: 69 (-1 institutionalized population)
Size of family households: 366 2-persons, 237 3-persons, 176 4-persons, 64 5-persons, 3 6-persons, 3 7-or-more-persons
Size of nonfamily households: 299 1-person, 94 2-persons
501 married couples with children.
79 single-parent households (49 men, 30 women).
99.5% of residents of 62447 zip code speak English at home.
0.3% of residents speak other Indo-European language at home (100% well).
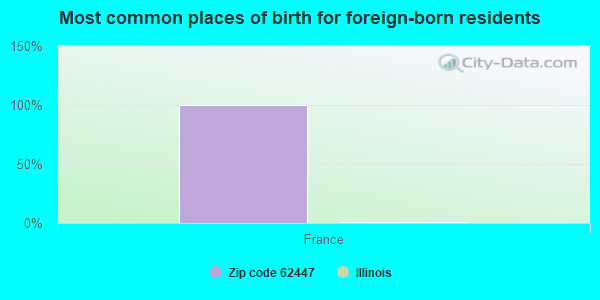
Foreign born population: 3 (0.1%) (100.0% of them are naturalized citizens)
This zip code:
0.1%
Whole state:
14.4%
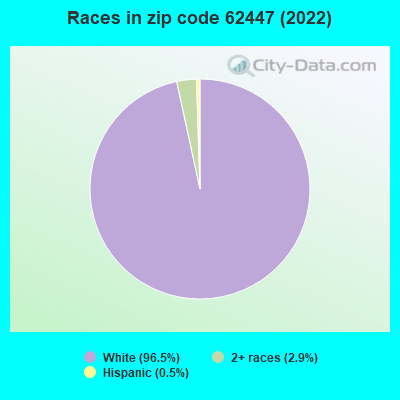
100%France
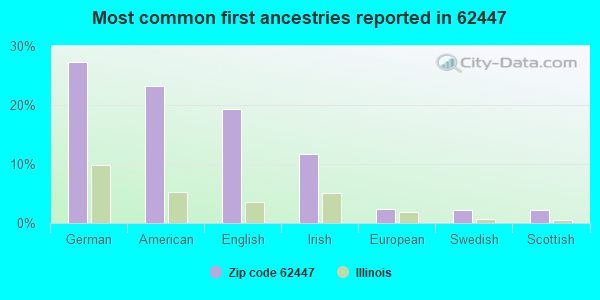
27%German
23%American
19%English
12%Irish
2%European
2%Swedish
2%Scottish
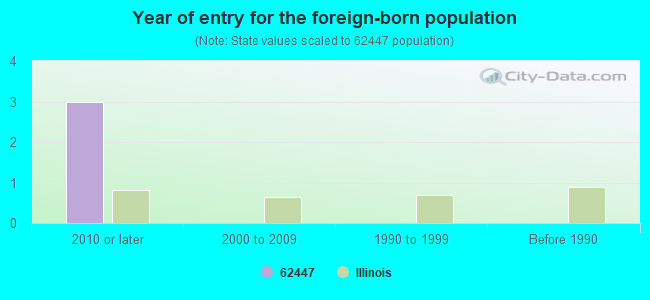
Year of entry for the foreign-born population
32010 or later
02000 to 2009
01990 to 1999
0Before 1990
Facilities with environmental interests located in this zip code:
NEOGA STP (533 CHESTNUT AVENUE in NEOGA, IL)
STATE MASTER (Illinois EPA Project) - National Pollutant Discharge Elimination System Permit National Pollutant Discharge Elimination System NON-MAJOR (Tracking pollutant discharge elimination systems) - permit National Pollutant Discharge Elimination System NON-MAJOR (Tracking pollutant discharge elimination systems) - permit Business SIC classification: SEWERAGE SYSTEMS Alternative names: NEOGA, CITY OF, NEOGA STP, CITY OF
RELIANT ENERGY POWER GENERATION, INC. (CENTERLINE ROAD 344A in NEOGA, IL)
STATE MASTER (Illinois EPA Project) - AIR PROGRAM AIR MAJOR (AIRS/AFS) AIR PROGRAM (Clean Air Markets Division Business System) CRITERIA AND HAZARDOUS AIR POLLUTANT INVENTORY (Inventory of air pollution sources) Business SIC classification: ELECTRIC SERVICES Alternative names: RELIANT ENERGY SHELBY COUNTY, SHELBY ENERGY CENTER, SHELBY ENERGY CENTER
NEOGA ELEM SCHOOL (P O BOX 580 in NEOGA, IL)
(National Center for Education Statistics) - STATE ID-1101800302002 Organizations: NEOGA COMM UNIT SCHOOL DIST 3 (SCHOOL DISTRICT)
NEOGA JR HIGH SCHOOL (P O BOX 280 in NEOGA, IL)
(National Center for Education Statistics) - STATE ID-1101800301001 Organizations: NEOGA COMM UNIT SCHOOL DIST 3 (SCHOOL DISTRICT)
NEOGA MIDDLE SCHOOL (P O BOX 310 in NEOGA, IL)
(National Center for Education Statistics) - STATE ID-1101800301002 Organizations: NEOGA COMM UNIT SCHOOL DIST 3 (SCHOOL DISTRICT)
NEOGA SR HIGH SCHOOL (P O BOX 280 in NEOGA, IL)
(National Center for Education Statistics) - STATE ID-1101800300001 Organizations: NEOGA COMM UNIT SCHOOL DIST 3 (SCHOOL DISTRICT)
PIONEER ELEM SCHOOL (P O BOX 580 in NEOGA, IL)
(National Center for Education Statistics) - STATE ID-1101800302004 Organizations: NEOGA COMM UNIT SCHOOL DIST 3 (SCHOOL DISTRICT)
ROYSTER-CLARK AGRIBUSINESS (1070 NORTH ROUTE 45 in NEOGA, IL)
ENFORCEMENT/COMPLIANCE ACTIVITY (Integrated Compliance Information System) COMMUNITY WATER SYSTEM (SDWIS) - SDWIS-IL0350150 15038, WATER TREATMENT PLANT, SDWIS-IL0350150 15039,
ILDOT STA 6016 PLUS 86 TO 5836 PLUS 11 (FAI 57 SE AND SW OF NEOGA in NEOGA, IL)
(Resource Conservation and Recovery Act (tracking hazardous waste))
NEOGA C.U.S.D. #3 (PO BOX 280 in NEOGA, IL)
COMPLIANCE ACTIVITY (Tracking inspections of insecticide, fungicide, and rodenticide, and toxic substances)
Housing units lacking complete plumbing facilities: 1.1% Housing units lacking complete kitchen facilities: 1.2%
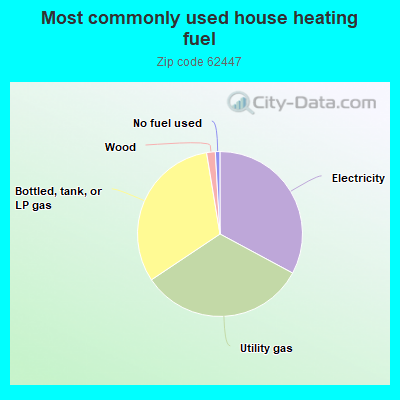
32.8%Electricity
32.7%Utility gas
31.7%Bottled, tank, or LP gas
1.7%Wood
0.9%No fuel used
Population in 1990: 3,494. Population change in the 1990s: +190 (+5.4%).
Place of birth for U.S.-born residents:
This state: 2,761
Northeast: 23
Midwest: 246
South: 45
West: 34
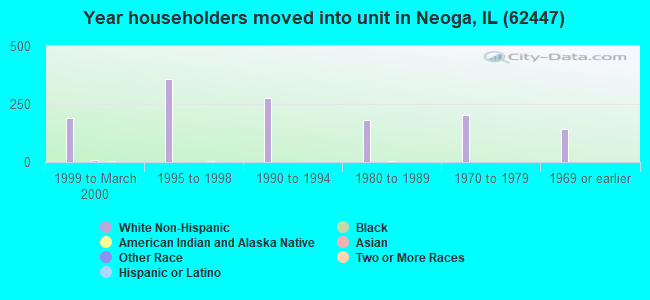
62% of the 62447 zip code residents lived in the same house 5 years ago. Out of people who lived in different houses, 37% lived in this county. Out of people who lived in different counties, 50% lived in Illinois.
85% of the 62447 zip code residents lived in the same house 1 year ago. Out of people who lived in different houses, 57% moved from this county. Out of people who lived in different houses, 39% moved from different county within same state. Out of people who lived in different houses, 3% moved from different state.
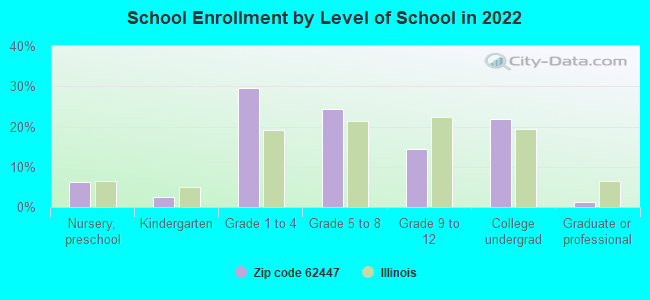
Private vs. public school enrollment:
Students in private schools in grades 1 to 8 (elementary and middle school): 64
Here:
18.1%
Illinois:
13.3%
Students in private schools in grades 9 to 12 (high school):
Here:
0.0%
Illinois:
9.9%
Students in private undergraduate colleges: 8
Here:
6.1%
Illinois:
27.4%
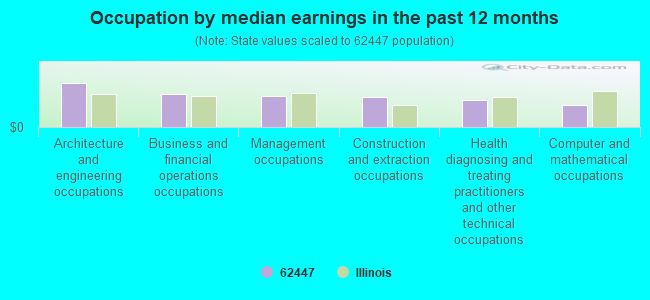
Occupation by median earnings in the past 12 months ($)
106,631Architecture and engineering occupations
79,262Business and financial operations occupations
75,831Management occupations
73,863Construction and extraction occupations
65,881Health diagnosing and treating practitioners and other technical occupations
53,502Computer and mathematical occupations
Companies with federal contracts located in this zip code:
ELECTROMAGNETICS AND ELECTRONI (513 MAPLE ST in NEOGA, IL; small business)
$100,000 with Air Force for Defense Missile and Space Systems -- Operational Systems Development (R&D). Signed on 2006-04-07. Completion date: 2007-01-08.
Top industries in this zip code by the number of employees in 2005:
Health Care and Social Assistance: Nursing Care Facilities (50-99 employees: 1 establishment)
Finance and Insurance: Commercial Banking (10-19: 1, 5-9: 1)
Health Care and Social Assistance: Offices of Physicians (except Mental Health Specialists) (10-19: 1)
Educational Services: Elementary and Secondary Schools (10-19: 1)
People in group quarters in 2010:
66 people in nursing facilities/skilled-nursing facilities
People in group quarters in 2000:
63 people in nursing homes
Fatal accident statistics in 2013:
Fatal accident count: 2
Vehicles involved in fatal accidents: 3
Fatal accidents caused by drunken drivers: 1
Fatalities: 2
Persons involved in fatal accidents: 4
Pedestrians involved in fatal accidents: 0
Fatal accident statistics in 2012:
Fatal accident count: 1
Vehicles involved in fatal accidents: 2
Fatal accidents caused by drunken drivers: 0
Fatalities: 1
Persons involved in fatal accidents: 5
Pedestrians involved in fatal accidents: 0
2002 - 2018 National Fire Incident Reporting System (NFIRS) incidents
According to the data from the years 2002 - 2018 the average number of fires per year is 22. The highest number of reported fire incidents - 34 took place in 2010, and the least - 12 in 2002. The data has a growing trend.
When looking into fire subcategories, the most incidents belonged to: Outside Fires (39.1%), and Structure Fires (27.1%).
Fire incident types reported to NFIRS in Zip Code 62447
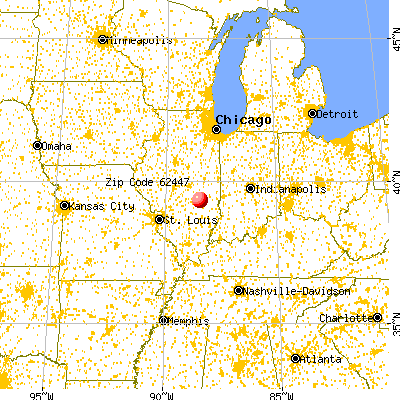


 Nearest zip codes: 62462, 62469, 61928, 62463, 62468, 62467.


 According to the data from the years 2002 - 2018 the average number of fires per year is 22. The highest number of reported fire incidents - 34 took place in 2010, and the least - 12 in 2002. The data has a growing trend.
 When looking into fire subcategories, the most incidents belonged to: Outside Fires (39.1%), and Structure Fires (27.1%).