Estimated zip code population in 2022: 5,210 Zip code population in 2010: 5,748 Zip code population in 2000: 5,630
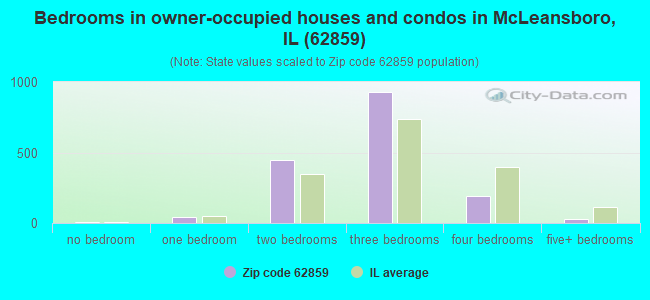
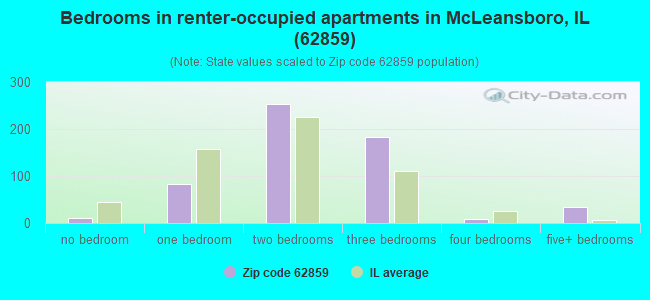
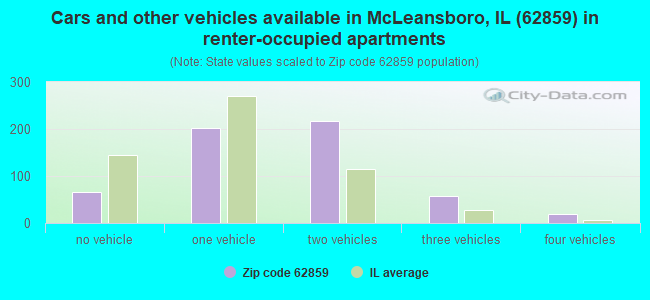
Houses and condos: 2,548 Renter-occupied apartments: 575
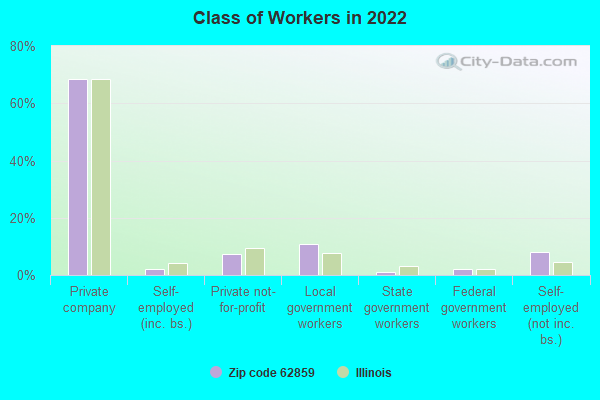
% of renters here:
26%
State:
33%
March 2022 cost of living index in zip code 62859: 83.6 (less than average, U.S. average is 100)
Land area: 208.2 sq. mi. Water area: 0.9 sq. mi.
Population density: 25 people per square mile
(very low).
OSM Map
General Map
Google Map
MSN Map
OSM Map
General Map
Google Map
MSN Map
OSM Map
General Map
Google Map
MSN Map
OSM Map
General Map
Google Map
MSN Map
Please wait while loading the map...
Real estate property taxes paid for housing units in 2022:
This zip code:
1.3% ($1,223)
Illinois:
2.0% ($4,912)
Median real estate property taxes paid for housing units with mortgages in 2022: $1,268 (1.6%) Median real estate property taxes paid for housing units with no mortgage in 2022: $1,159 (1.1%)
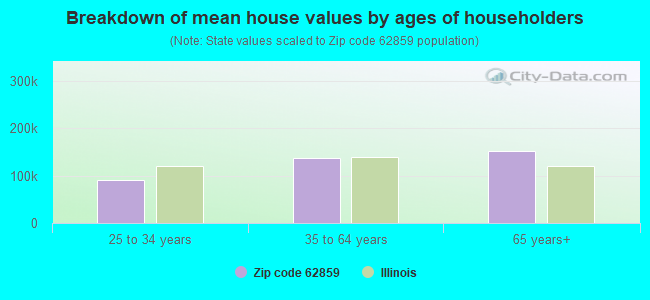
Estimated median house/condo value in 2022: $92,390
62859:
$92,390
Illinois:
$251,600
According to our research of Illinois and other state lists, there were 8 registered sex offenders living in 62859 zip code as of April 24, 2024. The ratio of all residents to sex offenders in zip code 62859 is 710 to 1. The ratio of registered sex offenders to all residents in this zip code is near the state average.
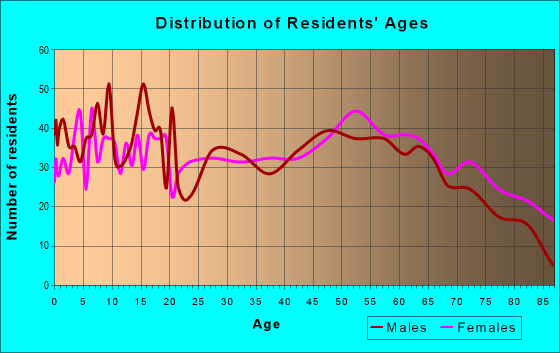
Median resident age:
This zip code:
43.1 years
Illinois median age:
39.1 years
Average household size:
This zip code:
2.3 people
Illinois:
2.4 people
Averages for the 2020 tax year for zip code 62859, filed in 2021:
Average Adjusted Gross Income (AGI) in 2020: $54,799 (Individual Income Tax Returns)
Here:
$54,799
State:
$82,626
Salary/wage: $44,344 (reported on 79.4% of returns)
Here:
$44,344
State:
$66,640
(% of AGI for various income ranges: 1202.1% for AGIs below $25k, 3401.7% for AGIs $25k-50k, 6290.0% for AGIs $50k-75k, 8239.4% for AGIs $75k-100k, 16606.7% for AGIs $100k-200k)
Taxable interest for individuals: $1,969 (reported on 27.5% of returns)
This zip code:
$1,969
Illinois:
$2,376
(% of AGI for various income ranges: 19.5% for AGIs below $25k, 34.0% for AGIs $25k-50k, 52.1% for AGIs $50k-75k, 113.5% for AGIs $75k-100k, 202.7% for AGIs $100k-200k)
Ordinary dividends: $3,049 (reported on 16.6% of returns)
Here:
$3,049
State:
$9,061
(% of AGI for various income ranges: 11.8% for AGIs below $25k, 48.3% for AGIs $25k-50k, 25.4% for AGIs $50k-75k, 84.1% for AGIs $75k-100k, 349.3% for AGIs $100k-200k)
Net capital gain/loss in AGI: +$5,995 (reported on 15.8% of returns)
Here:
+$5,995
State:
+$31,684
(% of AGI for various income ranges: 11.3% for AGIs below $25k, 13.4% for AGIs $25k-50k, 36.8% for AGIs $50k-75k, 156.5% for AGIs $75k-100k, 682.7% for AGIs $100k-200k)
Profit/loss from business: +$15,256 (reported on 15.8% of returns)
Here:
+$15,256
State:
+$12,175
(% of AGI for various income ranges: 72.5% for AGIs below $25k, 145.3% for AGIs $25k-50k, 341.8% for AGIs $50k-75k, 310.6% for AGIs $75k-100k, 740.7% for AGIs $100k-200k)
Taxable individual retirement arrangement distribution: $9,900 (reported on 8.9% of returns)
62859:
$9,900
Illinois:
$21,613
(% of AGI for various income ranges: 39.0% for AGIs below $25k, 50.6% for AGIs $25k-50k, 161.1% for AGIs $50k-75k, 254.1% for AGIs $75k-100k, 546.0% for AGIs $100k-200k)
Total itemized deductions: $37,000 (reported on 2.0% of returns)
Here:
$37,000
State:
$34,948
(% of AGI for various income ranges: 117.2% for AGIs below $25k, 756.7% for AGIs $100k-200k)
Charity contributions: $15,575 (reported on 1.6% of returns)
Here:
$15,575
State:
$13,122
(% of AGI for various income ranges: 415.3% for AGIs $100k-200k)
Taxes paid: $6,725 (reported on 1.6% of returns)
62859:
$6,725
State:
$8,563
(% of AGI for various income ranges: 14.9% for AGIs below $25k, 118.7% for AGIs $100k-200k)
Earned income credit: $2,300 (reported on 17.0% of returns)
Here:
$2,300
State:
$2,311
(% of AGI for various income ranges: 101.8% for AGIs below $25k, 73.4% for AGIs $25k-50k)
Percentage of individuals using paid preparers for their 2020 taxes: 96.8%
Here:
97%
State:
93%
(% for various income ranges: 95.5% for AGIs below $25k, 98.3% for AGIs $25k-50k, 97.5% for AGIs $50k-75k, 100.0% for AGIs $75k-100k, 93.1% for AGIs $100k-200k, 100.0% for AGIs over 200k)
Averages for the 2012 tax year for zip code 62859, filed in 2013:
Average Adjusted Gross Income (AGI) in 2012: $46,944 (Individual Income Tax Returns)
Here:
$46,944
State:
$68,058
Salary/wage: $37,666 (reported on 81.2% of returns)
Here:
$37,666
State:
$55,396
(% of AGI for various income ranges: 67.8% for AGIs below $25k, 76.5% for AGIs $25k-50k, 72.8% for AGIs $50k-75k, 74.4% for AGIs $75k-100k, 61.6% for AGIs $100k-200k, 31.8% for AGIs over 200k)
Taxable interest for individuals: $1,501 (reported on 31.8% of returns)
This zip code:
$1,501
Illinois:
$1,969
(% of AGI for various income ranges: 1.5% for AGIs below $25k, 1.1% for AGIs $25k-50k, 0.8% for AGIs $50k-75k, 0.5% for AGIs $75k-100k, 1.0% for AGIs $100k-200k, 1.4% for AGIs over 200k)
Ordinary dividends: $2,417 (reported on 17.1% of returns)
Here:
$2,417
State:
$7,786
(% of AGI for various income ranges: 1.6% for AGIs below $25k, 0.4% for AGIs $25k-50k, 1.0% for AGIs $50k-75k, 0.9% for AGIs $75k-100k, 0.9% for AGIs $100k-200k, 0.9% for AGIs over 200k)
Net capital gain/loss in AGI: +$9,923 (reported on 14.3% of returns)
Here:
+$9,923
State:
+$22,183
(% of AGI for various income ranges: 0.4% for AGIs below $25k, 0.7% for AGIs $25k-50k, 0.8% for AGIs $50k-75k, 1.4% for AGIs $75k-100k, 3.0% for AGIs $100k-200k, 13.4% for AGIs over 200k)
Profit/loss from business: +$11,771 (reported on 16.7% of returns)
Here:
+$11,771
State:
+$12,903
(% of AGI for various income ranges: 5.6% for AGIs below $25k, 2.3% for AGIs $25k-50k, 4.7% for AGIs $50k-75k, 3.2% for AGIs $75k-100k, 8.1% for AGIs $100k-200k)
Taxable individual retirement arrangement distribution: $9,840 (reported on 10.2% of returns)
62859:
$9,840
Illinois:
$17,929
(% of AGI for various income ranges: 3.4% for AGIs below $25k, 1.6% for AGIs $25k-50k, 2.7% for AGIs $50k-75k, 4.3% for AGIs $100k-200k)
Total itemized deductions: $19,803 (18% of AGI, reported on 15.9% of returns)
Here:
$19,803
State:
$26,433
Here:
18.3% of AGI
State:
19.2% of AGI
(% of AGI for various income ranges: 4.6% for AGIs below $25k, 3.9% for AGIs $25k-50k, 5.3% for AGIs $50k-75k, 8.4% for AGIs $75k-100k, 8.6% for AGIs $100k-200k, 9.6% for AGIs over 200k)
Charity contributions: $6,388 (reported on 10.6% of returns)
Here:
$6,388
State:
$4,525
(% of AGI for various income ranges: 0.7% for AGIs $25k-50k, 1.3% for AGIs $50k-75k, 2.2% for AGIs $75k-100k, 2.0% for AGIs $100k-200k, 2.1% for AGIs over 200k)
Taxes paid: $6,954 (reported on 15.9% of returns)
62859:
$6,954
State:
$11,968
(% of AGI for various income ranges: 0.6% for AGIs below $25k, 0.8% for AGIs $25k-50k, 1.4% for AGIs $50k-75k, 2.7% for AGIs $75k-100k, 4.2% for AGIs $100k-200k, 4.3% for AGIs over 200k)
Earned income credit: $2,094 (reported on 20.0% of returns)
Here:
$2,094
State:
$2,349
(% of AGI for various income ranges: 6.3% for AGIs below $25k, 1.2% for AGIs $25k-50k)
Percentage of individuals using paid preparers for their 2012 taxes: 78.8%
Here:
79%
State:
57%
(% for various income ranges: 76.9% for AGIs below $25k, 76.7% for AGIs $25k-50k, 82.1% for AGIs $50k-75k, 84.2% for AGIs $75k-100k, 84.2% for AGIs $100k-200k, 75.0% for AGIs over 200k)
Averages for the 2004 tax year for zip code 62859, filed in 2005:
Average Adjusted Gross Income (AGI) in 2004: $33,816 (Individual Income Tax Returns)
Here:
$33,816
State:
$54,625
Salary/wage: $29,747 (reported on 81.7% of returns)
Here:
$29,747
State:
$46,811
(% of AGI for various income ranges: 80.3% for AGIs below $10k, 67.1% for AGIs $10k-25k, 78.3% for AGIs $25k-50k, 83.0% for AGIs $50k-75k, 74.8% for AGIs $75k-100k, 44.0% for AGIs over 100k)
Taxable interest for individuals: $1,896 (reported on 46.3% of returns)
This zip code:
$1,896
Illinois:
$2,101
(% of AGI for various income ranges: 8.6% for AGIs below $10k, 4.6% for AGIs $10k-25k, 2.6% for AGIs $25k-50k, 1.4% for AGIs $50k-75k, 2.7% for AGIs $75k-100k, 1.6% for AGIs over 100k)
Taxable dividends: $1,206 (reported on 20.6% of returns)
Here:
$1,206
State:
$4,306
(% of AGI for various income ranges: 1.5% for AGIs below $10k, 1.0% for AGIs $10k-25k, 0.7% for AGIs $25k-50k, 0.4% for AGIs $50k-75k, 0.7% for AGIs $75k-100k, 0.9% for AGIs over 100k)
Net capital gain/loss: +$9,463 (reported on 14.1% of returns)
Here:
+$9,463
State:
+$17,321
(% of AGI for various income ranges: 1.3% for AGIs below $10k, 1.0% for AGIs $10k-25k, 0.6% for AGIs $25k-50k, 0.9% for AGIs $50k-75k, 0.8% for AGIs $75k-100k, 19.5% for AGIs over 100k)
Profit/loss from business: +$7,842 (reported on 17.9% of returns)
Here:
+$7,842
State:
+$11,771
(% of AGI for various income ranges: 3.5% for AGIs below $10k, 4.8% for AGIs $10k-25k, 2.5% for AGIs $25k-50k, 2.9% for AGIs $50k-75k, 3.8% for AGIs $75k-100k, 8.7% for AGIs over 100k)
IRA payment deduction: $3,052 (reported on 2.5% of returns)
62859:
$3,052
Illinois:
$3,087
Total itemized deductions: $14,514 (22% of AGI, reported on 13.8% of returns)
Here:
$14,514
State:
$20,239
Here:
22.2% of AGI
State:
19.5% of AGI
(% of AGI for various income ranges: 5.4% for AGIs $10k-25k, 4.7% for AGIs $25k-50k, 6.7% for AGIs $50k-75k, 7.9% for AGIs $75k-100k, 6.6% for AGIs over 100k)
Charity contributions deductions: $4,515 (6% of AGI, reported on 10.0% of returns)
Here:
$4,515
State:
$3,719
Here:
6.3% of AGI
State:
3.4% of AGI
(% of AGI for various income ranges: 0.5% for AGIs $10k-25k, 1.1% for AGIs $25k-50k, 1.5% for AGIs $50k-75k, 2.0% for AGIs $75k-100k, 1.8% for AGIs over 100k)
Total tax: $4,325 (reported on 70.6% of returns)
62859:
$4,325
State:
$9,882
(% of AGI for various income ranges: 2.5% for AGIs below $10k, 3.7% for AGIs $10k-25k, 6.3% for AGIs $25k-50k, 8.7% for AGIs $50k-75k, 10.6% for AGIs $75k-100k, 18.3% for AGIs over 100k)
Earned income credit: $1,678 (reported on 17.8% of returns)
Here:
$1,678
State:
$1,788
Percentage of individuals using paid preparers for their 2004 taxes: 78.6%
Here:
79%
State:
61%
(% for various income ranges: 75.4% for AGIs below $10k, 80.2% for AGIs $10k-25k, 78.9% for AGIs $25k-50k, 79.9% for AGIs $50k-75k, 80.2% for AGIs $75k-100k, 80.0% for AGIs over 100k)
Household received Food Stamps/SNAP in the past 12 months: 345 Household did not receive Food Stamps/SNAP in the past 12 months: 1,881
Women who had a birth in the past 12 months: 26 (25 now married, 0 unmarried) Women who did not have a birth in the past 12 months: 1,095 (481 now married, 611 unmarried)
Housing units in zip code 62859 with a mortgage: 563 (12 second mortgage, 12 both second mortgage and home equity loan) Houses without a mortgage: 45
Median monthly owner costs for units with a mortgage: $1,018 Median monthly owner costs for units without a mortgage: $512
Residents with income below the poverty level in 2022:
This zip code:
10.9%
Whole state:
11.9%
Residents with income below 50% of the poverty level in 2022:
This zip code:
5.8%
Whole state:
5.7%
Median number of rooms in houses and condos:
Here:
5.9
State:
6.4
Median number of rooms in apartments:
Here:
4.4
State:
4.1
Notable locations in this zip code not listed on our city pages
Notable locations in zip code 62859: Zinnia Knoll Picnic Area (A), Twin Oaks Picnic Area (B), Sunrise Point Picnic Area (C), Shady Rest Picnic Area (D), Rocky Point Picnic Area (E), Piney Wood Camping Area (F), Persimmon Ridge Picnic Area (G), McLeansboro Junction (H), Lakeside View Picnic Area (I), Kiwanis Point Picnic Area (J), Jackies Giant Oak Picnic Area (K), Hickory Hill Picnic Area (L), Green Acre Picnic Area (M), Catfish Corner Picnic Area (N), Ash Grove Picnic Area (O), McLeansboro Golf Club (P), McCoy Memorial Library (Q), Hamilton County Courthouse (R), Flannigan Townhall (S), McLeansboro Fire Department (T). Display/hide their locations on the map
Churches in zip code 62859 include: Albion Church (A), Antioch Church (B), Oliver Church (C), Pleasant Grove Church (D), Blooming Grove Church (E), Pleasant Union Church (F), Braden Valley Church (G), Brush Harbor Church (H), Concord Church (I). Display/hide their locations on the map
Cemeteries: Arterberry Cemetery (1), Atchisson Cemetery (2), Webb Cemetery (3), Bright Cemetery (4), Independent Order of Oddfellows Cemetery (5), Cartwright Cemetery (6), Hutson Cemetery (7). Display/hide their locations on the map
Reservoirs: L P Dolan Lake (A), Lake McLeansboro (B), Lake Helen (C), John Goin Lake (D), Main Lake (E), Centerville Mens Club Lake (F), Runoff Collection Pond (G). Display/hide their locations on the map
Streams, rivers, and creeks: Bear Creek (A), Middle Creek (B), Mayberry Branch (C), Riley Creek (D), Lick Creek (E), LaKey Creek (F), Hogg Creek (G), Wolf Creek (H), Greasy Creek (I). Display/hide their locations on the map
In group quarters: 111 (-1 institutionalized population)
Size of family households: 640 2-persons, 324 3-persons, 269 4-persons, 89 5-persons, 24 6-persons, 2 7-or-more-persons
Size of nonfamily households: 688 1-person, 100 2-persons, 85 3-persons
692 married couples with children.
256 single-parent households (173 men, 83 women).
98.3% of residents of 62859 zip code speak English at home.
0.9% of residents speak Spanish at home (43% very well, 45% well, 13% not at all).
0.1% of residents speak other Indo-European language at home (100% very well).
0.6% of residents speak Asian or Pacific Island language at home (100% very well).
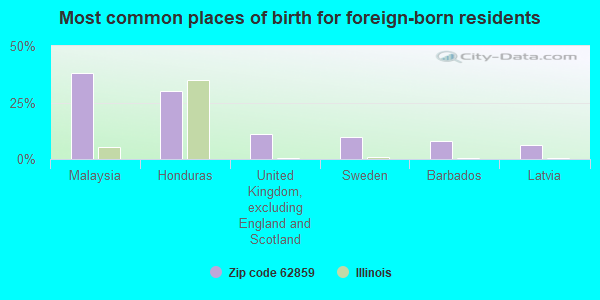
Foreign born population: 63 (1.2%) (100.0% of them are naturalized citizens)
This zip code:
1.2%
Whole state:
14.4%
38%Malaysia
30%Honduras
11%United Kingdom, excluding England and Scotland
10%Sweden
8%Barbados
6%Latvia
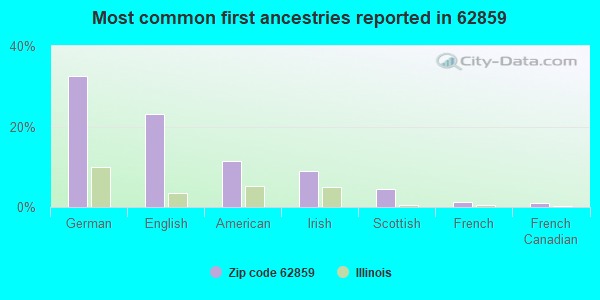
33%German
23%English
11%American
9%Irish
5%Scottish
1%French
1%French Canadian
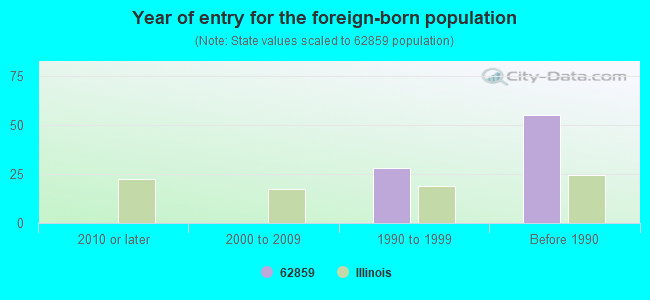
Year of entry for the foreign-born population
02010 or later
02000 to 2009
281990 to 1999
55Before 1990
Major facilities with environmental interests located in this zip code:
MCLEANSBORO POWER PLANT (305 W MARKET in MCLEANSBORO, IL)
STATE MASTER (Illinois EPA Project) - AIR PROGRAM STATE MASTER (Illinois EPA Project) - SOLID WASTE PROGRAM AIR SYNTHETIC MINOR (AIRS/AFS) AIR PROGRAM (Clean Air Markets Division Business System) CRITERIA AND HAZARDOUS AIR POLLUTANT INVENTORY (Inventory of air pollution sources) Business SIC classification: ELECTRIC SERVICES Alternative names: CITY OF MCLEANSBORO, MCLEANSBORO, CITY POWER PLANT
MCLEANSBORO STP (AIRPORT ROAD in MCLEANSBORO, IL)
STATE MASTER (Illinois EPA Project) - National Pollutant Discharge Elimination System Permit, National Pollutant Discharge Elimination System NON-MAJOR (Tracking pollutant discharge elimination systems) - permit National Pollutant Discharge Elimination System NON-MAJOR (Tracking pollutant discharge elimination systems) - permit Business SIC classification: SEWERAGE SYSTEMS Alternative names: MCLEANSBORO, CITY OF, MCLEANSBORO STP, CITY OF, MCLEANSBORO STP, VILLAGE OF
HAMILTON MEMORIAL HOSPITAL (611 S MARSHALL AVE in MCLEANSBORO, IL)
STATE MASTER (Illinois EPA Project) - SOLID WASTE PROGRAM, AIR PROGRAM AIR MINOR (AIRS/AFS) Business SIC classification: GENERAL MEDICAL AND SURGICAL HOSPITALS
MCLEANSBORO TIMES LEADER (123 S JACKSON ST in MC LEANSBORO, IL)
STATE MASTER (Illinois EPA Project) - HAZARDOUS WASTE PROGRAM (Resource Conservation and Recovery Act (tracking hazardous waste)) Organizations: THOMSON NEWSPAPERS (CONTACT/OWNER)
CONAGRA INC D/B/A PEAVEY CO (PILLSBURY RD in MC LEANSBORO, IL)
STATE MASTER (Illinois EPA Project) - SOLID WASTE PROGRAM, AIR PROGRAM AIR MINOR (AIRS/AFS) CRITERIA AND HAZARDOUS AIR POLLUTANT INVENTORY (Inventory of air pollution sources) Business SIC classification: GRAIN AND FIELD BEANS
4 B HOG CREEK FARMS (RR 5 in MCLEANSBORO, IL)
STATE MASTER (Illinois EPA Project) - AIR PROGRAM AIR MINOR (AIRS/AFS) Business SIC classification: GENERAL FARMS, PRIMARILY LIVESTOCK AND ANIMAL SPECIALTIES
ASHLAND PIPE LINE CO (MCLEANSBORO TWP in MC LEANSBORO, IL)
STATE MASTER (Illinois EPA Project) - AIR PROGRAM AIR MINOR (AIRS/AFS) Business SIC classification: PETROLEUM BULK STATIONS AND TERMINALS Alternative names: ASHLAND PIPE LINE CO-RURAL HILL STATION
MCLEANSBORO THERMOGAS (R.R.#5 BOX 160 in MC LEANSBORO, IL)
STATE MASTER (Illinois EPA Project) - AIR PROGRAM AIR MINOR (AIRS/AFS) Business SIC classification: FARM SUPPLIES
CONSOLIDATION COAL CO (CONSOL) (RR #5 in MC LEANSBORO, IL)
STATE MASTER (Illinois EPA Project) - AIR PROGRAM AIR MINOR (AIRS/AFS) Business SIC classification: BITUMINOUS COAL UNDERGROUND MINING
RALPH DRAKE OIL CO (400 W MARKET in MCLEANSBORO, IL)
STATE MASTER (Illinois EPA Project) - HAZARDOUS WASTE PROGRAM Small Quantity Generators, between 100 kg and 1000 kg of hazardous waste/month (Resource Conservation and Recovery Act (tracking hazardous waste)) - notification Organizations: DRAKE RALPH OIL CO INC (CONTACT/OWNER)
HAMILTON COUNTY CONCRETE INC (242 NORTH OLLIE ROAD in MCLEANSBORO, IL)
AIR MINOR (AIRS/AFS) CRITERIA AND HAZARDOUS AIR POLLUTANT INVENTORY (Inventory of air pollution sources) National Pollutant Discharge Elimination System NON-MAJOR (Tracking pollutant discharge elimination systems) - permit Business SIC classification: READY-MIXED CONCRETE Business NAICS classification: READY-MIX CONCRETE MANUFACTURING. Organizations: HAMILTON COUNTY CONCRETE, INC. (CONTACT/OWNER)
HAMILTON COUNTY JR/SR HIGH SCHOOL (1 FOX LANE in MCLEANSBORO, IL)
(National Center for Education Statistics) - STATE ID-2503301000002 Organizations: HAMILTON CO C U SCHOOL DIST 10 (SCHOOL DISTRICT)
HAMILTON COUNTY JUNIOR HIGH SCH (501 E RANDOLPH ST in MCLEANSBORO, IL)
(National Center for Education Statistics) - STATE ID-2503301001001 Organizations: HAMILTON CO C U SCHOOL DIST 10 (SCHOOL DISTRICT)
Housing units lacking complete kitchen facilities: 1.7%
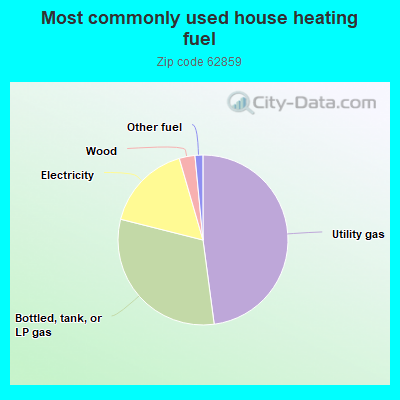
48.0%Utility gas
31.1%Bottled, tank, or LP gas
16.6%Electricity
3.0%Wood
1.5%Other fuel
Population in 1990: 4,357. Population change in the 1990s: +1,273 (+29.2%).
Place of birth for U.S.-born residents:
This state: 4,153
Northeast: 43
Midwest: 528
South: 232
West: 147
61% of the 62859 zip code residents lived in the same house 5 years ago. Out of people who lived in different houses, 59% lived in this county. Out of people who lived in different counties, 50% lived in Illinois.
93% of the 62859 zip code residents lived in the same house 1 year ago. Out of people who lived in different houses, 58% moved from this county. Out of people who lived in different houses, 18% moved from different county within same state. Out of people who lived in different houses, 23% moved from different state.
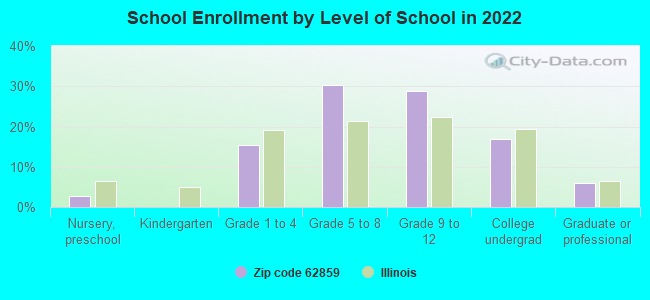
Private vs. public school enrollment:
Students in private schools in grades 1 to 8 (elementary and middle school): 14
Here:
2.8%
Illinois:
13.3%
Students in private schools in grades 9 to 12 (high school): 7
Here:
2.3%
Illinois:
9.9%
Students in private undergraduate colleges: 10
Here:
5.4%
Illinois:
27.4%
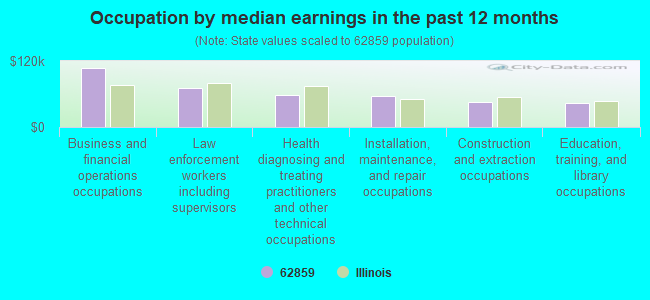
Occupation by median earnings in the past 12 months ($)
107,626Business and financial operations occupations
71,318Law enforcement workers including supervisors
58,868Health diagnosing and treating practitioners and other technical occupations
57,191Installation, maintenance, and repair occupations
46,347Construction and extraction occupations
43,845Education, training, and library occupations
Top industries in this zip code by the number of employees in 2005:
Health Care and Social Assistance: General Medical and Surgical Hospitals (100-249 employees: 1 establishment)
Health Care and Social Assistance: Nursing Care Facilities (50-99: 1)
Health Care and Social Assistance: Vocational Rehabilitation Services (50-99: 1)
Accommodation and Food Services: Limited-Service Restaurants (20-49: 2, 1-4: 1)
Other Services (except Public Administration): Religious Organizations (5-9: 1, 1-4: 16)
Health Care and Social Assistance: Residential Mental Retardation Facilities (10-19: 2, 5-9: 1)
Construction: Oil and Gas Pipeline and Related Structures Construction (20-49: 1)
Construction: Power and Communication Line and Related Structures Construction (20-49: 1)
People in group quarters in 2010:
77 people in nursing facilities/skilled-nursing facilities
40 people in group homes intended for adults
People in group quarters in 2000:
161 people in nursing homes
22 people in homes or halfway houses for drug/alcohol abuse
19 people in homes for the mentally retarded
Fatal accident statistics in 2014:
Fatal accident count: 1
Vehicles involved in fatal accidents: 1
Fatal accidents caused by drunken drivers: 1
Fatalities: 1
Persons involved in fatal accidents: 1
Pedestrians involved in fatal accidents: 0
Fatal accident statistics in 2013:
Fatal accident count: 1
Vehicles involved in fatal accidents: 1
Fatal accidents caused by drunken drivers: 1
Fatalities: 5
Persons involved in fatal accidents: 6
Pedestrians involved in fatal accidents: 0
2002 - 2018 National Fire Incident Reporting System (NFIRS) incidents
Based on the data from the years 2002 - 2018 the average number of fires per year is 29. The highest number of reported fire incidents - 49 took place in 2007, and the least - 13 in 2016. The data has a rising trend.
When looking into fire subcategories, the most incidents belonged to: Structure Fires (35.8%), and Outside Fires (35.2%).
Fire incident types reported to NFIRS in Zip Code 62859
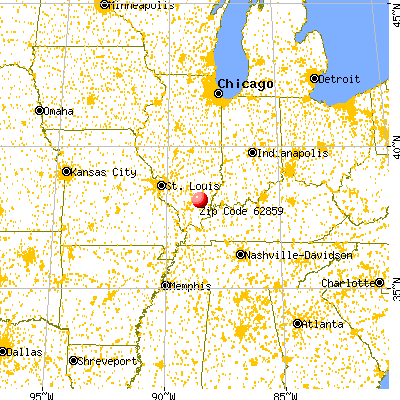


 Nearest zip codes: 62829, 62828, 62817, 62887, 62860, 62835.
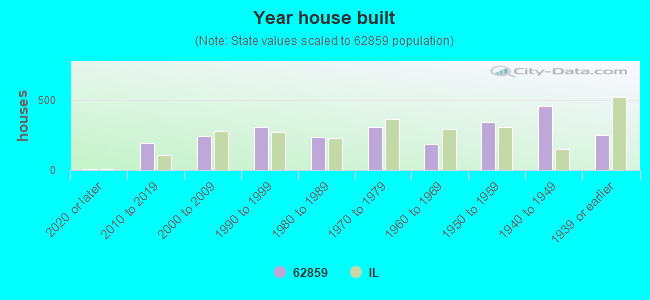


 Based on the data from the years 2002 - 2018 the average number of fires per year is 29. The highest number of reported fire incidents - 49 took place in 2007, and the least - 13 in 2016. The data has a rising trend.
 When looking into fire subcategories, the most incidents belonged to: Structure Fires (35.8%), and Outside Fires (35.2%).