Estimated zip code population in 2022: 1,847 Zip code population in 2010: 2,164 Zip code population in 2000: 2,122
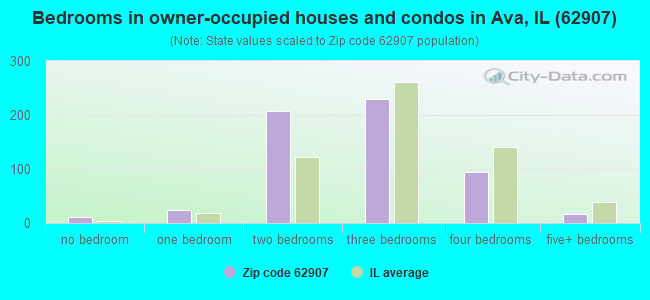
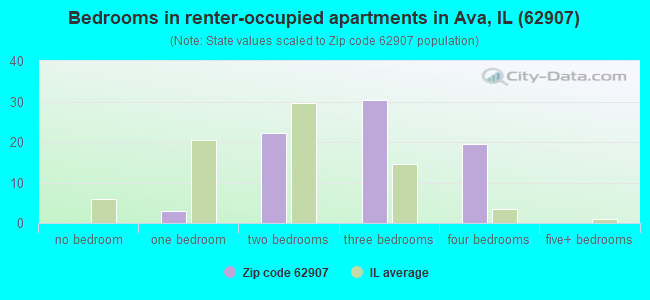
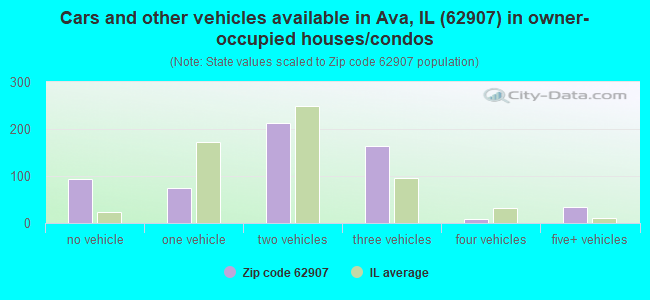
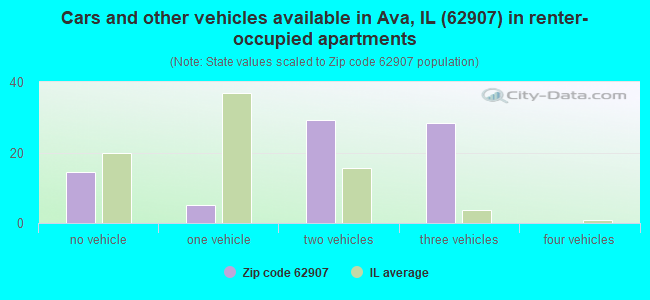
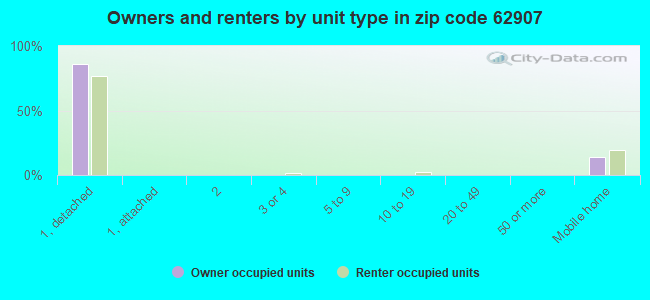
Houses and condos: 825 Renter-occupied apartments: 78
% of renters here:
12%
State:
33%
March 2022 cost of living index in zip code 62907: 84.1 (less than average, U.S. average is 100)
Land area: 92.2 sq. mi. Water area: 2.7 sq. mi.
Population density: 20 people per square mile
(very low).
OSM Map
General Map
Google Map
MSN Map
OSM Map
General Map
Google Map
MSN Map
OSM Map
General Map
Google Map
MSN Map
OSM Map
General Map
Google Map
MSN Map
Please wait while loading the map...
Real estate property taxes paid for housing units in 2022:
This zip code:
1.3% ($1,869)
Illinois:
2.0% ($4,912)
Median real estate property taxes paid for housing units with mortgages in 2022: $2,105 (1.3%) Median real estate property taxes paid for housing units with no mortgage in 2022: $1,758 (1.3%)
Business Search- 14 Million verified businesses
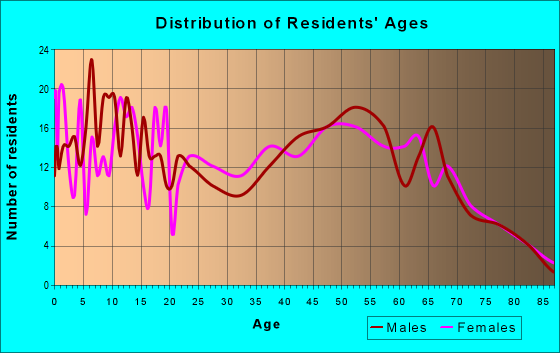
Males: 861
(46.6%)
Females: 985
(53.4%)
For population 25 years and over in 62907:
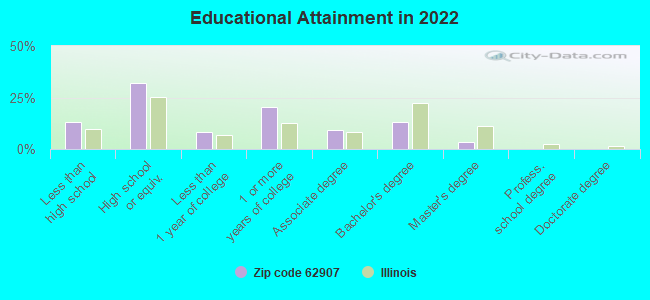
High school or higher: 84.8%
Bachelor's degree or higher: 16.7%
Graduate or professional degree: 3.7%
Unemployed: 2.0%
Mean travel time to work (commute): 23.6 minutes
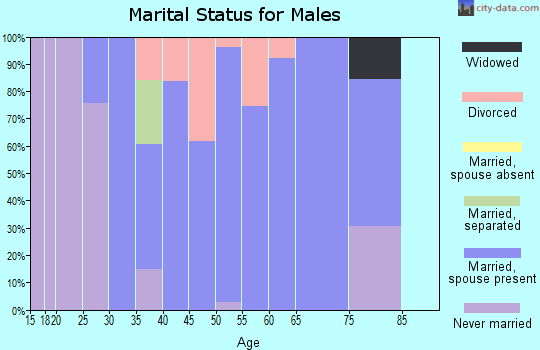
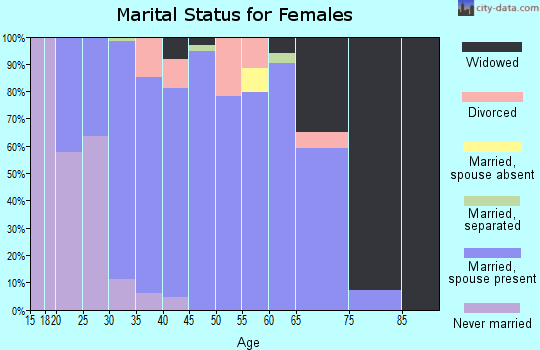
For population 15 years and over in 62907:
Never married: 25.2%
Now married: 56.4%
Separated: 0.4%
Widowed: 9.8%
Divorced: 8.3%
Zip code 62907 compared to state average:
Median house value below state average.
Unemployed percentage below state average.
Black race population percentage significantly below state average.
Hispanic race population percentage significantly below state average.
Foreign-born population percentage significantly below state average.
Renting percentage significantly below state average.
Length of stay since moving in significantly above state average.
Percentage of population with a bachelor's degree or higher significantly below state average.
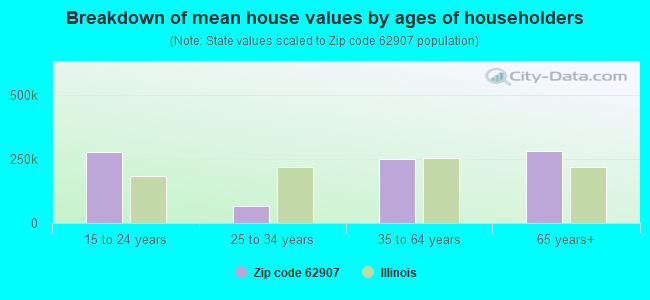
Estimated median house/condo value in 2022: $139,006
62907:
$139,006
Illinois:
$251,600
Median resident age:
This zip code:
36.6 years
Illinois median age:
39.1 years
Average household size:
This zip code:
2.8 people
Illinois:
2.4 people
Averages for the 2020 tax year for zip code 62907, filed in 2021:
Average Adjusted Gross Income (AGI) in 2020: $61,932 (Individual Income Tax Returns)
Here:
$61,932
State:
$82,626
Salary/wage: $50,263 (reported on 76.5% of returns)
Here:
$50,263
State:
$66,640
(% of AGI for various income ranges: 1227.4% for AGIs below $25k, 3750.7% for AGIs $25k-50k, 5334.5% for AGIs $50k-75k, 7261.2% for AGIs $75k-100k, 20068.9% for AGIs $100k-200k)
Taxable interest for individuals: $998 (reported on 44.9% of returns)
This zip code:
$998
Illinois:
$2,376
(% of AGI for various income ranges: 26.8% for AGIs below $25k, 34.0% for AGIs $25k-50k, 82.7% for AGIs $50k-75k, 56.2% for AGIs $75k-100k, 223.3% for AGIs $100k-200k)
Ordinary dividends: $1,905 (reported on 20.4% of returns)
Here:
$1,905
State:
$9,061
(% of AGI for various income ranges: 17.9% for AGIs below $25k, 59.3% for AGIs $25k-50k, 29.1% for AGIs $50k-75k, 58.8% for AGIs $75k-100k, 198.9% for AGIs $100k-200k)
Net capital gain/loss in AGI: +$7,576 (reported on 17.3% of returns)
Here:
+$7,576
State:
+$31,684
(% of AGI for various income ranges: 8.9% for AGIs below $25k, 36.7% for AGIs $25k-50k, 88.2% for AGIs $50k-75k, 156.2% for AGIs $75k-100k, 1104.4% for AGIs $100k-200k)
Profit/loss from business: +$9,211 (reported on 18.4% of returns)
Here:
+$9,211
State:
+$12,175
(% of AGI for various income ranges: 265.3% for AGIs below $25k, 152.7% for AGIs $25k-50k, 509.1% for AGIs $50k-75k, 405.6% for AGIs $100k-200k)
Taxable individual retirement arrangement distribution: $14,800 (reported on 10.2% of returns)
62907:
$14,800
Illinois:
$21,613
(% of AGI for various income ranges: 230.0% for AGIs $25k-50k, 653.6% for AGIs $50k-75k, 462.2% for AGIs $100k-200k)
Total itemized deductions: $37,300 (reported on 3.1% of returns)
Here:
$37,300
State:
$34,948
(% of AGI for various income ranges: 1243.3% for AGIs $100k-200k)
Charity contributions: $6,900 (reported on 3.1% of returns)
Here:
$6,900
State:
$13,122
(% of AGI for various income ranges: 230.0% for AGIs $100k-200k)
Taxes paid: $7,467 (reported on 3.1% of returns)
62907:
$7,467
State:
$8,563
(% of AGI for various income ranges: 248.9% for AGIs $100k-200k)
Earned income credit: $2,900 (reported on 11.2% of returns)
Here:
$2,900
State:
$2,311
(% of AGI for various income ranges: 121.6% for AGIs below $25k, 58.7% for AGIs $25k-50k)
Percentage of individuals using paid preparers for their 2020 taxes: 93.9%
Here:
94%
State:
93%
(% for various income ranges: 90.3% for AGIs below $25k, 95.5% for AGIs $25k-50k, 93.3% for AGIs $50k-75k, 91.7% for AGIs $75k-100k, 100.0% for AGIs $100k-200k, 100.0% for AGIs over 200k)
Averages for the 2012 tax year for zip code 62907, filed in 2013:
Average Adjusted Gross Income (AGI) in 2012: $50,199 (Individual Income Tax Returns)
Here:
$50,199
State:
$68,058
Salary/wage: $43,669 (reported on 82.1% of returns)
Here:
$43,669
State:
$55,396
(% of AGI for various income ranges: 64.3% for AGIs below $25k, 72.4% for AGIs $25k-50k, 74.8% for AGIs $50k-75k, 70.7% for AGIs $75k-100k, 71.5% for AGIs $100k-200k)
Taxable interest for individuals: $1,091 (reported on 45.3% of returns)
This zip code:
$1,091
Illinois:
$1,969
(% of AGI for various income ranges: 2.3% for AGIs below $25k, 1.0% for AGIs $25k-50k, 0.7% for AGIs $50k-75k, 0.9% for AGIs $75k-100k, 0.8% for AGIs $100k-200k)
Ordinary dividends: $1,216 (reported on 20.0% of returns)
Here:
$1,216
State:
$7,786
(% of AGI for various income ranges: 1.0% for AGIs below $25k, 0.5% for AGIs $25k-50k, 0.3% for AGIs $50k-75k, 0.6% for AGIs $75k-100k, 0.3% for AGIs $100k-200k)
Net capital gain/loss in AGI: +$4,246 (reported on 13.7% of returns)
Here:
+$4,246
State:
+$22,183
(% of AGI for various income ranges: 1.6% for AGIs $50k-75k, 2.3% for AGIs $75k-100k, 1.0% for AGIs $100k-200k)
Profit/loss from business: +$6,188 (reported on 17.9% of returns)
Here:
+$6,188
State:
+$12,903
(% of AGI for various income ranges: 8.3% for AGIs below $25k, 0.7% for AGIs $25k-50k, 2.1% for AGIs $50k-75k, 3.4% for AGIs $75k-100k, 0.5% for AGIs $100k-200k)
Taxable individual retirement arrangement distribution: $10,144 (reported on 9.5% of returns)
62907:
$10,144
Illinois:
$17,929
(% of AGI for various income ranges: 4.9% for AGIs below $25k, 5.1% for AGIs $25k-50k, 2.9% for AGIs $75k-100k)
Total itemized deductions: $17,668 (20% of AGI, reported on 23.2% of returns)
Here:
$17,668
State:
$26,433
Here:
20.4% of AGI
State:
19.2% of AGI
(% of AGI for various income ranges: 7.3% for AGIs $25k-50k, 9.5% for AGIs $50k-75k, 9.6% for AGIs $75k-100k, 9.0% for AGIs $100k-200k)
Charity contributions: $3,750 (reported on 14.7% of returns)
Here:
$3,750
State:
$4,525
(% of AGI for various income ranges: 1.8% for AGIs $50k-75k, 1.0% for AGIs $75k-100k, 1.6% for AGIs $100k-200k)
Taxes paid: $5,981 (reported on 22.1% of returns)
62907:
$5,981
State:
$11,968
(% of AGI for various income ranges: 1.2% for AGIs $25k-50k, 2.3% for AGIs $50k-75k, 2.8% for AGIs $75k-100k, 4.1% for AGIs $100k-200k)
Earned income credit: $2,269 (reported on 16.8% of returns)
Here:
$2,269
State:
$2,349
(% of AGI for various income ranges: 6.1% for AGIs below $25k, 1.3% for AGIs $25k-50k)
Percentage of individuals using paid preparers for their 2012 taxes: 62.1%
Here:
62%
State:
57%
(% for various income ranges: 55.6% for AGIs below $25k, 57.1% for AGIs $25k-50k, 71.4% for AGIs $50k-75k, 69.2% for AGIs $75k-100k, 72.7% for AGIs $100k-200k)
Averages for the 2004 tax year for zip code 62907, filed in 2005:
Average Adjusted Gross Income (AGI) in 2004: $36,049 (Individual Income Tax Returns)
Here:
$36,049
State:
$54,625
Salary/wage: $35,323 (reported on 79.6% of returns)
Here:
$35,323
State:
$46,811
(% of AGI for various income ranges: 107.5% for AGIs below $10k, 65.5% for AGIs $10k-25k, 75.5% for AGIs $25k-50k, 83.7% for AGIs $50k-75k, 82.5% for AGIs $75k-100k, 70.6% for AGIs over 100k)
Taxable interest for individuals: $1,232 (reported on 52.8% of returns)
This zip code:
$1,232
Illinois:
$2,101
(% of AGI for various income ranges: 8.4% for AGIs below $10k, 4.3% for AGIs $10k-25k, 2.0% for AGIs $25k-50k, 1.1% for AGIs $50k-75k, 0.7% for AGIs $75k-100k, 1.0% for AGIs over 100k)
Taxable dividends: $1,426 (reported on 21.7% of returns)
Here:
$1,426
State:
$4,306
(% of AGI for various income ranges: 2.9% for AGIs below $10k, 1.2% for AGIs $10k-25k, 0.5% for AGIs $25k-50k, 0.3% for AGIs $50k-75k, 0.8% for AGIs $75k-100k, 2.3% for AGIs over 100k)
Net capital gain/loss: +$1,972 (reported on 15.0% of returns)
Here:
+$1,972
State:
+$17,321
(% of AGI for various income ranges: -1.1% for AGIs below $10k, 1.3% for AGIs $10k-25k, 1.2% for AGIs $25k-50k, 0.9% for AGIs $50k-75k, 0.4% for AGIs $75k-100k, 0.3% for AGIs over 100k)
Profit/loss from business: +$5,066 (reported on 16.2% of returns)
Here:
+$5,066
State:
+$11,771
(% of AGI for various income ranges: -9.0% for AGIs below $10k, 5.4% for AGIs $10k-25k, 5.9% for AGIs $25k-50k, 0.9% for AGIs $50k-75k, 0.4% for AGIs $75k-100k)
IRA payment deduction: $2,500 (reported on 2.6% of returns)
62907:
$2,500
Illinois:
$3,087
Total itemized deductions: $14,215 (23% of AGI, reported on 20.8% of returns)
Here:
$14,215
State:
$20,239
Here:
22.6% of AGI
State:
19.5% of AGI
(% of AGI for various income ranges: 8.2% for AGIs $10k-25k, 7.0% for AGIs $25k-50k, 9.6% for AGIs $50k-75k, 8.8% for AGIs $75k-100k, 7.8% for AGIs over 100k)
Charity contributions deductions: $2,900 (4% of AGI, reported on 16.0% of returns)
Here:
$2,900
State:
$3,719
Here:
4.3% of AGI
State:
3.4% of AGI
(% of AGI for various income ranges: 1.2% for AGIs $10k-25k, 0.5% for AGIs $25k-50k, 1.6% for AGIs $50k-75k, 1.5% for AGIs $75k-100k, 2.1% for AGIs over 100k)
Total tax: $4,178 (reported on 74.4% of returns)
62907:
$4,178
State:
$9,882
(% of AGI for various income ranges: 3.2% for AGIs below $10k, 3.8% for AGIs $10k-25k, 6.7% for AGIs $25k-50k, 8.0% for AGIs $50k-75k, 10.6% for AGIs $75k-100k, 16.6% for AGIs over 100k)
Earned income credit: $1,651 (reported on 13.8% of returns)
Here:
$1,651
State:
$1,788
Percentage of individuals using paid preparers for their 2004 taxes: 68.4%
Here:
68%
State:
61%
(% for various income ranges: 62.2% for AGIs below $10k, 69.5% for AGIs $10k-25k, 71.1% for AGIs $25k-50k, 68.7% for AGIs $50k-75k, 70.4% for AGIs $75k-100k, 74.2% for AGIs over 100k)
Household received Food Stamps/SNAP in the past 12 months: 75 Household did not receive Food Stamps/SNAP in the past 12 months: 580
Women who had a birth in the past 12 months: 36 (26 now married, 9 unmarried) Women who did not have a birth in the past 12 months: 379 (152 now married, 226 unmarried)
Housing units in zip code 62907 with a mortgage: 293 (10 second mortgage) Median monthly owner costs for units with a mortgage: $1,337 Median monthly owner costs for units without a mortgage: $530
Residents with income below the poverty level in 2022:
This zip code:
21.6%
Whole state:
11.9%
Residents with income below 50% of the poverty level in 2022:
This zip code:
17.4%
Whole state:
5.7%
Median number of rooms in houses and condos:
Here:
5.9
State:
6.4
Median number of rooms in apartments:
Here:
6.4
State:
4.1
Notable locations in this zip code not listed on our city pages
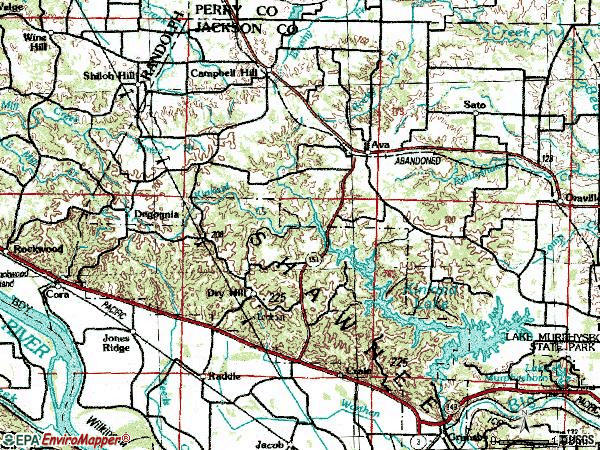
Notable locations in zip code 62907: Bryden (A), Buttermilk Hill Beach and Picnic Area (B), Rieckenberg Community Hall (C), Sharp Rock Falls Campground (D), Bauenhos Dairy (E), Jackson County Ambulance Service (F), Ava Volunteer Fire Department (G). Display/hide their locations on the map
Cemeteries: Bartlett Cemetery (1), Birkner Cemetery (2), Williamson Cemetery (3), Wilson Cemetery (4), Bower Cemetery (5), Lee Cemetery (6), Joubert Cemetery (7). Display/hide their locations on the map
Size of family households: 269 2-persons, 104 3-persons, 50 4-persons, 11 5-persons, 22 6-persons, 48 7-or-more-persons
Size of nonfamily households: 132 1-person, 11 2-persons, 7 4-persons
440 married couples with children.
110 single-parent households (63 men, 47 women).
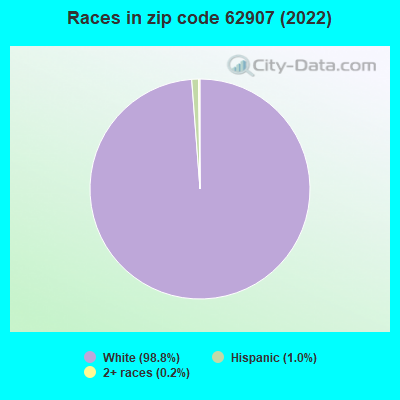
87.9% of residents of 62907 zip code speak English at home.
0.5% of residents speak Spanish at home (100% very well).
12.2% of residents speak other Indo-European language at home (48% very well, 38% well, 14% not well).
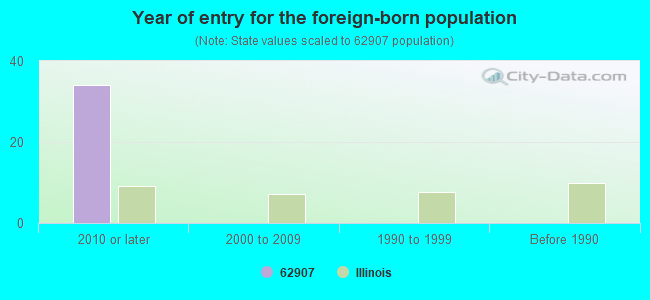
Foreign born population: 0 (0.0%)
:
0.0%
Whole state:
14.4%
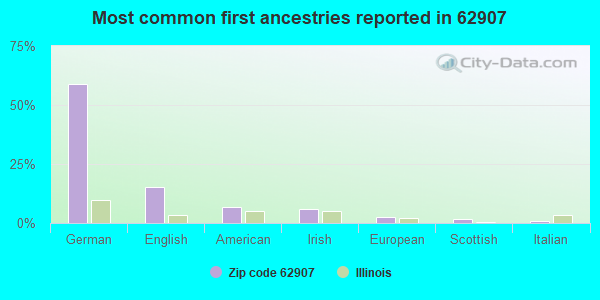
59%German
15%English
7%American
6%Irish
2%European
2%Scottish
1%Italian
Year of entry for the foreign-born population
342010 or later
02000 to 2009
01990 to 1999
0Before 1990
Facilities with environmental interests located in this zip code:
KINKAID STONE CO (4287 KINKAID STONE RD. in AVA, IL)
STATE MASTER (Illinois EPA Project) - AIR PROGRAM, National Pollutant Discharge Elimination System Permit AIR MINOR (AIRS/AFS) CRITERIA AND HAZARDOUS AIR POLLUTANT INVENTORY (Inventory of air pollution sources) Business SIC classification: CRUSHED AND BROKEN LIMESTONE
KNIGHT HAWK COAL (984 E. SUGAR HILL in AVA, IL)
STATE MASTER (Illinois EPA Project) - AIR PROGRAM AIR MINOR (AIRS/AFS) CRITERIA AND HAZARDOUS AIR POLLUTANT INVENTORY (Inventory of air pollution sources) Business SIC classification: BITUMINOUS COAL AND LIGNITE SURFACE MINING Alternative names: KNIGHT HAWK COAL CREEK PAUM MINE
ILLINOIS QUARRY CO (RURAL ROUTE #2 in AVA, IL)
STATE MASTER (Illinois EPA Project) - AIR PROGRAM AIR MINOR (AIRS/AFS) Business SIC classification: CRUSHED AND BROKEN LIMESTONE
PREMIUM PORK INC (424 KOEHN RD in AVA, IL)
STATE MASTER (Illinois EPA Project) - AIR PROGRAM AIR MINOR (AIRS/AFS) Business SIC classification: HOGS
KINKAID STONE CO. (RTE. 2 in AVA, IL)
National Pollutant Discharge Elimination System NON-MAJOR (Tracking pollutant discharge elimination systems) - permit
KNIGHT HAWK COAL-CREEK PAUM (CREEK PAUM ROAD in AVA, IL)
National Pollutant Discharge Elimination System NON-MAJOR (Tracking pollutant discharge elimination systems) - permit Business SIC classification: BITUMINOUS COAL AND LIGNITE SURFACE MINING
KNIGHT HAWK COAL-CREEK PAUM N (5 MILES NORTHEAST OF in AVA, IL)
National Pollutant Discharge Elimination System NON-MAJOR (Tracking pollutant discharge elimination systems) - permit Business SIC classification: BITUMINOUS COAL AND LIGNITE SURFACE MINING Alternative names: KNIGHT HAWK COAL LLC-AVA
ILDOT (BRG 039 0034 KINKAID LAKE in AVA, IL)
Small Quantity Generators, between 100 kg and 1000 kg of hazardous waste/month (Resource Conservation and Recovery Act (tracking hazardous waste)) - notification
RESEARCH MANNIKINS INC (143 LUPINE LN in AVA, IL)
TRI REPORTER (Tracking of toxic chemicals releasing facilities) Business SIC classification: PLASTICS FOAM PRODUCTS
Housing units lacking complete plumbing facilities: 2.1%
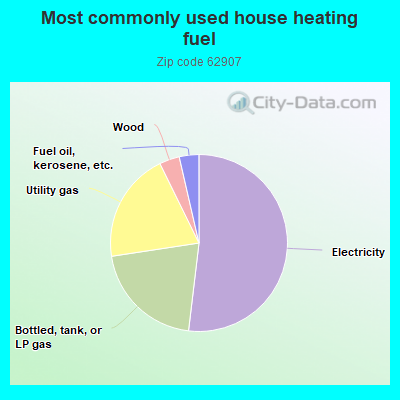
52.1%Electricity
20.8%Bottled, tank, or LP gas
20.2%Utility gas
3.7%Wood
3.6%Fuel oil, kerosene, etc.
Population in 1990: 1,806. Population change in the 1990s: +316 (+17.5%).
Place of birth for U.S.-born residents:
This state: 1,528
Northeast: 8
Midwest: 142
South: 76
West: 55
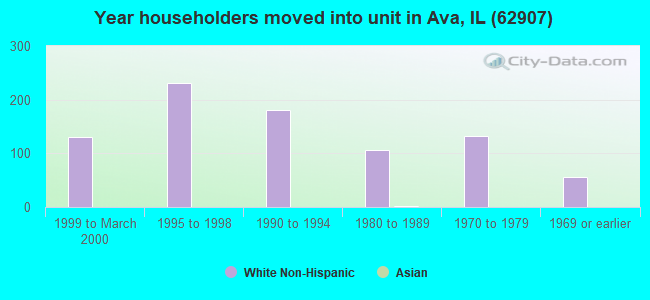
65% of the 62907 zip code residents lived in the same house 5 years ago. Out of people who lived in different houses, 60% lived in this county. Out of people who lived in different counties, 50% lived in Illinois.
94% of the 62907 zip code residents lived in the same house 1 year ago. Out of people who lived in different houses, 69% moved from this county. Out of people who lived in different houses, 3% moved from different county within same state. Out of people who lived in different houses, 24% moved from different state.
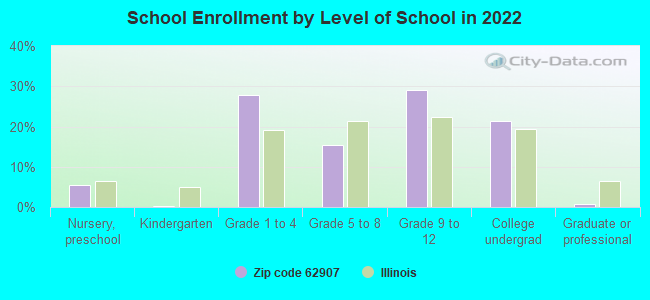
Private vs. public school enrollment:
Students in private schools in grades 1 to 8 (elementary and middle school): 135
Here:
71.3%
Illinois:
13.3%
Students in private schools in grades 9 to 12 (high school): 59
Here:
49.8%
Illinois:
9.9%
Students in private undergraduate colleges: 13
Here:
14.8%
Illinois:
27.4%
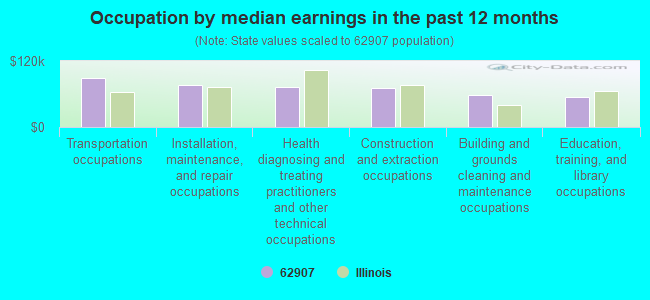
Occupation by median earnings in the past 12 months ($)
89,294Transportation occupations
76,416Installation, maintenance, and repair occupations
73,580Health diagnosing and treating practitioners and other technical occupations
71,524Construction and extraction occupations
57,372Building and grounds cleaning and maintenance occupations
55,275Education, training, and library occupations
Top industries in this zip code by the number of employees in 2005:
Construction: Other Heavy and Civil Engineering Construction (20-49: 1)
Mining: Support Activities for Coal Mining (20-49: 1)
Finance and Insurance: Commercial Banking (20-49: 1)
Information: Radio Stations (10-19: 1)
Mining: Crushed and Broken Limestone Mining and Quarrying (10-19: 1)
Construction: Structural Steel and Precast Concrete Contractors (5-9: 1)
Fatal accident statistics in 2014:
Fatal accident count: 1
Vehicles involved in fatal accidents: 1
Fatal accidents caused by drunken drivers: 1
Fatalities: 1
Persons involved in fatal accidents: 9
Pedestrians involved in fatal accidents: 0
2002 - 2018 National Fire Incident Reporting System (NFIRS) incidents
Based on the data from the years 2002 - 2018 the average number of fires per year is 8. The highest number of fire incidents - 22 took place in 2014, and the least - 0 in 2005. The data has a growing trend.
When looking into fire subcategories, the most incidents belonged to: Structure Fires (49.3%), and Outside Fires (34.1%).
Fire incident types reported to NFIRS in Zip Code 62907


 Nearest zip codes: 62916, 62940, 62950, 62997, 62280, 62272.


 Based on the data from the years 2002 - 2018 the average number of fires per year is 8. The highest number of fire incidents - 22 took place in 2014, and the least - 0 in 2005. The data has a growing trend.
 When looking into fire subcategories, the most incidents belonged to: Structure Fires (49.3%), and Outside Fires (34.1%).