Estimated zip code population in 2022: 2,785 Zip code population in 2010: 3,119 Zip code population in 2000: 3,034
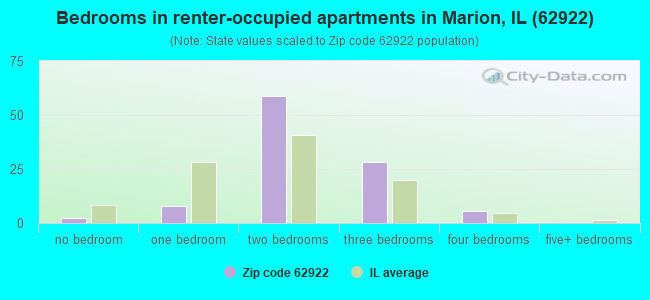
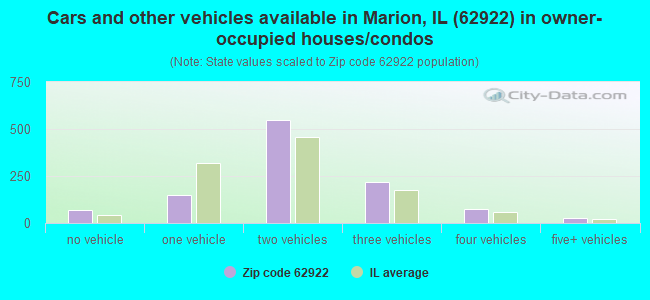
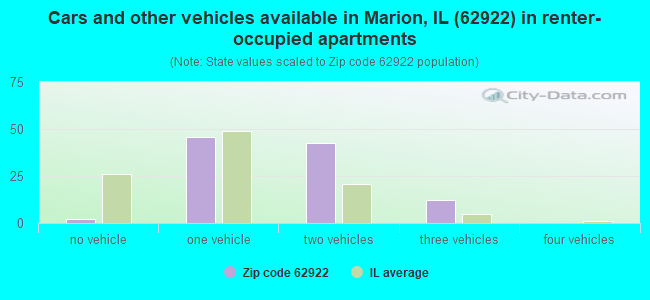
Houses and condos: 1,583 Renter-occupied apartments: 104
% of renters here:
9%
State:
33%
March 2022 cost of living index in zip code 62922: 84.3 (less than average, U.S. average is 100)
Land area: 64.8 sq. mi. Water area: 1.9 sq. mi.
Population density: 43 people per square mile
(very low).
OSM Map
General Map
Google Map
MSN Map
OSM Map
General Map
Google Map
MSN Map
OSM Map
General Map
Google Map
MSN Map
OSM Map
General Map
Google Map
MSN Map
Please wait while loading the map...
Real estate property taxes paid for housing units in 2022:
This zip code:
1.4% ($2,406)
Illinois:
2.0% ($4,912)
Median real estate property taxes paid for housing units with mortgages in 2022: $3,354 (1.9%) Median real estate property taxes paid for housing units with no mortgage in 2022: $1,506 (1.2%)
Business Search- 14 Million verified businesses
Males: 1,518
(54.5%)
Females: 1,266
(45.5%)
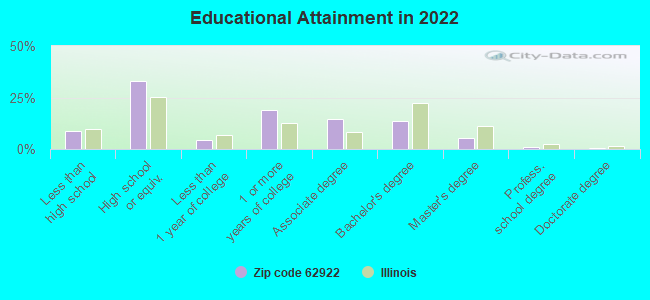
For population 25 years and over in 62922:
High school or higher: 89.8%
Bachelor's degree or higher: 19.6%
Graduate or professional degree: 6.4%
Unemployed: 6.6%
Mean travel time to work (commute): 35.6 minutes
For population 15 years and over in 62922:
Never married: 22.2%
Now married: 56.1%
Separated: 0.2%
Widowed: 6.3%
Divorced: 15.1%
Zip code 62922 compared to state average:
Median house value below state average.
Black race population percentage significantly below state average.
Hispanic race population percentage significantly below state average.
Median age above state average.
Foreign-born population percentage significantly below state average.
Renting percentage significantly below state average.
Length of stay since moving in significantly above state average.
Number of college students below state average.
Percentage of population with a bachelor's degree or higher below state average.
Averages for the 2020 tax year for zip code 62922, filed in 2021:
Average Adjusted Gross Income (AGI) in 2020: $60,796 (Individual Income Tax Returns)
Here:
$60,796
State:
$82,626
Salary/wage: $52,815 (reported on 74.4% of returns)
Here:
$52,815
State:
$66,640
(% of AGI for various income ranges: 1086.3% for AGIs below $25k, 3124.3% for AGIs $25k-50k, 5270.0% for AGIs $50k-75k, 8528.0% for AGIs $75k-100k, 14942.3% for AGIs $100k-200k)
Taxable interest for individuals: $665 (reported on 36.8% of returns)
This zip code:
$665
Illinois:
$2,376
(% of AGI for various income ranges: 16.3% for AGIs below $25k, 22.2% for AGIs $25k-50k, 45.7% for AGIs $50k-75k, 12.0% for AGIs $75k-100k, 72.3% for AGIs $100k-200k)
Ordinary dividends: $2,252 (reported on 16.8% of returns)
Here:
$2,252
State:
$9,061
(% of AGI for various income ranges: 18.1% for AGIs below $25k, 22.2% for AGIs $25k-50k, 34.3% for AGIs $50k-75k, 69.0% for AGIs $75k-100k, 196.9% for AGIs $100k-200k)
Net capital gain/loss in AGI: +$5,339 (reported on 14.4% of returns)
Here:
+$5,339
State:
+$31,684
(% of AGI for various income ranges: 38.3% for AGIs $25k-50k, 42.9% for AGIs $50k-75k, 33.0% for AGIs $75k-100k, 603.8% for AGIs $100k-200k)
Profit/loss from business: +$5,511 (reported on 15.2% of returns)
Here:
+$5,511
State:
+$12,175
(% of AGI for various income ranges: 111.5% for AGIs below $25k, 22.2% for AGIs $25k-50k, 135.7% for AGIs $50k-75k, 47.0% for AGIs $75k-100k, 352.3% for AGIs $100k-200k)
Taxable individual retirement arrangement distribution: $16,900 (reported on 12.8% of returns)
62922:
$16,900
Illinois:
$21,613
(% of AGI for various income ranges: 110.4% for AGIs below $25k, 157.0% for AGIs $25k-50k, 247.9% for AGIs $50k-75k, 538.0% for AGIs $75k-100k, 892.3% for AGIs $100k-200k)
Total itemized deductions: $29,100 (reported on 4.0% of returns)
Here:
$29,100
State:
$34,948
(% of AGI for various income ranges: 170.7% for AGIs below $25k, 764.6% for AGIs $100k-200k)
Charity contributions: $11,000 (reported on 2.4% of returns)
Here:
$11,000
State:
$13,122
(% of AGI for various income ranges: 253.8% for AGIs $100k-200k)
Taxes paid: $8,500 (reported on 4.0% of returns)
62922:
$8,500
State:
$8,563
(% of AGI for various income ranges: 61.7% for AGIs $25k-50k, 217.7% for AGIs $100k-200k)
Earned income credit: $2,072 (reported on 14.4% of returns)
Here:
$2,072
State:
$2,311
(% of AGI for various income ranges: 78.9% for AGIs below $25k, 69.6% for AGIs $25k-50k)
Percentage of individuals using paid preparers for their 2020 taxes: 96.0%
Here:
96%
State:
93%
(% for various income ranges: 94.9% for AGIs below $25k, 96.6% for AGIs $25k-50k, 94.7% for AGIs $50k-75k, 100.0% for AGIs $75k-100k, 95.2% for AGIs $100k-200k, 100.0% for AGIs over 200k)
Averages for the 2012 tax year for zip code 62922, filed in 2013:
Average Adjusted Gross Income (AGI) in 2012: $47,798 (Individual Income Tax Returns)
Here:
$47,798
State:
$68,058
Salary/wage: $42,121 (reported on 78.0% of returns)
Here:
$42,121
State:
$55,396
(% of AGI for various income ranges: 63.6% for AGIs below $25k, 70.7% for AGIs $25k-50k, 65.9% for AGIs $50k-75k, 70.4% for AGIs $75k-100k, 69.8% for AGIs $100k-200k)
Taxable interest for individuals: $1,155 (reported on 38.2% of returns)
This zip code:
$1,155
Illinois:
$1,969
(% of AGI for various income ranges: 1.2% for AGIs below $25k, 0.8% for AGIs $25k-50k, 0.7% for AGIs $50k-75k, 0.5% for AGIs $75k-100k, 1.3% for AGIs $100k-200k)
Ordinary dividends: $1,426 (reported on 18.7% of returns)
Here:
$1,426
State:
$7,786
(% of AGI for various income ranges: 0.7% for AGIs below $25k, 0.5% for AGIs $25k-50k, 0.5% for AGIs $50k-75k, 0.4% for AGIs $75k-100k, 0.7% for AGIs $100k-200k)
Net capital gain/loss in AGI: +$3,750 (reported on 9.8% of returns)
Here:
+$3,750
State:
+$22,183
(% of AGI for various income ranges: 0.2% for AGIs $50k-75k, 0.6% for AGIs $75k-100k, 1.9% for AGIs $100k-200k)
Profit/loss from business: +$6,563 (reported on 15.4% of returns)
Here:
+$6,563
State:
+$12,903
(% of AGI for various income ranges: 5.2% for AGIs below $25k, 3.3% for AGIs $25k-50k, 0.6% for AGIs $50k-75k, 2.8% for AGIs $100k-200k)
Taxable individual retirement arrangement distribution: $10,419 (reported on 13.0% of returns)
62922:
$10,419
Illinois:
$17,929
(% of AGI for various income ranges: 3.9% for AGIs below $25k, 3.5% for AGIs $25k-50k, 1.8% for AGIs $50k-75k, 3.2% for AGIs $75k-100k, 2.5% for AGIs $100k-200k)
Total itemized deductions: $19,871 (22% of AGI, reported on 22.8% of returns)
Here:
$19,871
State:
$26,433
Here:
22.5% of AGI
State:
19.2% of AGI
(% of AGI for various income ranges: 5.7% for AGIs below $25k, 6.1% for AGIs $25k-50k, 8.8% for AGIs $50k-75k, 9.5% for AGIs $75k-100k, 13.2% for AGIs $100k-200k)
Charity contributions: $5,025 (reported on 16.3% of returns)
Here:
$5,025
State:
$4,525
(% of AGI for various income ranges: 1.1% for AGIs $25k-50k, 1.1% for AGIs $50k-75k, 1.2% for AGIs $75k-100k, 3.3% for AGIs $100k-200k)
Taxes paid: $6,496 (reported on 22.8% of returns)
62922:
$6,496
State:
$11,968
(% of AGI for various income ranges: 0.8% for AGIs below $25k, 1.4% for AGIs $25k-50k, 2.4% for AGIs $50k-75k, 3.3% for AGIs $75k-100k, 5.2% for AGIs $100k-200k)
Earned income credit: $2,177 (reported on 17.9% of returns)
Here:
$2,177
State:
$2,349
(% of AGI for various income ranges: 5.7% for AGIs below $25k, 1.3% for AGIs $25k-50k)
Percentage of individuals using paid preparers for their 2012 taxes: 56.9%
Here:
57%
State:
57%
(% for various income ranges: 50.0% for AGIs below $25k, 59.4% for AGIs $25k-50k, 55.6% for AGIs $50k-75k, 64.3% for AGIs $75k-100k, 69.2% for AGIs $100k-200k)
Averages for the 2004 tax year for zip code 62922, filed in 2005:
Average Adjusted Gross Income (AGI) in 2004: $36,510 (Individual Income Tax Returns)
Here:
$36,510
State:
$54,625
Salary/wage: $31,956 (reported on 79.5% of returns)
Here:
$31,956
State:
$46,811
(% of AGI for various income ranges: 97.0% for AGIs below $10k, 67.9% for AGIs $10k-25k, 72.3% for AGIs $25k-50k, 74.2% for AGIs $50k-75k, 75.8% for AGIs $75k-100k, 48.3% for AGIs over 100k)
Taxable interest for individuals: $1,301 (reported on 45.0% of returns)
This zip code:
$1,301
Illinois:
$2,101
(% of AGI for various income ranges: 6.7% for AGIs below $10k, 2.9% for AGIs $10k-25k, 1.6% for AGIs $25k-50k, 0.8% for AGIs $50k-75k, 0.8% for AGIs $75k-100k, 2.0% for AGIs over 100k)
Taxable dividends: $1,069 (reported on 21.2% of returns)
Here:
$1,069
State:
$4,306
(% of AGI for various income ranges: 1.0% for AGIs below $10k, 1.0% for AGIs $10k-25k, 0.9% for AGIs $25k-50k, 0.3% for AGIs $50k-75k, 0.4% for AGIs $75k-100k, 0.6% for AGIs over 100k)
Net capital gain/loss: +$5,046 (reported on 14.1% of returns)
Here:
+$5,046
State:
+$17,321
(% of AGI for various income ranges: -1.3% for AGIs below $10k, 1.4% for AGIs $10k-25k, 0.9% for AGIs $25k-50k, 0.3% for AGIs $50k-75k, 0.9% for AGIs $75k-100k, 8.5% for AGIs over 100k)
Profit/loss from business: +$4,156 (reported on 15.7% of returns)
Here:
+$4,156
State:
+$11,771
(% of AGI for various income ranges: 5.4% for AGIs below $10k, 3.0% for AGIs $10k-25k, 1.8% for AGIs $25k-50k, 3.5% for AGIs $50k-75k, -0.2% for AGIs $75k-100k)
IRA payment deduction: $2,111 (reported on 1.5% of returns)
62922:
$2,111
Illinois:
$3,087
Total itemized deductions: $14,917 (23% of AGI, reported on 19.8% of returns)
Here:
$14,917
State:
$20,239
Here:
23.1% of AGI
State:
19.5% of AGI
(% of AGI for various income ranges: 5.2% for AGIs $10k-25k, 7.5% for AGIs $25k-50k, 7.8% for AGIs $50k-75k, 10.1% for AGIs $75k-100k, 10.5% for AGIs over 100k)
Charity contributions deductions: $3,148 (5% of AGI, reported on 16.0% of returns)
Here:
$3,148
State:
$3,719
Here:
4.7% of AGI
State:
3.4% of AGI
(% of AGI for various income ranges: 0.8% for AGIs $10k-25k, 0.8% for AGIs $25k-50k, 1.4% for AGIs $50k-75k, 2.0% for AGIs $75k-100k, 2.3% for AGIs over 100k)
Total tax: $4,207 (reported on 74.4% of returns)
62922:
$4,207
State:
$9,882
(% of AGI for various income ranges: 1.7% for AGIs below $10k, 3.4% for AGIs $10k-25k, 6.1% for AGIs $25k-50k, 8.7% for AGIs $50k-75k, 10.8% for AGIs $75k-100k, 15.2% for AGIs over 100k)
Earned income credit: $1,604 (reported on 16.5% of returns)
Here:
$1,604
State:
$1,788
Percentage of individuals using paid preparers for their 2004 taxes: 63.9%
Here:
64%
State:
61%
(% for various income ranges: 55.6% for AGIs below $10k, 66.0% for AGIs $10k-25k, 67.1% for AGIs $25k-50k, 63.6% for AGIs $50k-75k, 60.0% for AGIs $75k-100k, 76.6% for AGIs over 100k)
Household received Food Stamps/SNAP in the past 12 months: 72 Household did not receive Food Stamps/SNAP in the past 12 months: 1,100
Women who had a birth in the past 12 months: 21 (21 now married, 0 unmarried) Women who did not have a birth in the past 12 months: 494 (265 now married, 225 unmarried)
Housing units in zip code 62922 with a mortgage: 495 (23 second mortgage, 18 both second mortgage and home equity loan) Median monthly owner costs for units with a mortgage: $1,442 Median monthly owner costs for units without a mortgage: $562
Residents with income below the poverty level in 2022:
This zip code:
9.1%
Whole state:
11.9%
Residents with income below 50% of the poverty level in 2022:
This zip code:
4.5%
Whole state:
5.7%
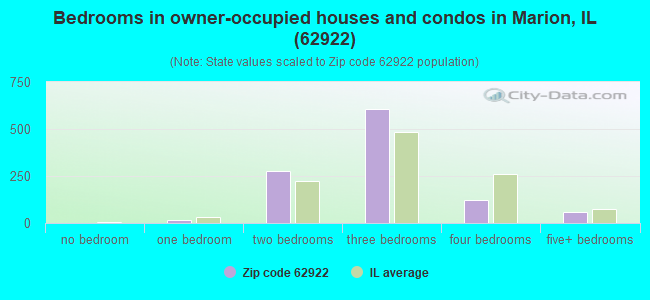
Median number of rooms in houses and condos:
Here:
5.9
State:
6.4
Median number of rooms in apartments:
Here:
4.5
State:
4.1
Notable locations in this zip code not listed on our city pages
Churches in zip code 62922 include: Arnold View Church (A), Ralls Grove Church (B), Cana Church (C), Springhill Church (D), Fairview Church (E), Mount Moriah Church (F), New Salem Church (G). Display/hide their locations on the map
Cemeteries: Arnold Cemetery (1), Atwood Cemetery (2), White Oak Cemetery (3), McBride Cemetery (4), Parks Cemetery (5), Henshaw Cemetery (6), Simmons Cemetery (7). Display/hide their locations on the map
Streams, rivers, and creeks: Maple Branch (A), Larkin Creek (B), Cana Creek (C), Brushy Creek (D), Wagon Creek (E), Sugar Creek (F). Display/hide their locations on the map
Size of family households: 432 2-persons, 188 3-persons, 148 4-persons, 53 5-persons, 24 6-persons
Size of nonfamily households: 273 1-person, 62 2-persons
289 married couples with children.
111 single-parent households (94 men, 17 women).
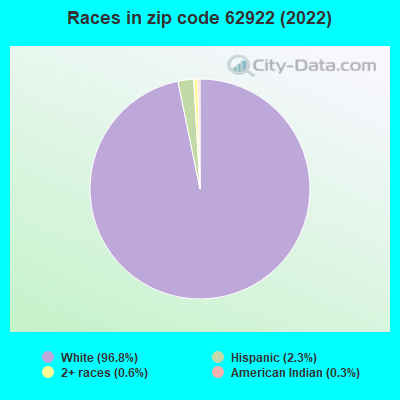
96.9% of residents of 62922 zip code speak English at home.
2.7% of residents speak Spanish at home (83% very well, 17% not well).
0.1% of residents speak other Indo-European language at home (100% well).
Foreign born population: 0 (0.0%)
:
0.0%
Whole state:
14.4%
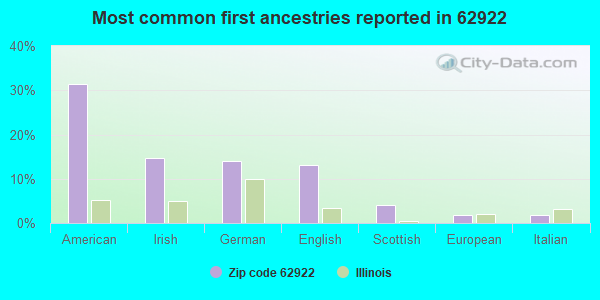
31%American
15%Irish
14%German
13%English
4%Scottish
2%European
2%Italian
Facilities with environmental interests located in this zip code:
MERCER S MOLD POLISHING (1210 BIRDWELL RD. in CREAL SPRINGS, IL)
STATE MASTER (Illinois EPA Project) - AIR PROGRAM AIR MINOR (AIRS/AFS) Business SIC classification: NONCLASSIFIABLE ESTABLISHMENTS Alternative names: MERCERS MOLD POLISHING
CREAL SPRINGS STP (208 WEST BLUE STATE RT 166 in CREAL SPRINGS, IL)
STATE MASTER (Illinois EPA Project) - National Pollutant Discharge Elimination System Permit National Pollutant Discharge Elimination System NON-MAJOR (Tracking pollutant discharge elimination systems) - permit Business SIC classification: SEWERAGE SYSTEMS Alternative names: CREAL SPRINGS STP, CITY OF
CREAL SPRINGS ELEM SCHOOL (P O BOX 408 in CREAL SPRINGS, IL)
(National Center for Education Statistics) - STATE ID-2110000202003 Organizations: MARION COMM UNIT SCH DIST 2 (SCHOOL DISTRICT)
Housing units lacking complete plumbing facilities: 11.3% Housing units lacking complete kitchen facilities: 2.5%
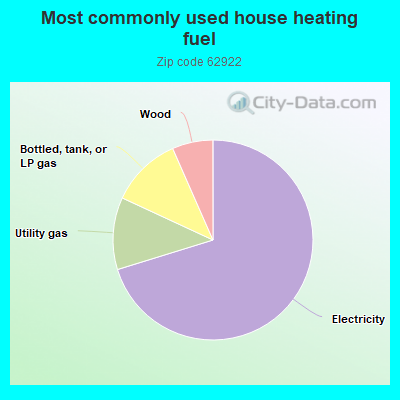
70.3%Electricity
11.7%Utility gas
11.5%Bottled, tank, or LP gas
6.6%Wood
Population in 1990: 2,743. Population change in the 1990s: +291 (+10.6%).
Place of birth for U.S.-born residents:
This state: 2,235
Northeast: 43
Midwest: 123
South: 314
West: 48
65% of the 62922 zip code residents lived in the same house 5 years ago. Out of people who lived in different houses, 56% lived in this county. Out of people who lived in different counties, 50% lived in Illinois.
90% of the 62922 zip code residents lived in the same house 1 year ago. Out of people who lived in different houses, 67% moved from this county. Out of people who lived in different houses, 30% moved from different county within same state.
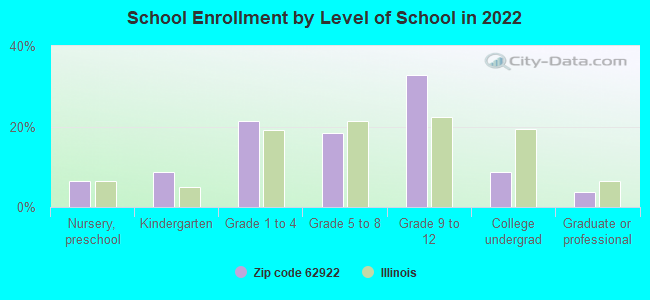
Private vs. public school enrollment:
Students in private schools in grades 1 to 8 (elementary and middle school): 8
Here:
3.7%
Illinois:
13.3%
Students in private schools in grades 9 to 12 (high school):
Here:
0.0%
Illinois:
9.9%
Students in private undergraduate colleges:
Here:
0.0%
Illinois:
27.4%
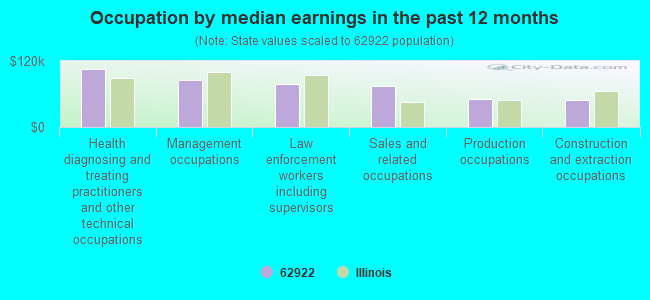
Occupation by median earnings in the past 12 months ($)
106,256Health diagnosing and treating practitioners and other technical occupations
85,568Management occupations
77,275Law enforcement workers including supervisors
74,735Sales and related occupations
50,827Production occupations
48,883Construction and extraction occupations
Companies with federal contracts located in this zip code:
LESCHMANN LOGISTICS, LTD (16178 LAKE OF EGYPT ROAD in CREAL SPRINGS, IL; small business) : $2,978,191 in 67 contractsfrom 1999 to 2005
Contracts for Packing and Gasket Materials, Bearings, Antifriction, Unmounted, Capacitors, Vehicular Power Transmission Components, and moreby Defense Logistics Agency, Navy Signed by year:2000: $578,773; 2001: $1,156,827; 2002: $1,215,975; 2003: $0; 2004: $0; 2005: -$3,316; 2006: $0.
Biggest contracts:
$99,999 with Defense Logistics Agency for Packing and Gasket Materials. Signed on 2001-11-15. Completion date: 2002-08-01.
$96,463 with Defense Logistics Agency for Bearings, Antifriction, Unmounted. Signed on 2002-09-08. Completion date: 2003-09-03.
$89,919 with Defense Logistics Agency for Capacitors. Taking place in OH. Signed on 2002-01-02. Completion date: 2002-11-16.
$89,478 with Defense Logistics Agency for Vehicular Power Transmission Components. Signed on 2001-07-09. Completion date: 2001-12-10.
Top industries in this zip code by the number of employees in 2005:
Administrative and Support and Waste Management and Remediation Services: Temporary Help Services (20-49 employees: 1 establishment)
Other Services (except Public Administration): Civic and Social Organizations (5-9: 1, 1-4: 1)
Other Services (except Public Administration): Religious Organizations (1-4: 4)
Finance and Insurance: Commercial Banking (5-9: 1)
Other Services (except Public Administration): Other Personal and Household Goods Repair and Maintenance (1-4: 1)
Construction: New Single-Family Housing Construction (except Operative Builders) (1-4: 1)
People in group quarters in 2000:
35 people in nursing homes
Fatal accident statistics in 2014:
Fatal accident count: 1
Vehicles involved in fatal accidents: 2
Fatal accidents caused by drunken drivers: 0
Fatalities: 1
Persons involved in fatal accidents: 3
Pedestrians involved in fatal accidents: 0
2002 - 2018 National Fire Incident Reporting System (NFIRS) incidents
Based on the data from the years 2002 - 2018 the average number of fires per year is 20. The highest number of reported fires - 36 took place in 2014, and the least - 8 in 2007. The data has a decreasing trend.
When looking into fire subcategories, the most incidents belonged to: Outside Fires (46.5%), and Structure Fires (40.6%).
Fire incident types reported to NFIRS in Zip Code 62922

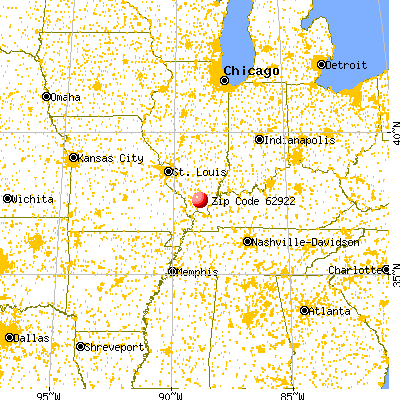


 Nearest zip codes: 62967, 62972, 62959, 62987, 62974, 62917.
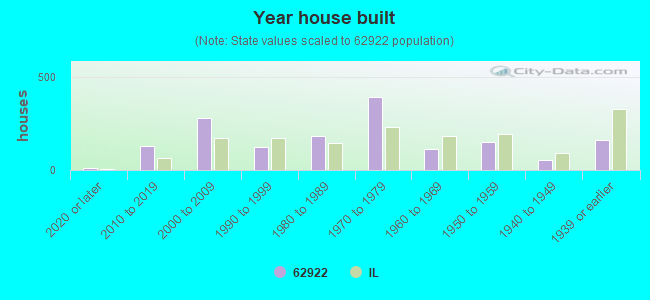


 Based on the data from the years 2002 - 2018 the average number of fires per year is 20. The highest number of reported fires - 36 took place in 2014, and the least - 8 in 2007. The data has a decreasing trend.
 When looking into fire subcategories, the most incidents belonged to: Outside Fires (46.5%), and Structure Fires (40.6%).