Estimated zip code population in 2022: 4,039 Zip code population in 2010: 3,357 Zip code population in 2000: 2,407
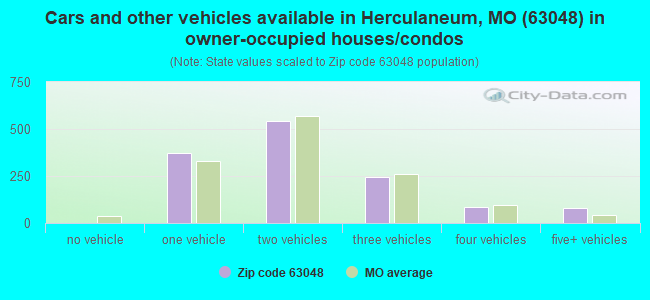
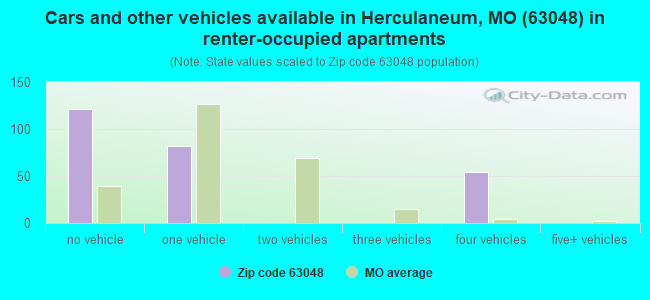
Houses and condos: 1,687 Renter-occupied apartments: 251
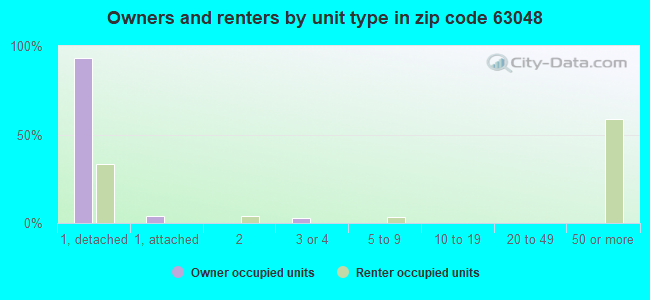
% of renters here:
16%
State:
32%
March 2022 cost of living index in zip code 63048: 99.8 (near average, U.S. average is 100)
Land area: 3.4 sq. mi. Water area: 0.3 sq. mi.
Population density: 1,184 people per square mile
(low).
OSM Map
General Map
Google Map
MSN Map
OSM Map
General Map
Google Map
MSN Map
OSM Map
General Map
Google Map
MSN Map
OSM Map
General Map
Google Map
MSN Map
Please wait while loading the map...
Real estate property taxes paid for housing units in 2022:
This zip code:
0.7% ($1,481)
Missouri:
0.8% ($1,810)
Median real estate property taxes paid for housing units with mortgages in 2022: $1,454 (0.7%) Median real estate property taxes paid for housing units with no mortgage in 2022: $1,643 (0.8%)
Business Search- 14 Million verified businesses
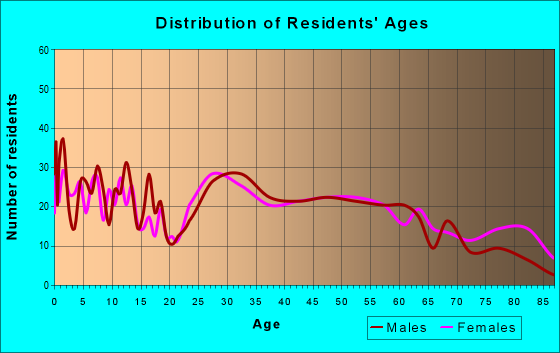
Males: 1,864
(46.2%)
Females: 2,175
(53.8%)
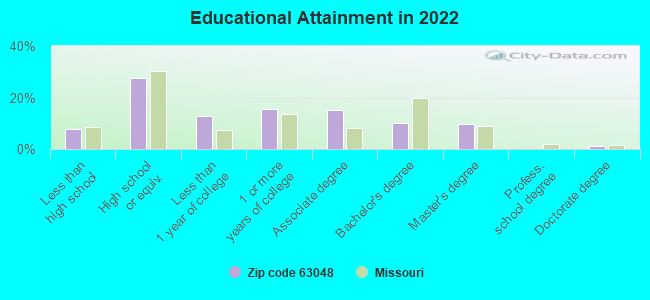
For population 25 years and over in 63048:
High school or higher: 92.2%
Bachelor's degree or higher: 21.2%
Graduate or professional degree: 10.9%
Unemployed: 4.8%
Mean travel time to work (commute): 28.1 minutes
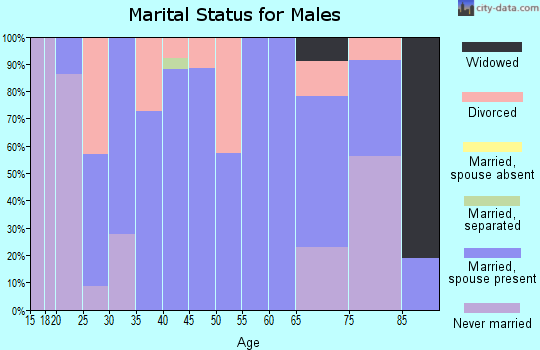
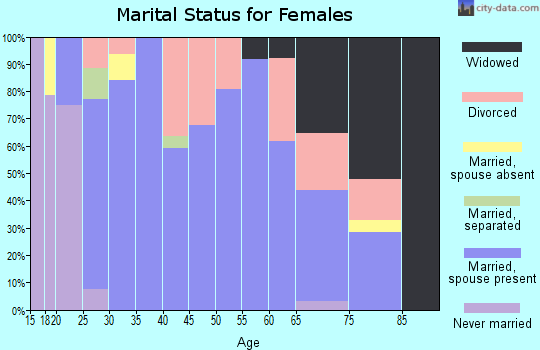
For population 15 years and over in 63048:
Never married: 27.7%
Now married: 48.6%
Separated: 4.4%
Widowed: 12.3%
Divorced: 6.9%
Zip code 63048 compared to state average:
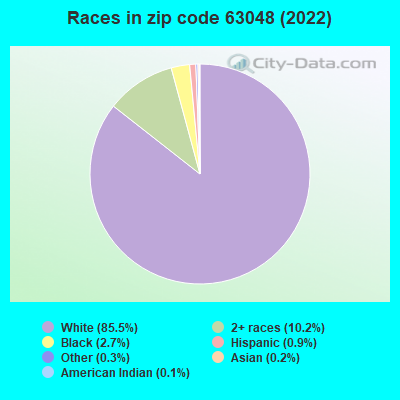
Black race population percentage significantly below state average.
Hispanic race population percentage significantly below state average.
Foreign-born population percentage significantly below state average.
Renting percentage below state average.
Length of stay since moving in significantly above state average.
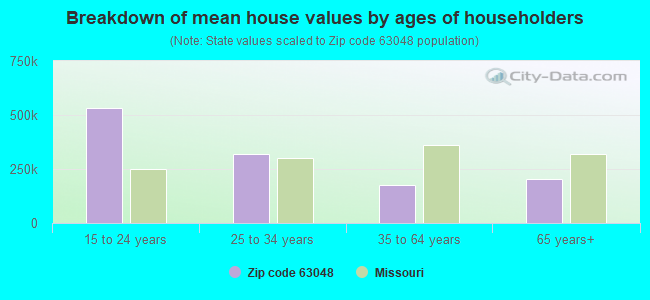
Estimated median house/condo value in 2022: $207,999
63048:
$207,999
Missouri:
$221,200
According to our research of Missouri and other state lists, there were 6 registered sex offenders living in 63048 zip code as of April 24, 2024. The ratio of all residents to sex offenders in zip code 63048 is 639 to 1. The ratio of registered sex offenders to all residents in this zip code is lower than the state average.
Median resident age:
This zip code:
42.7 years
Missouri median age:
39.1 years
Average household size:
This zip code:
2.4 people
Missouri:
2.4 people
Averages for the 2020 tax year for zip code 63048, filed in 2021:
Average Adjusted Gross Income (AGI) in 2020: $61,457 (Individual Income Tax Returns)
Here:
$61,457
State:
$68,151
Salary/wage: $57,566 (reported on 81.5% of returns)
Here:
$57,566
State:
$56,131
(% of AGI for various income ranges: 1090.2% for AGIs below $25k, 3476.8% for AGIs $25k-50k, 6050.0% for AGIs $50k-75k, 8982.3% for AGIs $75k-100k, 16801.3% for AGIs $100k-200k)
Taxable interest for individuals: $902 (reported on 25.4% of returns)
This zip code:
$902
Missouri:
$1,586
(% of AGI for various income ranges: 16.9% for AGIs below $25k, 7.4% for AGIs $25k-50k, 34.3% for AGIs $50k-75k, 60.0% for AGIs $75k-100k, 63.0% for AGIs $100k-200k)
Ordinary dividends: $3,410 (reported on 14.1% of returns)
Here:
$3,410
State:
$10,947
(% of AGI for various income ranges: 26.7% for AGIs below $25k, 36.2% for AGIs $25k-50k, 68.9% for AGIs $50k-75k, 82.7% for AGIs $75k-100k, 164.8% for AGIs $100k-200k)
Net capital gain/loss in AGI: +$3,831 (reported on 14.1% of returns)
Here:
+$3,831
State:
+$18,453
(% of AGI for various income ranges: 5.0% for AGIs below $25k, 8.2% for AGIs $25k-50k, 26.8% for AGIs $50k-75k, 85.5% for AGIs $75k-100k, 347.4% for AGIs $100k-200k)
Profit/loss from business: +$7,838 (reported on 11.7% of returns)
Here:
+$7,838
State:
+$12,260
(% of AGI for various income ranges: 66.0% for AGIs below $25k, 66.8% for AGIs $25k-50k, 93.6% for AGIs $50k-75k, 171.4% for AGIs $75k-100k, 320.9% for AGIs $100k-200k)
Taxable individual retirement arrangement distribution: $16,100 (reported on 10.2% of returns)
63048:
$16,100
Missouri:
$19,719
(% of AGI for various income ranges: 78.3% for AGIs below $25k, 119.4% for AGIs $25k-50k, 278.6% for AGIs $50k-75k, 257.7% for AGIs $75k-100k, 564.8% for AGIs $100k-200k)
Total itemized deductions: $23,231 (reported on 6.3% of returns)
Here:
$23,231
State:
$36,651
(% of AGI for various income ranges: 154.5% for AGIs below $25k, 231.8% for AGIs $50k-75k, 290.5% for AGIs $75k-100k, 470.9% for AGIs $100k-200k)
Charity contributions: $6,912 (reported on 3.9% of returns)
Here:
$6,912
State:
$15,671
(% of AGI for various income ranges: 81.4% for AGIs $50k-75k, 141.3% for AGIs $100k-200k)
Taxes paid: $5,315 (reported on 6.3% of returns)
63048:
$5,315
State:
$7,608
(% of AGI for various income ranges: 14.3% for AGIs below $25k, 38.2% for AGIs $50k-75k, 77.3% for AGIs $75k-100k, 153.9% for AGIs $100k-200k)
Earned income credit: $2,486 (reported on 10.2% of returns)
Here:
$2,486
State:
$2,315
(% of AGI for various income ranges: 77.1% for AGIs below $25k, 58.2% for AGIs $25k-50k)
Percentage of individuals using paid preparers for their 2020 taxes: 94.1%
Here:
94%
State:
93%
(% for various income ranges: 93.1% for AGIs below $25k, 95.2% for AGIs $25k-50k, 94.6% for AGIs $50k-75k, 96.6% for AGIs $75k-100k, 91.7% for AGIs $100k-200k, 100.0% for AGIs over 200k)
Averages for the 2012 tax year for zip code 63048, filed in 2013:
Average Adjusted Gross Income (AGI) in 2012: $52,795 (Individual Income Tax Returns)
Here:
$52,795
State:
$55,896
Salary/wage: $49,394 (reported on 84.9% of returns)
Here:
$49,394
State:
$46,205
(% of AGI for various income ranges: 68.8% for AGIs below $25k, 76.8% for AGIs $25k-50k, 80.3% for AGIs $50k-75k, 86.9% for AGIs $75k-100k, 76.9% for AGIs $100k-200k)
Taxable interest for individuals: $788 (reported on 30.2% of returns)
This zip code:
$788
Missouri:
$1,559
(% of AGI for various income ranges: 1.8% for AGIs below $25k, 0.9% for AGIs $25k-50k, 0.2% for AGIs $50k-75k, 0.2% for AGIs $75k-100k, 0.2% for AGIs $100k-200k)
Ordinary dividends: $2,015 (reported on 17.0% of returns)
Here:
$2,015
State:
$7,410
(% of AGI for various income ranges: 2.5% for AGIs below $25k, 1.0% for AGIs $25k-50k, 0.6% for AGIs $50k-75k, 0.3% for AGIs $75k-100k, 0.4% for AGIs $100k-200k)
Profit/loss from business: +$4,516 (reported on 11.9% of returns)
Here:
+$4,516
State:
+$11,688
(% of AGI for various income ranges: 4.3% for AGIs below $25k, 2.1% for AGIs $25k-50k, 0.2% for AGIs $50k-75k, 0.9% for AGIs $75k-100k, 0.4% for AGIs $100k-200k)
Taxable individual retirement arrangement distribution: $9,581 (reported on 10.1% of returns)
63048:
$9,581
Missouri:
$14,773
(% of AGI for various income ranges: 3.4% for AGIs below $25k, 2.1% for AGIs $25k-50k, 2.2% for AGIs $50k-75k, 3.1% for AGIs $75k-100k)
Total itemized deductions: $16,731 (21% of AGI, reported on 39.0% of returns)
Here:
$16,731
State:
$22,730
Here:
20.7% of AGI
State:
19.2% of AGI
(% of AGI for various income ranges: 9.0% for AGIs below $25k, 10.3% for AGIs $25k-50k, 12.5% for AGIs $50k-75k, 14.2% for AGIs $75k-100k, 12.8% for AGIs $100k-200k)
Charity contributions: $2,386 (reported on 26.4% of returns)
Here:
$2,386
State:
$4,745
(% of AGI for various income ranges: 0.5% for AGIs below $25k, 0.9% for AGIs $25k-50k, 0.9% for AGIs $50k-75k, 1.3% for AGIs $75k-100k, 1.7% for AGIs $100k-200k)
Taxes paid: $5,261 (reported on 39.0% of returns)
63048:
$5,261
State:
$8,399
(% of AGI for various income ranges: 1.3% for AGIs below $25k, 2.4% for AGIs $25k-50k, 3.5% for AGIs $50k-75k, 4.5% for AGIs $75k-100k, 5.2% for AGIs $100k-200k)
Earned income credit: $1,877 (reported on 13.8% of returns)
Here:
$1,877
State:
$2,288
(% of AGI for various income ranges: 4.5% for AGIs below $25k, 1.0% for AGIs $25k-50k)
Percentage of individuals using paid preparers for their 2012 taxes: 52.8%
Here:
53%
State:
55%
(% for various income ranges: 49.0% for AGIs below $25k, 51.4% for AGIs $25k-50k, 56.7% for AGIs $50k-75k, 52.2% for AGIs $75k-100k, 61.1% for AGIs $100k-200k)
Averages for the 2004 tax year for zip code 63048, filed in 2005:
Average Adjusted Gross Income (AGI) in 2004: $44,858 (Individual Income Tax Returns)
Here:
$44,858
State:
$44,591
Salary/wage: $41,941 (reported on 85.4% of returns)
Here:
$41,941
State:
$38,941
(% of AGI for various income ranges: 95.9% for AGIs below $10k, 64.6% for AGIs $10k-25k, 80.5% for AGIs $25k-50k, 84.9% for AGIs $50k-75k, 87.8% for AGIs $75k-100k, 70.2% for AGIs over 100k)
Taxable interest for individuals: $1,879 (reported on 42.8% of returns)
This zip code:
$1,879
Missouri:
$1,801
(% of AGI for various income ranges: 3.6% for AGIs below $10k, 4.4% for AGIs $10k-25k, 1.1% for AGIs $25k-50k, 0.4% for AGIs $50k-75k, 0.4% for AGIs $75k-100k, 4.4% for AGIs over 100k)
Taxable dividends: $1,665 (reported on 20.0% of returns)
Here:
$1,665
State:
$3,677
(% of AGI for various income ranges: 0.5% for AGIs below $10k, 2.5% for AGIs $10k-25k, 0.7% for AGIs $25k-50k, 0.4% for AGIs $50k-75k, 0.1% for AGIs $75k-100k, 1.2% for AGIs over 100k)
Net capital gain/loss: +$6,802 (reported on 14.8% of returns)
Here:
+$6,802
State:
+$8,915
(% of AGI for various income ranges: 0.2% for AGIs below $10k, 0.8% for AGIs $10k-25k, -0.2% for AGIs $25k-50k, 0.1% for AGIs $50k-75k, 0.9% for AGIs $75k-100k, 9.1% for AGIs over 100k)
Profit/loss from business: +$6,369 (reported on 10.2% of returns)
Here:
+$6,369
State:
+$9,793
(% of AGI for various income ranges: 0.5% for AGIs below $10k, 4.4% for AGIs $10k-25k, 1.3% for AGIs $25k-50k, 1.8% for AGIs $50k-75k, 0.8% for AGIs $75k-100k, 0.8% for AGIs over 100k)
IRA payment deduction: $2,370 (reported on 2.3% of returns)
63048:
$2,370
Missouri:
$2,972
Total itemized deductions: $15,799 (22% of AGI, reported on 38.7% of returns)
Here:
$15,799
State:
$18,261
Here:
22.1% of AGI
State:
20.5% of AGI
(% of AGI for various income ranges: 8.1% for AGIs $10k-25k, 11.1% for AGIs $25k-50k, 14.7% for AGIs $50k-75k, 14.9% for AGIs $75k-100k, 16.6% for AGIs over 100k)
Charity contributions deductions: $1,940 (3% of AGI, reported on 31.9% of returns)
Here:
$1,940
State:
$3,665
Here:
2.6% of AGI
State:
3.9% of AGI
(% of AGI for various income ranges: 1.5% for AGIs $10k-25k, 1.5% for AGIs $25k-50k, 1.2% for AGIs $50k-75k, 1.1% for AGIs $75k-100k, 1.8% for AGIs over 100k)
Total tax: $5,156 (reported on 81.1% of returns)
63048:
$5,156
State:
$6,999
(% of AGI for various income ranges: 2.6% for AGIs below $10k, 4.2% for AGIs $10k-25k, 7.1% for AGIs $25k-50k, 8.3% for AGIs $50k-75k, 9.9% for AGIs $75k-100k, 14.6% for AGIs over 100k)
Earned income credit: $1,349 (reported on 9.1% of returns)
Here:
$1,349
State:
$1,728
Percentage of individuals using paid preparers for their 2004 taxes: 61.2%
Here:
61%
State:
62%
(% for various income ranges: 44.0% for AGIs below $10k, 60.8% for AGIs $10k-25k, 68.3% for AGIs $25k-50k, 62.6% for AGIs $50k-75k, 64.1% for AGIs $75k-100k, 69.0% for AGIs over 100k)
Household received Food Stamps/SNAP in the past 12 months: 65 Household did not receive Food Stamps/SNAP in the past 12 months: 1,516
Women who had a birth in the past 12 months: 11 (11 now married, 0 unmarried) Women who did not have a birth in the past 12 months: 823 (321 now married, 503 unmarried)
Housing units in zip code 63048 with a mortgage: 1,088 (40 second mortgage, 33 both second mortgage and home equity loan) Houses without a mortgage: 4
Median monthly owner costs for units with a mortgage: $1,286 Median monthly owner costs for units without a mortgage: $523
Residents with income below the poverty level in 2022:
This zip code:
6.4%
Whole state:
13.2%
Residents with income below 50% of the poverty level in 2022:
This zip code:
4.9%
Whole state:
6.8%
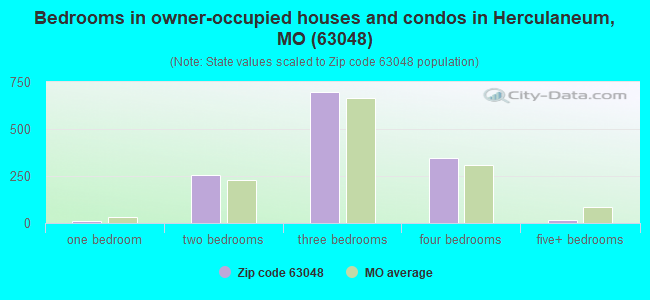
Median number of rooms in houses and condos:
Here:
6.1
State:
6.4
Median number of rooms in apartments:
Here:
2.2
State:
4.4
Notable locations in this zip code not listed on our city pages
In group quarters: 152 (-1 institutionalized population)
Size of family households: 467 2-persons, 286 3-persons, 172 4-persons, 54 5-persons, 56 6-persons, 12 7-or-more-persons
Size of nonfamily households: 493 1-person, 23 2-persons, 20 4-persons
278 married couples with children.
235 single-parent households (21 men, 214 women).
99.4% of residents of 63048 zip code speak English at home.
0.3% of residents speak Spanish at home (100% very well).
0.3% of residents speak Asian or Pacific Island language at home (100% very well).
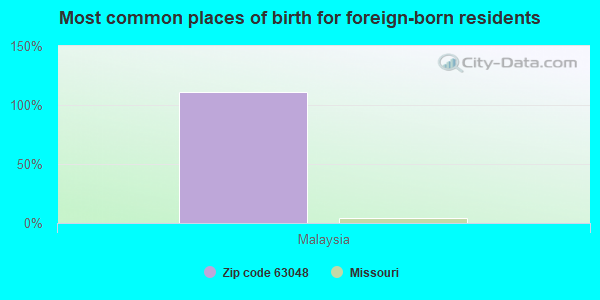
Foreign born population: 9 (0.2%) (100.0% of them are naturalized citizens)
This zip code:
0.2%
Whole state:
4.1%
111%Malaysia
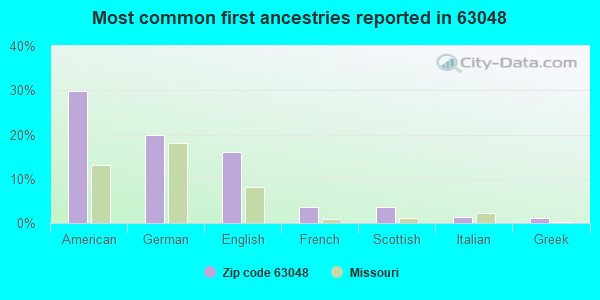
30%American
20%German
16%English
4%French
4%Scottish
1%Italian
1%Greek
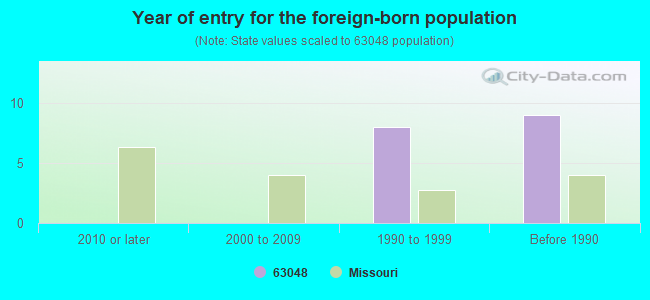
Year of entry for the foreign-born population
02010 or later
02000 to 2009
81990 to 1999
9Before 1990
Major facilities with environmental interests located in this zip code:
BAUMAN OIL BULK PLANT (1503 COMMERCIAL BLVD. in HERCULANEUM, MO)
AIR MINOR (AIRS/AFS) (Integrated Compliance Information System) - ICIS-07-2001-0064, FORMAL ENFORCEMENT ACTION STATE MASTER (Missouri monitoring and compilance) - ICIS-7015, ENFORCEMENT/COMPLIANCE ACTIVITY, AIRS/AFS-MO0806419, AIR MINOR Business SIC classification: PETROLEUM BULK STATIONS AND TERMINALS
HERCULANEUM SEWER DIST (SCHOOL STREET in HERCULANEUM, MO)
STATE MASTER (Missouri monitoring and compilance) - PCS-MO0027111, NPDES NON-MAJOR National Pollutant Discharge Elimination System NON-MAJOR (Tracking pollutant discharge elimination systems) - permit - ICIS-, ENFORCEMENT/COMPLIANCE ACTIVITY Business SIC classification: SEWERAGE SYSTEMS Organizations: CITY OF HERCULANEUM (CONTACT/OWNER)
Alternative names: HERCULANEUM SEW DIST WWTP, HERCULANEUM WASTEWATER TR
BUCHHEIT (200 RIVERVIEW DRIVE in HERCULANEUM, MO)
STATE MASTER (Missouri monitoring and compilance) - PCS-MOR103447, NPDES NON-MAJOR National Pollutant Discharge Elimination System NON-MAJOR (Tracking pollutant discharge elimination systems) - permit Business SIC classification: GENERAL CONTRACTORS-INDUSTRIAL BUILDINGS AND WAREHOUSES Organizations: BUCHHEIT, INC. (CONTACT/OWNER)
Alternative names: BUCHHEIT INC-HERCULANEUM
BOBCAT OF ST LOUIS (1225 MCNUTT ST in HERCULANEUM, MO)
STATE MASTER (Missouri monitoring and compilance) - RCRAINFO-MOD985818772, CESQG Conditionally Exempt Small Quantity Generators, less than 100 kg/month of hazardous waste (Resource Conservation and Recovery Act (tracking hazardous waste)) - notification Organizations: DAN ANICH (CONTACT/OPERATOR)
, WILLIAM T WINNING JR (CONTACT/OWNER)
Alternative names: WINNING EQUIPMENT CO
JCWA HERCULANEUM LOOP WAT (HWY55/MCNUTT ST/HWY 61-67 in HERCULANEUM, MO)
STATE MASTER (Missouri monitoring and compilance) - PCS-MOR104674, NPDES NON-MAJOR, PCS-MOR109640, National Pollutant Discharge Elimination System NON-MAJOR (Tracking pollutant discharge elimination systems) - permit Business SIC classification: HEAVY CONSTRUCTION Organizations: JEFFERSON CO WATER AUTHOR (CONTACT/OWNER)
Alternative names: JEFFERSON CO WATER AUTHOR, JEFFERSON CO WATER AUTHOR
QUIKTRIP STORE NUMBER 611 (850 MCNUTT STREET in HERCULANEUM, MO)
STATE MASTER (Missouri monitoring and compilance) - RCRAINFO-MOD985820422, CESQG, PCS-MOG140005, NPDES NON-MAJOR Conditionally Exempt Small Quantity Generators, less than 100 kg/month of hazardous waste (Resource Conservation and Recovery Act (tracking hazardous waste)) - notification Business SIC classification: GASOLINE SERVICE STATIONS Organizations: QUIKTRIP CORP (CONTACT/OWNER)
PRECISION PLASTICS INC (1550 HERCULANEUM IND CT in HERCULANEUM, MO)
STATE MASTER (Missouri monitoring and compilance) - NCDB-C07#0514909999908, COMPLIANCE ACTIVITY COMPLIANCE ACTIVITY (Tracking inspections of insecticide, fungicide, and rodenticide, and toxic substances)
HERCULANEUM ELEM. (400 JOACHIM in HERCULANEUM, MO)
(National Center for Education Statistics) - STATE ID-4020050005 Organizations: DUNKLIN R-V (SCHOOL DISTRICT)
HERCULANEUM HIGH (1 BLACKCAT DR in HERCULANEUM, MO)
(National Center for Education Statistics) - STATE ID-1050050005 Organizations: DUNKLIN R-V (SCHOOL DISTRICT)
AMERICAN HERITAGE HOMES L (MCNUTT RD @ SCHOOL RD in HERCULANEUM, MO)
National Pollutant Discharge Elimination System NON-MAJOR (Tracking pollutant discharge elimination systems) - permit Business SIC classification: HEAVY CONSTRUCTION Alternative names: PROVIDENCE (NORTH) - AMER
OAK HILL TERRACE SUBDIVIS (MAIN ST in HERCULANEUM, MO)
National Pollutant Discharge Elimination System NON-MAJOR (Tracking pollutant discharge elimination systems) - permit Business SIC classification: HEAVY CONSTRUCTION Organizations: W. N. BROCK HOMES (CONTACT/OWNER)
Alternative names: W. N. BROCK HOMES
PROVIDENCE (NORTH) - AMER (MCNUTT & SCHOOL RD in HERCULANEUM, MO)
National Pollutant Discharge Elimination System NON-MAJOR (Tracking pollutant discharge elimination systems) - permit Business SIC classification: HEAVY CONSTRUCTION Organizations: AMERICAN HERITAGE HOMES L (CONTACT/OWNER)
Alternative names: AMERICAN HERITAGE HOMES L
PROVIDENCE (NORTH) - HERK (MCNUTT RD & SCHOOL RD in HERCULANEUM, MO)
National Pollutant Discharge Elimination System NON-MAJOR (Tracking pollutant discharge elimination systems) - permit Business SIC classification: GENERAL CONTRACTORS-SINGLE-FAMILY HOUSES Organizations: HERKY LLC (CONTACT/OWNER)
Alternative names: HERKY LLC, PROVIDENCE (SOUTH PHASE)
Housing units lacking complete plumbing facilities: 0.9% Housing units lacking complete kitchen facilities: 5.4%
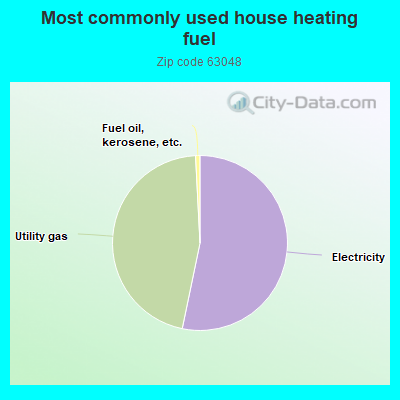
53.1%Electricity
45.8%Utility gas
0.8%Fuel oil, kerosene, etc.
Population in 1990: 2,490.
Place of birth for U.S.-born residents:
This state: 3,092
Northeast: 44
Midwest: 514
South: 209
West: 154
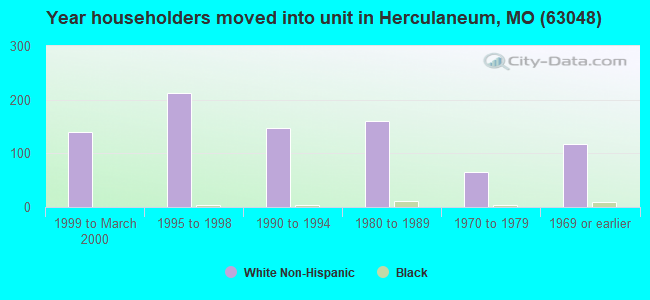
64% of the 63048 zip code residents lived in the same house 5 years ago. Out of people who lived in different houses, 68% lived in this county. Out of people who lived in different counties, 50% lived in Missouri.
86% of the 63048 zip code residents lived in the same house 1 year ago. Out of people who lived in different houses, 47% moved from this county. Out of people who lived in different houses, 25% moved from different county within same state. Out of people who lived in different houses, 27% moved from different state.
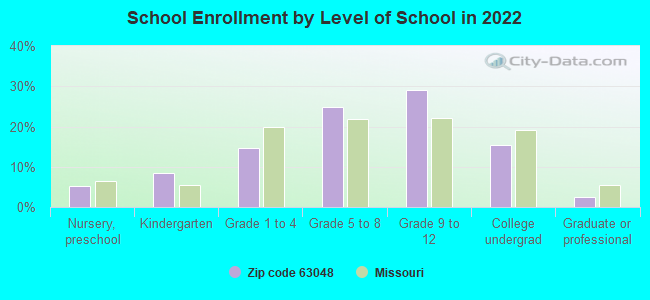
Private vs. public school enrollment:
Students in private schools in grades 1 to 8 (elementary and middle school):
Here:
0.0%
Missouri:
15.4%
Students in private schools in grades 9 to 12 (high school): 12
Here:
5.2%
Missouri:
13.9%
Students in private undergraduate colleges: 42
Here:
33.1%
Missouri:
22.6%
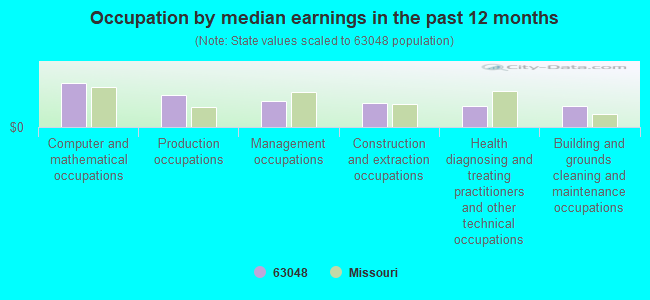
Occupation by median earnings in the past 12 months ($)
122,637Computer and mathematical occupations
88,172Production occupations
71,196Management occupations
66,724Construction and extraction occupations
59,329Health diagnosing and treating practitioners and other technical occupations
57,382Building and grounds cleaning and maintenance occupations
Companies with federal contracts located in this zip code:
ESSEX CONTRACTING, INC (1519 MCNUTT ROAD in HERCULANEUM, MO; small business) : $6,158,732 in 18 contractsfrom 2004 to 2005
Contracts for Construction of Structures and Facilities -- Water Supply Facilities by Army, U.S. Army Corps of Engineers - civil program financing only Signed by year:2000: $0; 2001: $0; 2002: $0; 2003: $0; 2004: $1,600,000; 2005: $4,558,732; 2006: $0.
Biggest contracts:
$1,500,000 with Army for Construction of Structures and Facilities -- Water Supply Facilities. Signed on 2005-02-22. Completion date: 2004-05-17.
$1,500,000 with U.S. Army Corps of Engineers - civil program financing only for Construction of Structures and Facilities -- Water Supply Facilities. Signed on 2005-02-22. Completion date: 2004-05-17.
$975,000 with Army for Construction of Structures and Facilities -- Water Supply Facilities. Signed on 2005-11-18. Completion date: 2004-05-17.
$725,000 with U.S. Army Corps of Engineers - civil program financing only for Construction of Structures and Facilities -- Water Supply Facilities. Signed on 2004-09-14. Completion date: 2004-05-17.
WERNER BROTHERS, INC. (1538 HERCULANEUM INDUSTRIA in HERCULANEUM, MO; small business)
$19,440 with U.S. Army Corps of Engineers - civil program financing only for Construction of Structures and Facilities -- Other Conservation and Development Facilities. Signed on 2000-02-14. Completion date: 1999-11-18.
Top industries in this zip code by the number of employees in 2005:
Health Care and Social Assistance: Nursing Care Facilities (100-249 employees: 1 establishment, 20-49 employees: 1 establishment)
Accommodation and Food Services: Limited-Service Restaurants (50-99: 1, 20-49: 1)
Health Care and Social Assistance: Offices of Physical, Occupational and Speech Therapists, and Audiologists (20-49: 1, 1-4: 1)
Wholesale Trade: Industrial Machinery and Equipment Merchant Wholesalers (20-49: 1)
Construction: Power and Communication Line and Related Structures Construction (20-49: 1)
Construction: Water and Sewer Line and Related Structures Construction (20-49: 1)
People in group quarters in 2010:
152 people in nursing facilities/skilled-nursing facilities
People in group quarters in 2000:
161 people in nursing homes
51 people in other noninstitutional group quarters
Fatal accident statistics in 2010:
Fatal accident count: 1
Vehicles involved in fatal accidents: 8
Fatal accidents caused by drunken drivers: 0
Fatalities: 2
Persons involved in fatal accidents: 11
Pedestrians involved in fatal accidents: 0
Home Mortgage Disclosure Act Aggregated Statistics For Year 2009 (Based on 2 partial tracts)
A) FHA, FSA/RHS & VA Home Purchase Loans
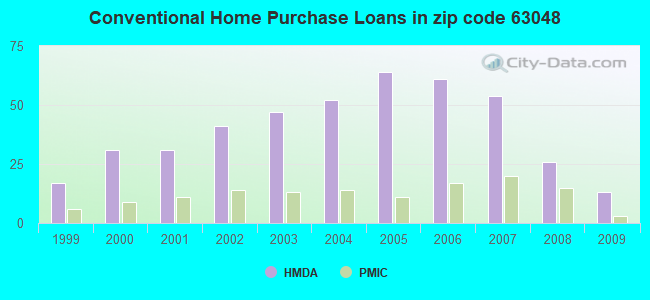
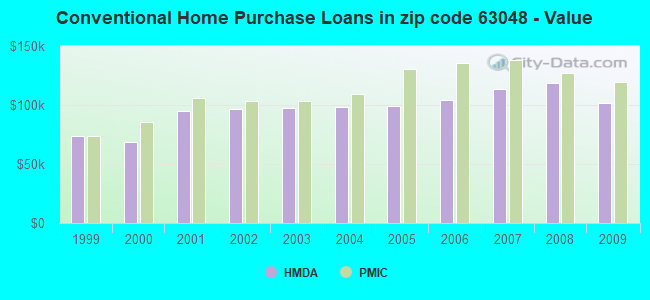
B) Conventional Home Purchase Loans
C) Refinancings
D) Home Improvement Loans
F) Non-occupant Loans on < 5 Family Dwellings (A B C & D)
Number
Average Value
Number
Average Value
Number
Average Value
Number
Average Value
Number
Average Value
LOANS ORIGINATED
33
$129,639
13
$101,538
92
$137,053
3
$19,063
6
$100,583
APPLICATIONS APPROVED, NOT ACCEPTED
3
$157,583
1
$44,420
8
$129,292
2
$7,775
0
$0
APPLICATIONS DENIED
4
$116,870
1
$126,860
32
$137,932
4
$44,138
2
$83,835
APPLICATIONS WITHDRAWN
3
$122,330
1
$123,530
19
$136,360
1
$62,740
1
$92,160
FILES CLOSED FOR INCOMPLETENESS
0
$0
0
$0
2
$156,985
0
$0
0
$0
Aggregated Statistics For Year 2008 (Based on 2 partial tracts)
A) FHA, FSA/RHS & VA Home Purchase Loans
B) Conventional Home Purchase Loans
C) Refinancings
D) Home Improvement Loans
F) Non-occupant Loans on < 5 Family Dwellings (A B C & D)
G) Loans On Manufactured Home Dwelling (A B C & D)
Number
Average Value
Number
Average Value
Number
Average Value
Number
Average Value
Number
Average Value
Number
Average Value
LOANS ORIGINATED
24
$133,398
26
$118,557
53
$143,367
6
$42,333
11
$96,125
0
$0
APPLICATIONS APPROVED, NOT ACCEPTED
2
$162,950
2
$134,635
8
$137,239
1
$23,870
1
$61,350
0
$0
APPLICATIONS DENIED
3
$134,360
5
$88,054
26
$133,259
6
$33,450
1
$103,270
3
$48,857
APPLICATIONS WITHDRAWN
2
$132,415
2
$158,785
13
$134,273
2
$39,560
1
$144,070
0
$0
FILES CLOSED FOR INCOMPLETENESS
0
$0
0
$0
1
$195,150
0
$0
0
$0
0
$0
Aggregated Statistics For Year 2007 (Based on 2 partial tracts)
A) FHA, FSA/RHS & VA Home Purchase Loans
B) Conventional Home Purchase Loans
C) Refinancings
D) Home Improvement Loans
E) Loans on Dwellings For 5+ Families
F) Non-occupant Loans on < 5 Family Dwellings (A B C & D)
G) Loans On Manufactured Home Dwelling (A B C & D)
Number
Average Value
Number
Average Value
Number
Average Value
Number
Average Value
Number
Average Value
Number
Average Value
Number
Average Value
LOANS ORIGINATED
12
$135,422
54
$113,806
72
$124,241
11
$51,735
1
$336,450
16
$91,192
1
$82,720
APPLICATIONS APPROVED, NOT ACCEPTED
0
$0
5
$113,316
17
$133,656
4
$32,202
0
$0
1
$53,580
0
$0
APPLICATIONS DENIED
3
$129,177
11
$106,371
52
$127,872
10
$71,815
0
$0
2
$102,575
1
$26,650
APPLICATIONS WITHDRAWN
1
$96,880
4
$160,870
21
$119,011
1
$121,310
0
$0
1
$128,250
0
$0
FILES CLOSED FOR INCOMPLETENESS
0
$0
2
$83,695
6
$123,717
0
$0
0
$0
1
$67,180
0
$0
Aggregated Statistics For Year 2006 (Based on 2 partial tracts)
A) FHA, FSA/RHS & VA Home Purchase Loans
B) Conventional Home Purchase Loans
C) Refinancings
D) Home Improvement Loans
F) Non-occupant Loans on < 5 Family Dwellings (A B C & D)
G) Loans On Manufactured Home Dwelling (A B C & D)
Number
Average Value
Number
Average Value
Number
Average Value
Number
Average Value
Number
Average Value
Number
Average Value
LOANS ORIGINATED
15
$124,309
61
$104,132
80
$105,498
12
$34,214
10
$80,754
1
$31,920
APPLICATIONS APPROVED, NOT ACCEPTED
1
$82,720
9
$94,013
22
$109,147
2
$46,775
2
$91,470
1
$53,020
APPLICATIONS DENIED
2
$107,430
15
$96,197
47
$117,697
10
$43,444
3
$94,290
3
$39,050
APPLICATIONS WITHDRAWN
1
$169,340
5
$114,760
31
$118,374
2
$121,730
2
$84,670
0
$0
FILES CLOSED FOR INCOMPLETENESS
0
$0
5
$90,498
11
$133,905
0
$0
0
$0
0
$0
Aggregated Statistics For Year 2005 (Based on 2 partial tracts)
A) FHA, FSA/RHS & VA Home Purchase Loans
B) Conventional Home Purchase Loans
C) Refinancings
D) Home Improvement Loans
E) Loans on Dwellings For 5+ Families
F) Non-occupant Loans on < 5 Family Dwellings (A B C & D)
G) Loans On Manufactured Home Dwelling (A B C & D)
Number
Average Value
Number
Average Value
Number
Average Value
Number
Average Value
Number
Average Value
Number
Average Value
Number
Average Value
LOANS ORIGINATED
6
$126,400
64
$99,277
87
$102,345
12
$55,034
1
$37,480
16
$80,209
1
$43,030
APPLICATIONS APPROVED, NOT ACCEPTED
0
$0
8
$82,690
17
$108,558
1
$41,360
0
$0
1
$134,640
1
$17,210
APPLICATIONS DENIED
1
$90,500
15
$98,289
42
$107,325
11
$66,952
0
$0
3
$129,640
4
$40,600
APPLICATIONS WITHDRAWN
1
$86,890
3
$100,583
37
$119,556
3
$129,917
0
$0
1
$62,180
0
$0
FILES CLOSED FOR INCOMPLETENESS
0
$0
1
$127,140
6
$102,018
1
$56,630
0
$0
0
$0
0
$0
Aggregated Statistics For Year 2004 (Based on 2 partial tracts)
A) FHA, FSA/RHS & VA Home Purchase Loans
B) Conventional Home Purchase Loans
C) Refinancings
D) Home Improvement Loans
F) Non-occupant Loans on < 5 Family Dwellings (A B C & D)
G) Loans On Manufactured Home Dwelling (A B C & D)
Number
Average Value
Number
Average Value
Number
Average Value
Number
Average Value
Number
Average Value
Number
Average Value
LOANS ORIGINATED
14
$106,638
52
$98,089
92
$100,708
7
$51,316
14
$82,249
1
$68,010
APPLICATIONS APPROVED, NOT ACCEPTED
1
$156,290
8
$98,270
14
$111,239
2
$27,620
1
$82,170
1
$28,320
APPLICATIONS DENIED
2
$103,820
13
$86,483
41
$107,269
5
$48,246
2
$121,590
3
$29,517
APPLICATIONS WITHDRAWN
1
$91,610
5
$83,558
39
$108,285
2
$32,340
2
$95,355
0
$0
FILES CLOSED FOR INCOMPLETENESS
1
$112,980
1
$133,250
4
$112,080
1
$8,330
0
$0
0
$0
Aggregated Statistics For Year 2003 (Based on 2 partial tracts)
A) FHA, FSA/RHS & VA Home Purchase Loans
B) Conventional Home Purchase Loans
C) Refinancings
D) Home Improvement Loans
F) Non-occupant Loans on < 5 Family Dwellings (A B C & D)
Number
Average Value
Number
Average Value
Number
Average Value
Number
Average Value
Number
Average Value
LOANS ORIGINATED
15
$103,730
47
$97,272
179
$97,421
3
$15,637
17
$61,301
APPLICATIONS APPROVED, NOT ACCEPTED
1
$38,030
5
$80,392
18
$99,181
0
$0
2
$63,710
APPLICATIONS DENIED
1
$147,680
9
$96,790
52
$97,112
3
$29,333
2
$52,050
APPLICATIONS WITHDRAWN
3
$104,563
2
$71,760
38
$97,723
1
$3,610
0
$0
FILES CLOSED FOR INCOMPLETENESS
0
$0
2
$57,740
7
$105,250
1
$23,040
1
$73,560
Aggregated Statistics For Year 2002 (Based on 2 partial tracts)
A) FHA, FSA/RHS & VA Home Purchase Loans
B) Conventional Home Purchase Loans
C) Refinancings
D) Home Improvement Loans
F) Non-occupant Loans on < 5 Family Dwellings (A B C & D)
Number
Average Value
Number
Average Value
Number
Average Value
Number
Average Value
Number
Average Value
LOANS ORIGINATED
21
$107,365
41
$96,368
115
$98,422
4
$24,568
7
$75,587
APPLICATIONS APPROVED, NOT ACCEPTED
2
$92,300
6
$91,840
23
$99,091
1
$36,370
2
$71,760
APPLICATIONS DENIED
2
$127,695
9
$67,457
31
$86,996
3
$15,267
1
$77,730
APPLICATIONS WITHDRAWN
3
$92,347
2
$121,170
21
$109,798
0
$0
1
$41,360
FILES CLOSED FOR INCOMPLETENESS
0
$0
1
$38,860
5
$107,598
0
$0
0
$0
Aggregated Statistics For Year 2001 (Based on 2 partial tracts)
A) FHA, FSA/RHS & VA Home Purchase Loans
B) Conventional Home Purchase Loans
C) Refinancings
D) Home Improvement Loans
F) Non-occupant Loans on < 5 Family Dwellings (A B C & D)
Number
Average Value
Number
Average Value
Number
Average Value
Number
Average Value
Number
Average Value
LOANS ORIGINATED
26
$96,263
31
$95,306
104
$86,643
7
$21,256
12
$71,528
APPLICATIONS APPROVED, NOT ACCEPTED
0
$0
9
$55,921
14
$81,496
1
$24,430
1
$42,470
APPLICATIONS DENIED
2
$80,505
8
$59,996
34
$79,843
6
$16,287
2
$44,275
APPLICATIONS WITHDRAWN
2
$92,995
6
$74,165
30
$86,713
1
$12,770
1
$39,140
FILES CLOSED FOR INCOMPLETENESS
0
$0
1
$58,020
4
$95,772
0
$0
0
$0
Aggregated Statistics For Year 2000 (Based on 2 partial tracts)
A) FHA, FSA/RHS & VA Home Purchase Loans
B) Conventional Home Purchase Loans
C) Refinancings
D) Home Improvement Loans
F) Non-occupant Loans on < 5 Family Dwellings (A B C & D)
Number
Average Value
Number
Average Value
Number
Average Value
Number
Average Value
Number
Average Value
LOANS ORIGINATED
18
$80,612
31
$68,907
41
$63,347
8
$18,565
8
$44,381
APPLICATIONS APPROVED, NOT ACCEPTED
2
$48,860
4
$66,902
9
$60,147
5
$17,878
1
$68,010
APPLICATIONS DENIED
5
$57,686
7
$66,149
22
$47,899
6
$26,510
2
$35,950
APPLICATIONS WITHDRAWN
2
$86,055
1
$91,050
10
$57,186
1
$59,130
0
$0
FILES CLOSED FOR INCOMPLETENESS
0
$0
1
$73,010
2
$73,010
0
$0
0
$0
Aggregated Statistics For Year 1999 (Based on 1 partial tract)
A) FHA, FSA/RHS & VA Home Purchase Loans
B) Conventional Home Purchase Loans
C) Refinancings
D) Home Improvement Loans
F) Non-occupant Loans on < 5 Family Dwellings (A B C & D)
Detailed PMIC statistics for the following Tracts:7008.00
2004 - 2018 National Fire Incident Reporting System (NFIRS) incidents
Based on the data from the years 2004 - 2018 the average number of fires per year is 23. The highest number of reported fire incidents - 39 took place in 2012, and the least - 11 in 2004. The data has a growing trend.
When looking into fire subcategories, the most reports belonged to: Structure Fires (47.6%), and Outside Fires (31.1%).
Fire incident types reported to NFIRS in Zip Code 63048


 Nearest zip codes: 63019, 63070, 62295, 63057, 63012, 63053.


 Based on the data from the years 2004 - 2018 the average number of fires per year is 23. The highest number of reported fire incidents - 39 took place in 2012, and the least - 11 in 2004. The data has a growing trend.
 When looking into fire subcategories, the most reports belonged to: Structure Fires (47.6%), and Outside Fires (31.1%).