Estimated zip code population in 2022: 23,096 Zip code population in 2010: 21,973 Zip code population in 2000: 23,471
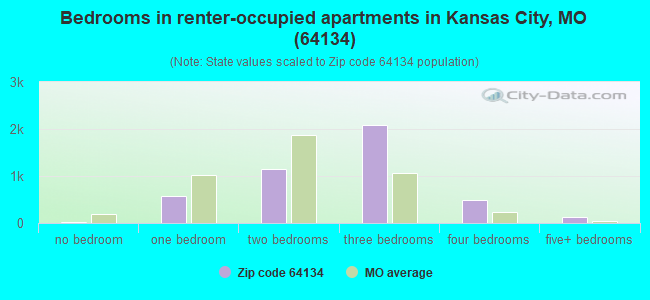
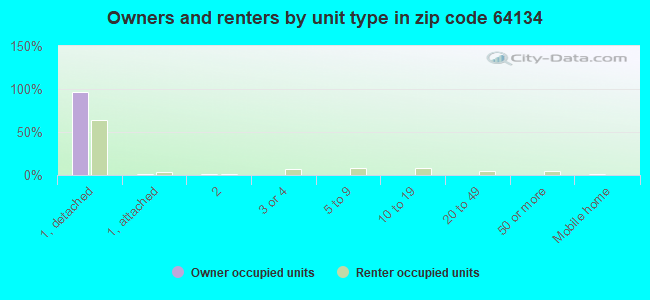
Houses and condos: 9,918 Renter-occupied apartments: 4,489
% of renters here:
49%
State:
32%
March 2022 cost of living index in zip code 64134: 86.5 (less than average, U.S. average is 100)
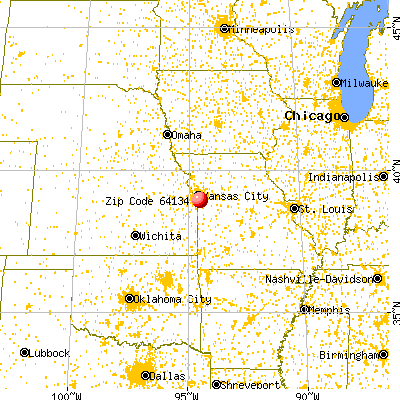
Land area: 11.9 sq. mi. Water area: 0.9 sq. mi.
Population density: 1,939 people per square mile
(low).
OSM Map
General Map
Google Map
MSN Map
OSM Map
General Map
Google Map
MSN Map
OSM Map
General Map
Google Map
MSN Map
OSM Map
General Map
Google Map
MSN Map
Please wait while loading the map...
Real estate property taxes paid for housing units in 2022:
This zip code:
1.1% ($1,558)
Missouri:
0.8% ($1,810)
Median real estate property taxes paid for housing units with mortgages in 2022: $1,523 (1.1%) Median real estate property taxes paid for housing units with no mortgage in 2022: $1,638 (1.2%)
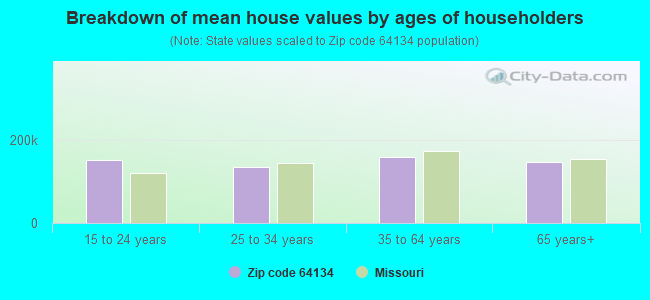
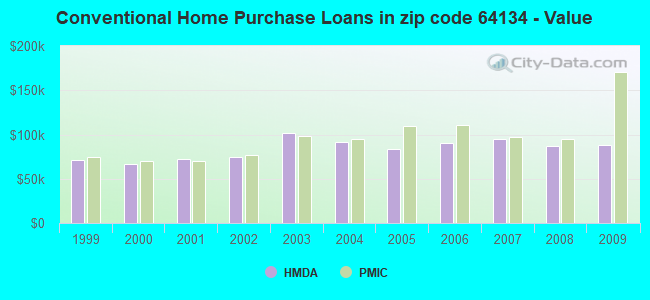
Estimated median house/condo value in 2022: $141,107
64134:
$141,107
Missouri:
$221,200
According to our research of Missouri and other state lists, there were 58 registered sex offenders living in 64134 zip code as of April 25, 2024. The ratio of all residents to sex offenders in zip code 64134 is 416 to 1. The ratio of registered sex offenders to all residents in this zip code is lower than the state average.
Median resident age:
This zip code:
31.8 years
Missouri median age:
39.1 years
Average household size:
This zip code:
2.5 people
Missouri:
2.4 people
Averages for the 2020 tax year for zip code 64134, filed in 2021:
Average Adjusted Gross Income (AGI) in 2020: $37,029 (Individual Income Tax Returns)
Here:
$37,029
State:
$68,151
Salary/wage: $34,081 (reported on 87.0% of returns)
Here:
$34,081
State:
$56,131
(% of AGI for various income ranges: 1198.9% for AGIs below $25k, 3958.2% for AGIs $25k-50k, 7464.4% for AGIs $50k-75k, 10668.4% for AGIs $75k-100k, 14751.2% for AGIs $100k-200k)
Taxable interest for individuals: $532 (reported on 13.1% of returns)
This zip code:
$532
Missouri:
$1,586
(% of AGI for various income ranges: 5.0% for AGIs below $25k, 4.5% for AGIs $25k-50k, 16.3% for AGIs $50k-75k, 18.6% for AGIs $75k-100k, 78.5% for AGIs $100k-200k)
Ordinary dividends: $1,950 (reported on 5.3% of returns)
Here:
$1,950
State:
$10,947
(% of AGI for various income ranges: 3.6% for AGIs below $25k, 7.8% for AGIs $25k-50k, 21.6% for AGIs $50k-75k, 42.7% for AGIs $75k-100k, 144.2% for AGIs $100k-200k)
Net capital gain/loss in AGI: +$4,467 (reported on 4.6% of returns)
Here:
+$4,467
State:
+$18,453
(% of AGI for various income ranges: 2.2% for AGIs below $25k, 6.7% for AGIs $25k-50k, 29.8% for AGIs $50k-75k, 100.3% for AGIs $75k-100k, 467.3% for AGIs $100k-200k)
Profit/loss from business: +$5,081 (reported on 13.2% of returns)
Here:
+$5,081
State:
+$12,260
(% of AGI for various income ranges: 87.0% for AGIs below $25k, 57.5% for AGIs $25k-50k, 110.0% for AGIs $50k-75k, 182.4% for AGIs $75k-100k, 240.4% for AGIs $100k-200k)
Taxable individual retirement arrangement distribution: $13,287 (reported on 4.4% of returns)
64134:
$13,287
Missouri:
$19,719
(% of AGI for various income ranges: 19.8% for AGIs below $25k, 37.9% for AGIs $25k-50k, 124.9% for AGIs $50k-75k, 288.4% for AGIs $75k-100k, 787.7% for AGIs $100k-200k)
Total itemized deductions: $24,205 (reported on 3.6% of returns)
Here:
$24,205
State:
$36,651
(% of AGI for various income ranges: 21.9% for AGIs below $25k, 66.6% for AGIs $25k-50k, 226.4% for AGIs $50k-75k, 484.1% for AGIs $75k-100k, 970.8% for AGIs $100k-200k)
Charity contributions: $9,139 (reported on 3.0% of returns)
Here:
$9,139
State:
$15,671
(% of AGI for various income ranges: 1.6% for AGIs below $25k, 16.7% for AGIs $25k-50k, 74.3% for AGIs $50k-75k, 141.9% for AGIs $75k-100k, 403.1% for AGIs $100k-200k)
Taxes paid: $5,447 (reported on 3.6% of returns)
64134:
$5,447
State:
$7,608
(% of AGI for various income ranges: 2.5% for AGIs below $25k, 12.3% for AGIs $25k-50k, 49.3% for AGIs $50k-75k, 130.3% for AGIs $75k-100k, 256.2% for AGIs $100k-200k)
Earned income credit: $2,695 (reported on 29.6% of returns)
Here:
$2,695
State:
$2,315
(% of AGI for various income ranges: 156.7% for AGIs below $25k, 101.6% for AGIs $25k-50k)
Percentage of individuals using paid preparers for their 2020 taxes: 90.7%
Here:
91%
State:
93%
(% for various income ranges: 91.7% for AGIs below $25k, 91.2% for AGIs $25k-50k, 87.8% for AGIs $50k-75k, 88.1% for AGIs $75k-100k, 88.1% for AGIs $100k-200k, 100.0% for AGIs over 200k)
Averages for the 2012 tax year for zip code 64134, filed in 2013:
Average Adjusted Gross Income (AGI) in 2012: $32,935 (Individual Income Tax Returns)
Here:
$32,935
State:
$55,896
Salary/wage: $29,993 (reported on 87.7% of returns)
Here:
$29,993
State:
$46,205
(% of AGI for various income ranges: 79.6% for AGIs below $25k, 84.5% for AGIs $25k-50k, 78.4% for AGIs $50k-75k, 78.8% for AGIs $75k-100k, 71.8% for AGIs $100k-200k)
Taxable interest for individuals: $732 (reported on 15.8% of returns)
This zip code:
$732
Missouri:
$1,559
(% of AGI for various income ranges: 0.4% for AGIs below $25k, 0.3% for AGIs $25k-50k, 0.3% for AGIs $50k-75k, 0.1% for AGIs $75k-100k, 0.7% for AGIs $100k-200k)
Ordinary dividends: $1,906 (reported on 6.8% of returns)
Here:
$1,906
State:
$7,410
(% of AGI for various income ranges: 0.4% for AGIs below $25k, 0.2% for AGIs $25k-50k, 0.3% for AGIs $50k-75k, 0.3% for AGIs $75k-100k, 1.1% for AGIs $100k-200k)
Net capital gain/loss in AGI: +$2,160 (reported on 4.1% of returns)
Here:
+$2,160
State:
+$11,579
(% of AGI for various income ranges: 0.1% for AGIs $50k-75k, 1.8% for AGIs $100k-200k)
Profit/loss from business: +$6,363 (reported on 11.2% of returns)
Here:
+$6,363
State:
+$11,688
(% of AGI for various income ranges: 7.0% for AGIs below $25k, 0.9% for AGIs $25k-50k, 0.6% for AGIs $50k-75k, 1.3% for AGIs $75k-100k, 1.5% for AGIs $100k-200k)
Taxable individual retirement arrangement distribution: $11,090 (reported on 6.3% of returns)
64134:
$11,090
Missouri:
$14,773
(% of AGI for various income ranges: 1.5% for AGIs below $25k, 1.5% for AGIs $25k-50k, 1.9% for AGIs $50k-75k, 2.9% for AGIs $75k-100k, 4.5% for AGIs $100k-200k)
Total itemized deductions: $15,412 (25% of AGI, reported on 20.7% of returns)
Here:
$15,412
State:
$22,730
Here:
25.4% of AGI
State:
19.2% of AGI
(% of AGI for various income ranges: 4.5% for AGIs below $25k, 8.1% for AGIs $25k-50k, 12.0% for AGIs $50k-75k, 12.7% for AGIs $75k-100k, 14.8% for AGIs $100k-200k)
Charity contributions: $3,878 (reported on 16.8% of returns)
Here:
$3,878
State:
$4,745
(% of AGI for various income ranges: 0.7% for AGIs below $25k, 1.5% for AGIs $25k-50k, 2.5% for AGIs $50k-75k, 2.6% for AGIs $75k-100k, 3.6% for AGIs $100k-200k)
Taxes paid: $4,888 (reported on 20.7% of returns)
64134:
$4,888
State:
$8,399
(% of AGI for various income ranges: 1.4% for AGIs below $25k, 2.1% for AGIs $25k-50k, 3.7% for AGIs $50k-75k, 4.5% for AGIs $75k-100k, 5.8% for AGIs $100k-200k)
Earned income credit: $2,692 (reported on 34.1% of returns)
Here:
$2,692
State:
$2,288
(% of AGI for various income ranges: 11.4% for AGIs below $25k, 1.6% for AGIs $25k-50k)
Percentage of individuals using paid preparers for their 2012 taxes: 46.1%
Here:
46%
State:
55%
(% for various income ranges: 43.6% for AGIs below $25k, 45.9% for AGIs $25k-50k, 51.7% for AGIs $50k-75k, 52.2% for AGIs $75k-100k, 56.7% for AGIs $100k-200k)
Averages for the 2004 tax year for zip code 64134, filed in 2005:
Average Adjusted Gross Income (AGI) in 2004: $32,230 (Individual Income Tax Returns)
Here:
$32,230
State:
$44,591
Salary/wage: $30,454 (reported on 88.9% of returns)
Here:
$30,454
State:
$38,941
(% of AGI for various income ranges: 89.3% for AGIs below $10k, 82.0% for AGIs $10k-25k, 86.8% for AGIs $25k-50k, 85.8% for AGIs $50k-75k, 85.7% for AGIs $75k-100k, 69.6% for AGIs over 100k)
Taxable interest for individuals: $1,015 (reported on 24.9% of returns)
This zip code:
$1,015
Missouri:
$1,801
(% of AGI for various income ranges: 2.2% for AGIs below $10k, 1.0% for AGIs $10k-25k, 0.6% for AGIs $25k-50k, 0.5% for AGIs $50k-75k, 0.3% for AGIs $75k-100k, 1.8% for AGIs over 100k)
Taxable dividends: $1,105 (reported on 11.6% of returns)
Here:
$1,105
State:
$3,677
(% of AGI for various income ranges: 0.9% for AGIs below $10k, 0.5% for AGIs $10k-25k, 0.4% for AGIs $25k-50k, 0.2% for AGIs $50k-75k, 0.2% for AGIs $75k-100k, 0.9% for AGIs over 100k)
Net capital gain/loss: +$2,205 (reported on 7.1% of returns)
Here:
+$2,205
State:
+$8,915
(% of AGI for various income ranges: -0.6% for AGIs below $10k, 0.2% for AGIs $10k-25k, 0.0% for AGIs $25k-50k, 0.5% for AGIs $50k-75k, 0.5% for AGIs $75k-100k, 2.8% for AGIs over 100k)
Profit/loss from business: +$4,170 (reported on 10.5% of returns)
Here:
+$4,170
State:
+$9,793
(% of AGI for various income ranges: 5.3% for AGIs below $10k, 3.5% for AGIs $10k-25k, 0.7% for AGIs $25k-50k, 0.3% for AGIs $50k-75k, 0.4% for AGIs $75k-100k, 2.5% for AGIs over 100k)
Profit/loss from farming: +$1,583 (reported on 0.1% of returns)
Here:
+$1,583
State:
-$5,056
IRA payment deduction: $2,113 (reported on 1.3% of returns)
64134:
$2,113
Missouri:
$2,972
(% of AGI for various income ranges: 0.1% for AGIs $10k-25k, 0.1% for AGIs $25k-50k, 0.1% for AGIs $50k-75k, 0.1% for AGIs over 100k)
Self-employed pension: $1,100 (reported on 0.1% of returns)
Here:
$1,100
Missouri:
$14,365
Total itemized deductions: $13,510 (25% of AGI, reported on 30.7% of returns)
Here:
$13,510
State:
$18,261
Here:
25.3% of AGI
State:
20.5% of AGI
(% of AGI for various income ranges: 8.0% for AGIs below $10k, 7.9% for AGIs $10k-25k, 12.7% for AGIs $25k-50k, 14.6% for AGIs $50k-75k, 16.3% for AGIs $75k-100k, 14.3% for AGIs over 100k)
Charity contributions deductions: $3,115 (6% of AGI, reported on 25.9% of returns)
Here:
$3,115
State:
$3,665
Here:
5.6% of AGI
State:
3.9% of AGI
(% of AGI for various income ranges: 0.9% for AGIs below $10k, 1.2% for AGIs $10k-25k, 2.2% for AGIs $25k-50k, 2.8% for AGIs $50k-75k, 3.5% for AGIs $75k-100k, 4.2% for AGIs over 100k)
Total tax: $3,791 (reported on 66.7% of returns)
64134:
$3,791
State:
$6,999
(% of AGI for various income ranges: 1.9% for AGIs below $10k, 3.1% for AGIs $10k-25k, 6.2% for AGIs $25k-50k, 9.1% for AGIs $50k-75k, 10.5% for AGIs $75k-100k, 16.5% for AGIs over 100k)
Earned income credit: $1,869 (reported on 26.8% of returns)
Here:
$1,869
State:
$1,728
Percentage of individuals using paid preparers for their 2004 taxes: 58.4%
Here:
58%
State:
62%
(% for various income ranges: 50.1% for AGIs below $10k, 62.5% for AGIs $10k-25k, 58.3% for AGIs $25k-50k, 61.5% for AGIs $50k-75k, 59.0% for AGIs $75k-100k, 60.4% for AGIs over 100k)
Likely homosexual households (counted as self-reported same-sex unmarried-partner households)
Lesbian couples: 0.1% of all households
Gay men: 0.0% of all households
Household received Food Stamps/SNAP in the past 12 months: 1,328 Household did not receive Food Stamps/SNAP in the past 12 months: 7,778
Women who had a birth in the past 12 months: 243 (84 now married, 169 unmarried) Women who did not have a birth in the past 12 months: 5,498 (1,729 now married, 3,786 unmarried)
Housing units in zip code 64134 with a mortgage: 2,659 (94 second mortgage, 76 both second mortgage and home equity loan) Houses without a mortgage: 34
Median monthly owner costs for units with a mortgage: $1,152 Median monthly owner costs for units without a mortgage: $487
Residents with income below the poverty level in 2022:
This zip code:
20.6%
Whole state:
13.2%
Residents with income below 50% of the poverty level in 2022:
This zip code:
9.8%
Whole state:
6.8%
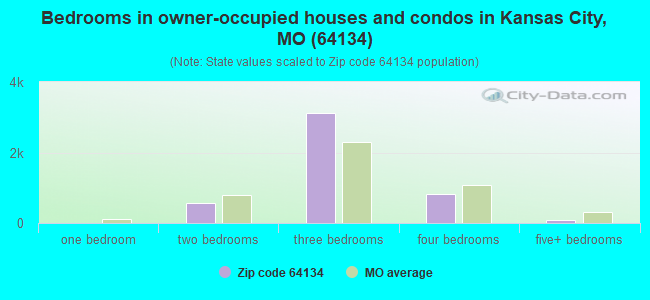
Median number of rooms in houses and condos:
Here:
6.0
State:
6.4
Median number of rooms in apartments:
Here:
5.0
State:
4.4
Notable locations in this zip code not listed on our city pages
Churches in zip code 64134 include: There Is Hope Fellowship Centre (A), Spruce Hill Bible Chapel (B), South Kansas City Baptist Church (C), Saint Peters Full Gospel Baptist Church (D), Saint Matthew Baptist Church of Spruce (E), Saint Matthew Apostle Church (F), Fountain of Life Outreach Center (G), Covenant Reformed Church (H), Concord Fortress of Hope Church (I). Display/hide their locations on the map
1,928 married couples with children.
3,638 single-parent households (770 men, 2,868 women).
92.8% of residents of 64134 zip code speak English at home.
4.4% of residents speak Spanish at home (56% very well, 29% well, 5% not well, 10% not at all).
0.3% of residents speak other Indo-European language at home (69% very well, 31% not well).
0.5% of residents speak Asian or Pacific Island language at home (77% very well, 7% well, 16% not well).
1.9% of residents speak other language at home (65% very well, 7% well, 28% not well).
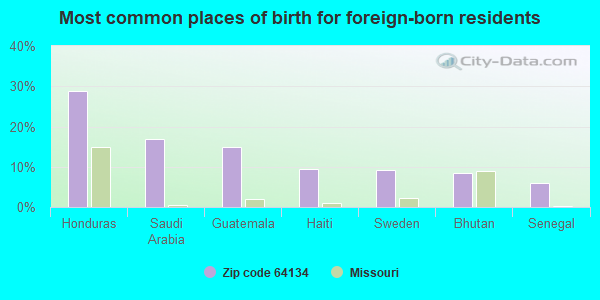
Foreign born population: 901 (3.9%) (38.3% of them are naturalized citizens)
Major facilities with environmental interests located in this zip code:
OFFSHORE MARINE (11415 HICKMAN MILLS DR in KANSAS CITY, MO)
(Integrated Compliance Information System) - ICIS-07-1994-0014, FORMAL ENFORCEMENT ACTION STATE MASTER (Missouri monitoring and compilance) - ICIS-3376, ENFORCEMENT/COMPLIANCE ACTIVITY, RCRAINFO-MOD985811694, CESQG (Resource Conservation and Recovery Act (tracking hazardous waste)) Organizations: NICK SEARING (CONTACT/OWNER)
FREEDOM MUFFLER (1102 HICKMAN MILLS DR in KANSAS CITY, MO)
AIR MINOR (AIRS/AFS) (Integrated Compliance Information System) - ICIS-07-2000-0061, FORMAL ENFORCEMENT ACTION STATE MASTER (Missouri monitoring and compilance) - ICIS-2822, ENFORCEMENT/COMPLIANCE ACTIVITY, AIRS/AFS-MO0977493, AIR MINOR Business SIC classification: AUTOMOTIVE EXHAUST SYSTEM REPAIR SHOPS
RUSKIN HEIGHTS BAPTIST CHURCH (113TH AND BRISTOL in KANSAS CITY, MO)
(Integrated Compliance Information System) - ICIS-07-2000-0025, FORMAL ENFORCEMENT ACTION STATE MASTER (Missouri monitoring and compilance) - ICIS-3316, ENFORCEMENT/COMPLIANCE ACTIVITY, NCDB-D07#TSCA-7-2000-008, COMPLIANCE ACTIVITY COMPLIANCE ACTIVITY (Tracking inspections of insecticide, fungicide, and rodenticide, and toxic substances) Alternative names: RUSKIN HEIGHTS BAPTIST (GRANDVIEW CHRST)
ALBRIGHT ROBERTS CHEVROLET GEO INCORPORATED (11701 HICKMAN MILLS DRIVE in KANSAS CITY, MO)
AIR MINOR (AIRS/AFS) STATE MASTER (Missouri monitoring and compilance) - AIRS/AFS-MO0975106, AIR MINOR, RCRAINFO-MOD029833431, SQG (Resource Conservation and Recovery Act (tracking hazardous waste)) Business SIC classification: MOTOR VEHICLE DEALERS (NEW AND USED) Organizations: FRED ALBRIGHT (CONTACT/OWNER)
Alternative names: ALBRIGHT ROBERTS CHEV INC, HICKS BROS CHEV INC
PEOPLES CHOICE DRY CLEANING (6825 LONGVIEW RD in KANSAS CITY, MO)
AIR MINOR (AIRS/AFS) STATE MASTER (Missouri monitoring and compilance) - RCRAINFO-MOR000001610, SQG (Resource Conservation and Recovery Act (tracking hazardous waste)) Business SIC classification: DRYCLEANING PLANTS, EXCEPT RUG CLEANING Organizations: LARRY JAMES (CONTACT/OWNER)
Alternative names: PEOPLE'S CHOICE CLEANERS
GREAT SCOTT TRANSMISSION (8305 E BANNISTER RD in KANSAS CITY, MO)
STATE MASTER (Missouri monitoring and compilance) - RCRAINFO-MOD156698540, NOT IN A UNIVERSE (Resource Conservation and Recovery Act (tracking hazardous waste)) Organizations: SCOTT THIBAULT (CONTACT/OPERATOR)
AMOCO OIL SS #8726 (8201 E 95TH ST in KANSAS CITY, MO)
STATE MASTER (Missouri monitoring and compilance) - RCRAINFO-MOD985809029, NOT IN A UNIVERSE (Resource Conservation and Recovery Act (tracking hazardous waste)) Organizations: PAUL E MONTEER (CONTACT/OWNER)
AMOCO OIL SS #9589 (11100 BLUE RIDGE BLVD in KANSAS CITY, MO)
STATE MASTER (Missouri monitoring and compilance) - RCRAINFO-MOD985808880, SQG (Resource Conservation and Recovery Act (tracking hazardous waste)) Organizations: AMOCO OIL CO (CONTACT/OWNER)
PETERS AUTOMOTIVE (6750 E BANNISTER in KANSAS CITY, MO)
STATE MASTER (Missouri monitoring and compilance) - RCRAINFO-MOD985813161, SQG (Resource Conservation and Recovery Act (tracking hazardous waste)) Organizations: BOB PETERS (CONTACT/OWNER)
HEWLETT PACKARD CO (6601 WINCHESTER AVE in KANSAS CITY, MO)
STATE MASTER (Missouri monitoring and compilance) - RCRAINFO-MOD985820182, NOT IN A UNIVERSE (Resource Conservation and Recovery Act (tracking hazardous waste)) Organizations: WINBURY GROUP (CONTACT/OWNER)
J W W INC (11515 HICKMAN MILLS DR in KANSAS CITY, MO)
STATE MASTER (Missouri monitoring and compilance) - RCRAINFO-MO0000933416, NOT IN A UNIVERSE (Resource Conservation and Recovery Act (tracking hazardous waste)) Organizations: JWW INC (CONTACT/OWNER)
Housing units lacking complete plumbing facilities: 1.3% Housing units lacking complete kitchen facilities: 1.4%
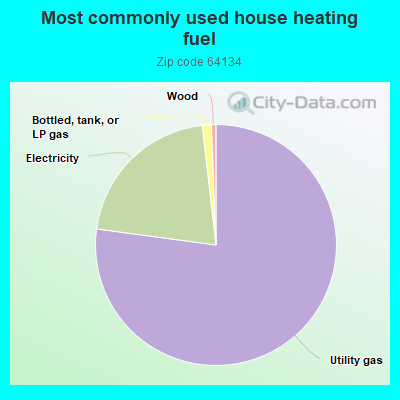
76.9%Utility gas
21.0%Electricity
1.2%Bottled, tank, or LP gas
0.6%Wood
Population in 1990: 23,346. Population change in the 1990s: +125 (+0.5%).
Place of birth for U.S.-born residents:
This state: 14,382
Northeast: 353
Midwest: 3,906
South: 2,648
West: 824
54% of the 64134 zip code residents lived in the same house 5 years ago. Out of people who lived in different houses, 67% lived in this county. Out of people who lived in different counties, 50% lived in Missouri.
90% of the 64134 zip code residents lived in the same house 1 year ago. Out of people who lived in different houses, 60% moved from this county. Out of people who lived in different houses, 20% moved from different county within same state. Out of people who lived in different houses, 16% moved from different state. Out of people who lived in different houses, 2% moved from abroad.
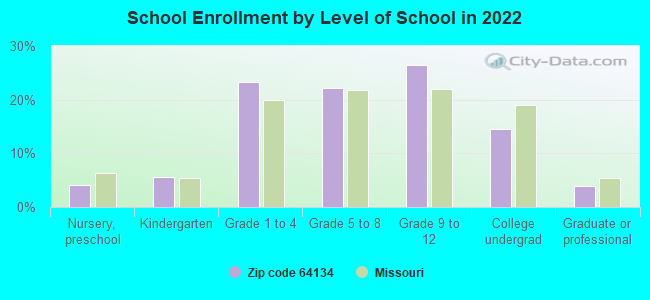
Private vs. public school enrollment:
Students in private schools in grades 1 to 8 (elementary and middle school): 196
Here:
8.2%
Missouri:
15.4%
Students in private schools in grades 9 to 12 (high school): 256
Here:
18.1%
Missouri:
13.9%
Students in private undergraduate colleges: 119
Here:
15.4%
Missouri:
22.6%
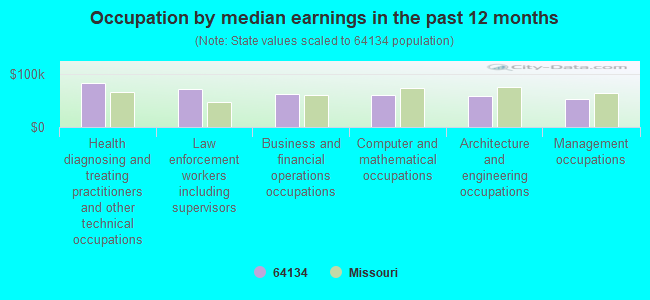
Occupation by median earnings in the past 12 months ($)
82,576Health diagnosing and treating practitioners and other technical occupations
71,038Law enforcement workers including supervisors
61,704Business and financial operations occupations
59,972Computer and mathematical occupations
58,450Architecture and engineering occupations
52,379Management occupations
Companies with federal contracts located in this zip code:
Abijah Zabihullah (8724 E. Bannister Terr in Kansas City, mo; small business) : $27,660 in 7 contractsfrom 2004 to 2005
Contracts for Educational Services, Other Professional Services by Bureau of Prisoners/Federal Prison System Signed by year:2000: $0; 2001: $0; 2002: $0; 2003: $0; 2004: $4,900; 2005: $22,760; 2006: $0.
Biggest contracts:
$24,960 with Bureau of Prisoners/Federal Prison System for Educational Services. Taking place in KS. Signed on 2005-09-22. Completion date: 2006-09-30.
$2,500 with Bureau of Prisoners/Federal Prison System for Other Professional Services. Taking place in KS. Signed on 2004-11-09. Completion date: 2005-09-30.
$2,400 with Bureau of Prisoners/Federal Prison System for Educational Services. Taking place in KS. Signed on 2004-10-01. Completion date: 2005-09-30.
$2,000, same as above.Signed on 2005-09-14. Completion date: 2005-09-21.
PARAGON LAWNS INC (10711 HICKMAN MILLS DR in KANSAS CITY, MO; small business)
$11,608 with Navy for Landscaping/Groundskeeping Services. Signed on 2005-05-02. Completion date: 2005-07-01.
TRUCK TRAILER & HITCH CENTER O (11600 HICKMAN MILLS DR in KANSAS CITY, MO; small business)
$4,835 with Army for Trailers. Taking place in KS. Signed on 2004-09-20. Completion date: 2004-09-15.
mid-america muslim cemetery inc. (8501 East 99th Street in Kansas City, MO; small business) : $2,300 in 3 contractsin 2005
$2,300 with Bureau of Prisoners/Federal Prison System for Care of Remains and/or Funeral Services. Signed on 2005-10-14. Completion date: 2006-09-30.
$2,300, same as above.Signed on 2005-07-08. Completion date: 2005-09-30.
-$2,300, same as above.Signed on 2005-10-13. Completion date: 2005-10-13.
Top industries in this zip code by the number of employees in 2005:
Health Care and Social Assistance: Psychiatric and Substance Abuse Hospitals (250-499 employees: 1 establishment)
Management of Companies and Enterprises: Corporate, Subsidiary, and Regional Managing Offices (100-249: 1, 5-9: 1, 1-4: 1)
Other Services (except Public Administration): Religious Organizations (20-49: 1, 10-19: 4, 5-9: 4, 1-4: 4)
2004 - 2018 National Fire Incident Reporting System (NFIRS) incidents
Based on the data from the years 2004 - 2018 the average number of fires per year is 82. The highest number of reported fires - 130 took place in 2009, and the least - 39 in 2006. The data has a growing trend.
When looking into fire subcategories, the most incidents belonged to: Structure Fires (54.2%), and Mobile Property/Vehicle Fires (23.0%).
Fire incident types reported to NFIRS in Zip Code 64134


+$1,583
-$5,056
 Nearest zip codes: 64138, 64192, 64137, 64030, 64149, 64132.


 Based on the data from the years 2004 - 2018 the average number of fires per year is 82. The highest number of reported fires - 130 took place in 2009, and the least - 39 in 2006. The data has a growing trend.
 When looking into fire subcategories, the most incidents belonged to: Structure Fires (54.2%), and Mobile Property/Vehicle Fires (23.0%).