Estimated zip code population in 2022: 380 Zip code population in 2010: 310 Zip code population in 2000: 159
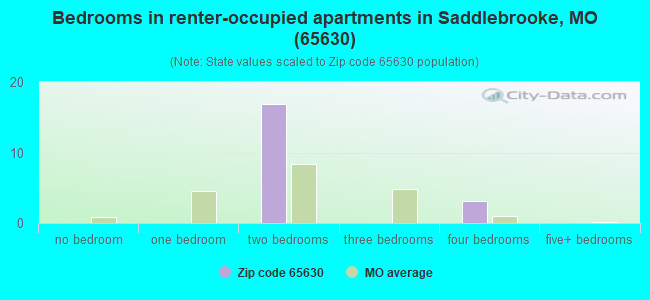
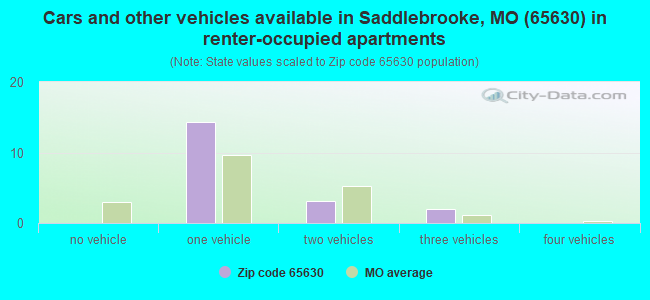
Houses and condos: 171 Renter-occupied apartments: 19
% of renters here:
11%
State:
32%
March 2022 cost of living index in zip code 65630: 76.9 (low, U.S. average is 100)
Land area: 9.8 sq. mi. Water area: 0.0 sq. mi.
Population density: 39 people per square mile
(very low).
OSM Map
General Map
Google Map
MSN Map
OSM Map
General Map
Google Map
MSN Map
OSM Map
General Map
Google Map
MSN Map
OSM Map
General Map
Google Map
MSN Map
Please wait while loading the map...
Real estate property taxes paid for housing units in 2022:
This zip code:
0.7% ($3,698)
Missouri:
0.8% ($1,810)
Median real estate property taxes paid for housing units with mortgages in 2022: $3,804 (0.7%) Median real estate property taxes paid for housing units with no mortgage in 2022: $3,561 (0.6%)
Business Search- 14 Million verified businesses
Males: 179
(47.2%)
Females: 201
(52.8%)
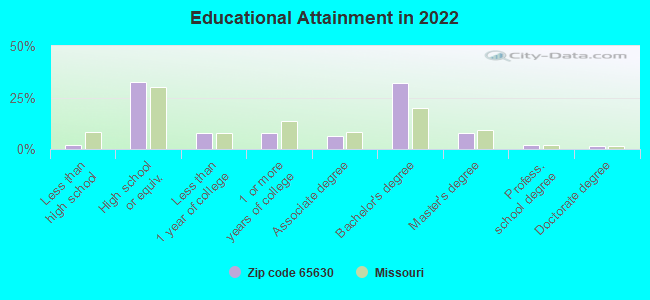
For population 25 years and over in 65630:
High school or higher: 98.8%
Bachelor's degree or higher: 43.8%
Graduate or professional degree: 11.9%
Unemployed: 1.4%
Mean travel time to work (commute): 29.3 minutes
For population 15 years and over in 65630:
Never married: 13.7%
Now married: 83.1%
Separated: 0.3%
Widowed: 1.2%
Divorced: 1.8%
Zip code 65630 compared to state average:
Median household income above state average.
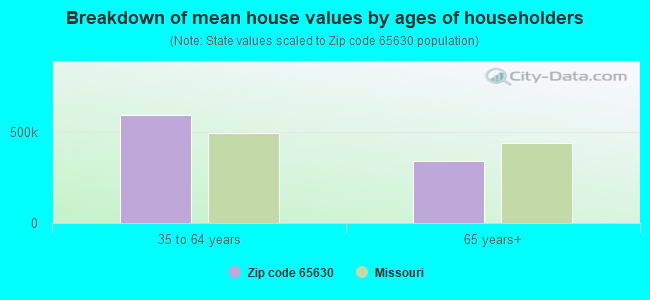
Median house value significantly above state average.
Unemployed percentage below state average.
Black race population percentage significantly below state average.
Median age significantly above state average.
Renting percentage significantly below state average.
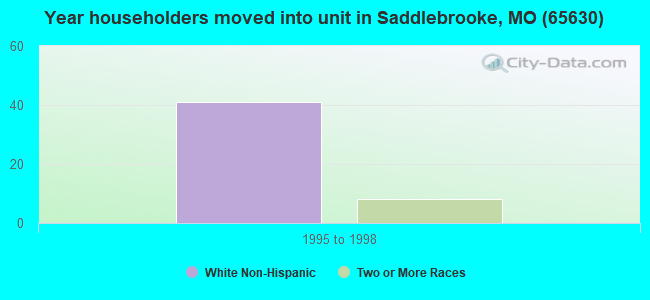
Length of stay since moving in significantly above state average.
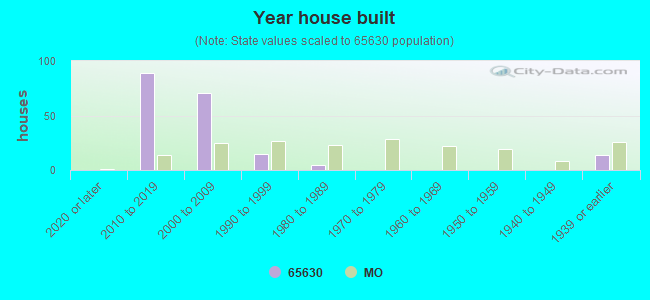
House age significantly below state average.
Number of college students below state average.
Percentage of population with a bachelor's degree or higher above state average.
Averages for the 2020 tax year for zip code 65630, filed in 2021:
Average Adjusted Gross Income (AGI) in 2020: $107,452 (Individual Income Tax Returns)
Here:
$107,452
State:
$68,151
Salary/wage: $72,542 (reported on 70.4% of returns)
Here:
$72,542
State:
$56,131
(% of AGI for various income ranges: 1508.0% for AGIs below $25k, 5813.3% for AGIs $25k-50k, 11246.7% for AGIs $100k-200k)
Taxable interest for individuals: $1,621 (reported on 51.9% of returns)
This zip code:
$1,621
Missouri:
$1,586
(% of AGI for various income ranges: 8.0% for AGIs below $25k, 72.5% for AGIs $50k-75k, 536.7% for AGIs $100k-200k)
Ordinary dividends: $4,688 (reported on 29.6% of returns)
Here:
$4,688
State:
$10,947
(% of AGI for various income ranges: 72.0% for AGIs below $25k, 220.0% for AGIs $50k-75k, 406.7% for AGIs $100k-200k)
Net capital gain/loss in AGI: +$19,700 (reported on 29.6% of returns)
Here:
+$19,700
State:
+$18,453
(% of AGI for various income ranges: 190.0% for AGIs $50k-75k, 2163.3% for AGIs $100k-200k)
Profit/loss from business: +$9,850 (reported on 14.8% of returns)
Here:
+$9,850
State:
+$12,260
(% of AGI for various income ranges: 430.0% for AGIs below $25k, 596.7% for AGIs $100k-200k)
Taxable individual retirement arrangement distribution: $21,750 (reported on 14.8% of returns)
65630:
$21,750
Missouri:
$19,719
(% of AGI for various income ranges: )
Total itemized deductions: $32,650 (reported on 14.8% of returns)
Here:
$32,650
State:
$36,651
(% of AGI for various income ranges: )
Charity contributions: $13,875 (reported on 14.8% of returns)
Here:
$13,875
State:
$15,671
(% of AGI for various income ranges: )
Taxes paid: $8,350 (reported on 14.8% of returns)
65630:
$8,350
State:
$7,608
(% of AGI for various income ranges: )
Percentage of individuals using paid preparers for their 2020 taxes: 96.3%
Here:
96%
State:
93%
(% for various income ranges: 100.0% for AGIs below $25k, 100.0% for AGIs $25k-50k, 100.0% for AGIs $50k-75k, 100.0% for AGIs $75k-100k, 100.0% for AGIs $100k-200k, 75.0% for AGIs over 200k)
Averages for the 2012 tax year for zip code 65630, filed in 2013:
Average Adjusted Gross Income (AGI) in 2012: $83,774 (Individual Income Tax Returns)
Here:
$83,774
State:
$55,896
Salary/wage: $67,727 (reported on 78.9% of returns)
Here:
$67,727
State:
$46,205
(% of AGI for various income ranges: 60.0% for AGIs below $25k, 60.0% for AGIs $25k-50k, 125.1% for AGIs $50k-75k, 200.0% for AGIs $100k-200k)
Taxable interest for individuals: $900 (reported on 52.6% of returns)
This zip code:
$900
Missouri:
$1,559
(% of AGI for various income ranges: 1.7% for AGIs below $25k, 0.3% for AGIs $50k-75k, 2.2% for AGIs $100k-200k)
Ordinary dividends: $3,000 (reported on 26.3% of returns)
Here:
$3,000
State:
$7,410
Net capital gain/loss in AGI: +$4,100 (reported on 15.8% of returns)
Here:
+$4,100
State:
+$11,579
Profit/loss from business: +$5,240 (reported on 26.3% of returns)
Here:
+$5,240
State:
+$11,688
Taxable individual retirement arrangement distribution: $19,850 (reported on 10.5% of returns)
65630:
$19,850
Missouri:
$14,773
Total itemized deductions: $29,722 (21% of AGI, reported on 47.4% of returns)
Here:
$29,722
State:
$22,730
Here:
20.9% of AGI
State:
19.2% of AGI
(% of AGI for various income ranges: 50.7% for AGIs $50k-75k, 16.5% for AGIs $100k-200k, 17.1% for AGIs over 200k)
Charity contributions: $7,886 (reported on 36.8% of returns)
Here:
$7,886
State:
$4,745
(% of AGI for various income ranges: 4.9% for AGIs $50k-75k, 2.5% for AGIs $100k-200k, 5.5% for AGIs over 200k)
Taxes paid: $11,488 (reported on 42.1% of returns)
65630:
$11,488
State:
$8,399
(% of AGI for various income ranges: 14.8% for AGIs $50k-75k, 7.0% for AGIs $100k-200k, 6.0% for AGIs over 200k)
Earned income credit: $1,700 (reported on 15.8% of returns)
Here:
$1,700
State:
$2,288
(% of AGI for various income ranges: 7.3% for AGIs below $25k)
Percentage of individuals using paid preparers for their 2012 taxes: 73.7%
Here:
74%
State:
55%
(% for various income ranges: 50.0% for AGIs below $25k, 75.0% for AGIs $25k-50k, 133.3% for AGIs $50k-75k, 200.0% for AGIs $100k-200k)
Averages for the 2004 tax year for zip code 65630, filed in 2005:
Average Adjusted Gross Income (AGI) in 2004: $41,495 (Individual Income Tax Returns)
Here:
$41,495
State:
$44,591
Salary/wage: $32,138 (reported on 84.7% of returns)
Here:
$32,138
State:
$38,941
(% of AGI for various income ranges: 87.2% for AGIs below $10k, 78.4% for AGIs $10k-25k, 84.6% for AGIs $25k-50k, 81.1% for AGIs $50k-75k, 40.7% for AGIs $75k-100k)
Taxable interest for individuals: $385 (reported on 35.1% of returns)
This zip code:
$385
Missouri:
$1,801
(% of AGI for various income ranges: 1.2% for AGIs $10k-25k, 0.1% for AGIs $50k-75k, 0.4% for AGIs $75k-100k)
Profit/loss from business: +$684 (reported on 17.1% of returns)
Here:
+$684
State:
+$9,793
Total itemized deductions: $18,296 (20% of AGI, reported on 24.3% of returns)
Here:
$18,296
State:
$18,261
Here:
19.6% of AGI
State:
20.5% of AGI
Charity contributions deductions: $3,038 (3% of AGI, reported on 23.4% of returns)
Here:
$3,038
State:
$3,665
Here:
3.3% of AGI
State:
3.9% of AGI
Total tax: $4,753 (reported on 73.0% of returns)
65630:
$4,753
State:
$6,999
(% of AGI for various income ranges: 3.5% for AGIs $10k-25k, 4.0% for AGIs $25k-50k, 8.2% for AGIs $50k-75k, 12.1% for AGIs $75k-100k)
Earned income credit: $1,429 (reported on 12.6% of returns)
Here:
$1,429
State:
$1,728
Percentage of individuals using paid preparers for their 2004 taxes: 62.2%
Here:
62%
State:
62%
(% for various income ranges: 62.5% for AGIs below $10k, 65.5% for AGIs $10k-25k, 45.5% for AGIs $25k-50k, 62.5% for AGIs $50k-75k, 83.3% for AGIs $75k-100k)
Household received Food Stamps/SNAP in the past 12 months: 0 Household did not receive Food Stamps/SNAP in the past 12 months: 172
Women who had a birth in the past 12 months: 2 (2 now married, 0 unmarried) Women who did not have a birth in the past 12 months: 36 (19 now married, 16 unmarried)
Housing units in zip code 65630 with a mortgage: 88 (22 second mortgage, 12 both second mortgage and home equity loan) Median monthly owner costs for units with a mortgage: $2,202 Median monthly owner costs for units without a mortgage: $745
Residents with income below the poverty level in 2022:
This zip code:
2.3%
Whole state:
13.2%
Median number of rooms in houses and condos:
Here:
6.9
State:
6.4
Median number of rooms in apartments:
Here:
4.2
State:
4.4
Notable locations in this zip code not listed on our city pages
Size of family households: 115 2-persons, 9 3-persons, 12 4-persons, 8 5-persons, 1 6-persons, 2 7-or-more-persons
Size of nonfamily households: 17 1-person, 6 2-persons
46 married couples with children.
8 single-parent households (8 men).
92.2% of residents of 65630 zip code speak English at home.
3.2% of residents speak Spanish at home (8% very well, 67% well, 25% not well).
3.2% of residents speak other Indo-European language at home (100% very well).
1.1% of residents speak Asian or Pacific Island language at home (75% very well, 25% well).
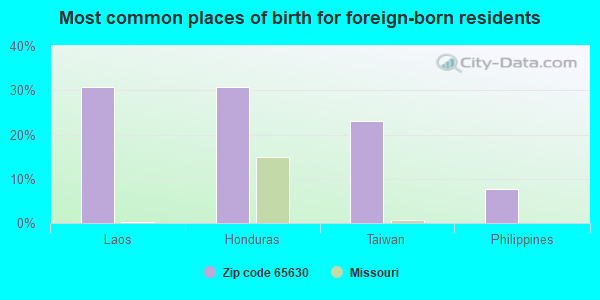
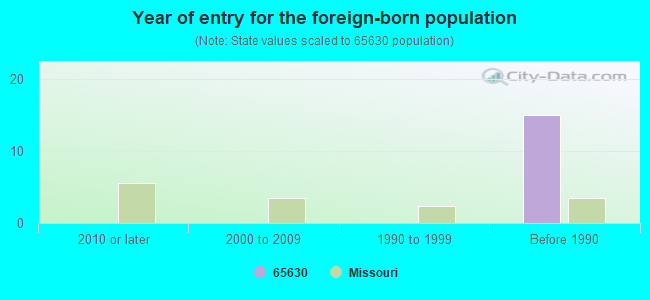
Foreign born population: 13 (3.6%) (92.9% of them are naturalized citizens)
This zip code:
3.6%
Whole state:
4.1%
31%Laos
31%Honduras
23%Taiwan
8%Philippines
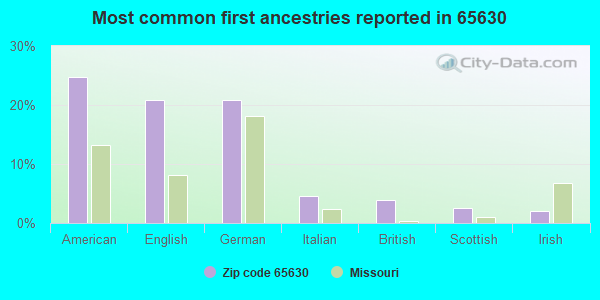
25%American
21%English
21%German
5%Italian
4%British
3%Scottish
2%Irish
Year of entry for the foreign-born population
02010 or later
02000 to 2009
01990 to 1999
15Before 1990
Housing units lacking complete kitchen facilities: 7.0%
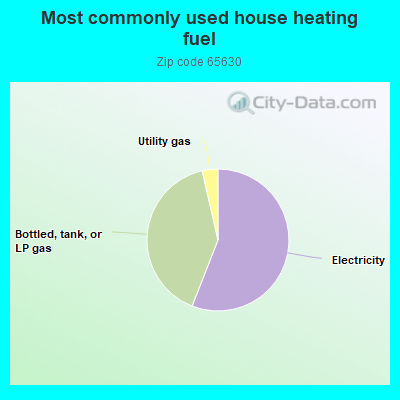
56.4%Electricity
40.8%Bottled, tank, or LP gas
3.6%Utility gas
Population in 1990: 188.
Place of birth for U.S.-born residents:
This state: 136
Northeast: 10
Midwest: 118
South: 44
West: 55
0% of the 65630 zip code residents lived in the same house 5 years ago. Out of people who lived in different houses, 55% lived in this county. Out of people who lived in different counties, 50% lived in Missouri.
92% of the 65630 zip code residents lived in the same house 1 year ago. Out of people who lived in different houses, 12% moved from this county. Out of people who lived in different houses, 17% moved from different county within same state. Out of people who lived in different houses, 75% moved from different state.
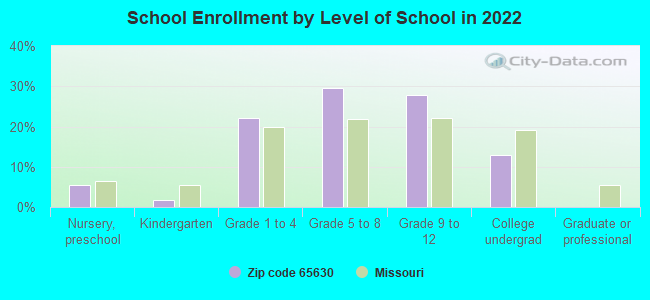
Private vs. public school enrollment:
Students in private schools in grades 1 to 8 (elementary and middle school): 5
Here:
17.4%
Missouri:
15.4%
Students in private schools in grades 9 to 12 (high school): 4
Here:
28.8%
Missouri:
13.9%
Students in private undergraduate colleges: 3
Here:
48.1%
Missouri:
22.6%
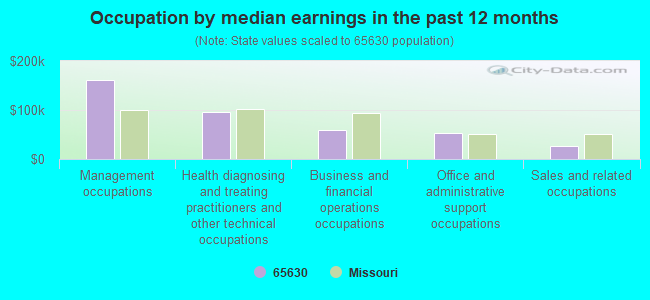
Occupation by median earnings in the past 12 months ($)
162,173Management occupations
95,825Health diagnosing and treating practitioners and other technical occupations
58,526Business and financial operations occupations
52,632Office and administrative support occupations
26,892Sales and related occupations
Top industries in this zip code by the number of employees in 2005:
Administrative and Support and Waste Management and Remediation Services: Tour Operators (10-19 employees: 1 establishment)
Construction: Land Subdivision (1-4: 2)
Other Services (except Public Administration): General Automotive Repair (1-4: 1)
Construction: New Single-Family Housing Construction (except Operative Builders) (1-4: 1)
Arts, Entertainment, and Recreation: Independent Artists, Writers, and Performers (1-4: 1)
Fatal accident statistics in 2013:
Fatal accident count: 1
Vehicles involved in fatal accidents: 1
Fatal accidents caused by drunken drivers: 0
Fatalities: 1
Persons involved in fatal accidents: 3
Pedestrians involved in fatal accidents: 0
Home Mortgage Disclosure Act Aggregated Statistics For Year 2009 (Based on 2 partial tracts)
A) FHA, FSA/RHS & VA Home Purchase Loans
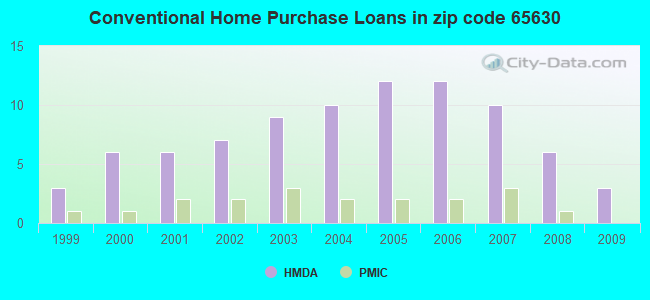
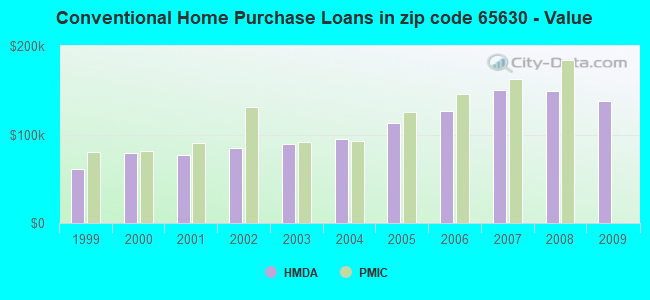
B) Conventional Home Purchase Loans
C) Refinancings
D) Home Improvement Loans
F) Non-occupant Loans on < 5 Family Dwellings (A B C & D)
G) Loans On Manufactured Home Dwelling (A B C & D)
Number
Average Value
Number
Average Value
Number
Average Value
Number
Average Value
Number
Average Value
Number
Average Value
LOANS ORIGINATED
2
$147,215
3
$138,110
18
$152,308
1
$63,440
2
$110,260
1
$28,200
APPLICATIONS APPROVED, NOT ACCEPTED
0
$0
0
$0
1
$236,550
0
$0
0
$0
0
$0
APPLICATIONS DENIED
1
$58,690
0
$0
5
$151,798
0
$0
0
$0
0
$0
APPLICATIONS WITHDRAWN
0
$0
0
$0
4
$161,218
0
$0
0
$0
0
$0
FILES CLOSED FOR INCOMPLETENESS
0
$0
0
$0
0
$0
0
$0
0
$0
0
$0
Aggregated Statistics For Year 2008 (Based on 2 partial tracts)
A) FHA, FSA/RHS & VA Home Purchase Loans
B) Conventional Home Purchase Loans
C) Refinancings
D) Home Improvement Loans
F) Non-occupant Loans on < 5 Family Dwellings (A B C & D)
G) Loans On Manufactured Home Dwelling (A B C & D)
Number
Average Value
Number
Average Value
Number
Average Value
Number
Average Value
Number
Average Value
Number
Average Value
LOANS ORIGINATED
2
$120,165
6
$148,968
12
$147,646
1
$79,690
2
$104,325
1
$57,880
APPLICATIONS APPROVED, NOT ACCEPTED
0
$0
0
$0
1
$110,710
0
$0
0
$0
0
$0
APPLICATIONS DENIED
0
$0
1
$133,710
7
$170,459
1
$69,080
1
$38,360
1
$73,610
APPLICATIONS WITHDRAWN
0
$0
1
$101,650
2
$138,050
0
$0
0
$0
0
$0
FILES CLOSED FOR INCOMPLETENESS
0
$0
0
$0
0
$0
0
$0
0
$0
0
$0
Aggregated Statistics For Year 2007 (Based on 2 partial tracts)
A) FHA, FSA/RHS & VA Home Purchase Loans
B) Conventional Home Purchase Loans
C) Refinancings
D) Home Improvement Loans
F) Non-occupant Loans on < 5 Family Dwellings (A B C & D)
G) Loans On Manufactured Home Dwelling (A B C & D)
Number
Average Value
Number
Average Value
Number
Average Value
Number
Average Value
Number
Average Value
Number
Average Value
LOANS ORIGINATED
1
$166,500
10
$150,337
12
$148,981
1
$37,170
2
$152,890
1
$82,880
APPLICATIONS APPROVED, NOT ACCEPTED
0
$0
1
$92,900
2
$117,345
0
$0
0
$0
1
$24,560
APPLICATIONS DENIED
0
$0
3
$206,697
9
$162,037
1
$69,970
1
$100,990
1
$46,750
APPLICATIONS WITHDRAWN
0
$0
0
$0
2
$178,935
0
$0
0
$0
0
$0
FILES CLOSED FOR INCOMPLETENESS
0
$0
0
$0
1
$163,460
0
$0
0
$0
0
$0
Aggregated Statistics For Year 2006 (Based on 2 partial tracts)
A) FHA, FSA/RHS & VA Home Purchase Loans
B) Conventional Home Purchase Loans
C) Refinancings
D) Home Improvement Loans
F) Non-occupant Loans on < 5 Family Dwellings (A B C & D)
G) Loans On Manufactured Home Dwelling (A B C & D)
Number
Average Value
Number
Average Value
Number
Average Value
Number
Average Value
Number
Average Value
Number
Average Value
LOANS ORIGINATED
1
$94,160
12
$127,080
14
$130,200
2
$45,150
2
$161,535
1
$52,680
APPLICATIONS APPROVED, NOT ACCEPTED
0
$0
2
$103,325
3
$107,887
1
$15,360
0
$0
0
$0
APPLICATIONS DENIED
0
$0
3
$140,113
9
$139,793
1
$53,500
0
$0
1
$72,340
APPLICATIONS WITHDRAWN
0
$0
2
$114,195
5
$119,596
0
$0
0
$0
0
$0
FILES CLOSED FOR INCOMPLETENESS
0
$0
0
$0
1
$157,380
0
$0
0
$0
0
$0
Aggregated Statistics For Year 2005 (Based on 2 partial tracts)
A) FHA, FSA/RHS & VA Home Purchase Loans
B) Conventional Home Purchase Loans
C) Refinancings
D) Home Improvement Loans
F) Non-occupant Loans on < 5 Family Dwellings (A B C & D)
G) Loans On Manufactured Home Dwelling (A B C & D)
Number
Average Value
Number
Average Value
Number
Average Value
Number
Average Value
Number
Average Value
Number
Average Value
LOANS ORIGINATED
1
$135,710
12
$112,672
12
$134,648
1
$47,120
1
$162,650
1
$70,490
APPLICATIONS APPROVED, NOT ACCEPTED
0
$0
2
$79,950
2
$82,400
0
$0
0
$0
0
$0
APPLICATIONS DENIED
1
$54,760
4
$83,178
9
$116,939
1
$34,870
1
$79,620
2
$49,490
APPLICATIONS WITHDRAWN
0
$0
1
$185,950
5
$134,080
0
$0
0
$0
0
$0
FILES CLOSED FOR INCOMPLETENESS
0
$0
0
$0
1
$86,440
0
$0
0
$0
0
$0
Aggregated Statistics For Year 2004 (Based on 2 partial tracts)
A) FHA, FSA/RHS & VA Home Purchase Loans
B) Conventional Home Purchase Loans
C) Refinancings
D) Home Improvement Loans
F) Non-occupant Loans on < 5 Family Dwellings (A B C & D)
G) Loans On Manufactured Home Dwelling (A B C & D)
Number
Average Value
Number
Average Value
Number
Average Value
Number
Average Value
Number
Average Value
Number
Average Value
LOANS ORIGINATED
2
$98,610
10
$95,369
14
$117,464
1
$29,380
1
$130,070
2
$49,530
APPLICATIONS APPROVED, NOT ACCEPTED
0
$0
1
$68,410
2
$88,780
0
$0
0
$0
1
$29,460
APPLICATIONS DENIED
0
$0
4
$80,692
9
$109,313
1
$54,310
0
$0
2
$63,105
APPLICATIONS WITHDRAWN
0
$0
1
$167,170
4
$112,820
0
$0
0
$0
0
$0
FILES CLOSED FOR INCOMPLETENESS
0
$0
0
$0
1
$110,850
0
$0
0
$0
0
$0
Aggregated Statistics For Year 2003 (Based on 2 partial tracts)
A) FHA, FSA/RHS & VA Home Purchase Loans
B) Conventional Home Purchase Loans
C) Refinancings
D) Home Improvement Loans
F) Non-occupant Loans on < 5 Family Dwellings (A B C & D)
Number
Average Value
Number
Average Value
Number
Average Value
Number
Average Value
Number
Average Value
LOANS ORIGINATED
1
$127,180
9
$89,773
25
$100,250
1
$25,150
1
$101,280
APPLICATIONS APPROVED, NOT ACCEPTED
0
$0
1
$60,320
3
$70,367
0
$0
0
$0
APPLICATIONS DENIED
0
$0
3
$66,880
10
$100,311
1
$36,510
0
$0
APPLICATIONS WITHDRAWN
0
$0
1
$122,500
4
$88,965
0
$0
0
$0
FILES CLOSED FOR INCOMPLETENESS
0
$0
0
$0
1
$132,150
0
$0
0
$0
Aggregated Statistics For Year 2002 (Based on 2 partial tracts)
A) FHA, FSA/RHS & VA Home Purchase Loans
B) Conventional Home Purchase Loans
C) Refinancings
D) Home Improvement Loans
F) Non-occupant Loans on < 5 Family Dwellings (A B C & D)
Number
Average Value
Number
Average Value
Number
Average Value
Number
Average Value
Number
Average Value
LOANS ORIGINATED
1
$134,010
7
$84,864
19
$100,170
1
$26,040
1
$86,810
APPLICATIONS APPROVED, NOT ACCEPTED
0
$0
1
$88,220
2
$72,195
0
$0
0
$0
APPLICATIONS DENIED
0
$0
3
$65,470
7
$82,076
1
$9,280
0
$0
APPLICATIONS WITHDRAWN
0
$0
1
$62,920
4
$125,712
0
$0
0
$0
FILES CLOSED FOR INCOMPLETENESS
0
$0
0
$0
1
$63,290
0
$0
0
$0
Aggregated Statistics For Year 2001 (Based on 2 partial tracts)
A) FHA, FSA/RHS & VA Home Purchase Loans
B) Conventional Home Purchase Loans
C) Refinancings
D) Home Improvement Loans
F) Non-occupant Loans on < 5 Family Dwellings (A B C & D)
Number
Average Value
Number
Average Value
Number
Average Value
Number
Average Value
Number
Average Value
LOANS ORIGINATED
2
$90,970
6
$76,340
16
$87,231
2
$24,560
1
$88,300
APPLICATIONS APPROVED, NOT ACCEPTED
0
$0
1
$85,480
2
$73,940
0
$0
0
$0
APPLICATIONS DENIED
0
$0
4
$69,302
6
$82,028
1
$10,460
0
$0
APPLICATIONS WITHDRAWN
0
$0
0
$0
3
$109,050
0
$0
0
$0
FILES CLOSED FOR INCOMPLETENESS
0
$0
0
$0
1
$82,070
0
$0
0
$0
Aggregated Statistics For Year 2000 (Based on 2 partial tracts)
A) FHA, FSA/RHS & VA Home Purchase Loans
B) Conventional Home Purchase Loans
C) Refinancings
D) Home Improvement Loans
F) Non-occupant Loans on < 5 Family Dwellings (A B C & D)
Number
Average Value
Number
Average Value
Number
Average Value
Number
Average Value
Number
Average Value
LOANS ORIGINATED
1
$92,380
6
$78,862
6
$75,597
1
$26,860
1
$56,170
APPLICATIONS APPROVED, NOT ACCEPTED
0
$0
2
$42,405
1
$116,870
0
$0
0
$0
APPLICATIONS DENIED
0
$0
5
$53,142
4
$87,370
1
$42,290
0
$0
APPLICATIONS WITHDRAWN
0
$0
1
$28,120
2
$79,990
0
$0
0
$0
FILES CLOSED FOR INCOMPLETENESS
0
$0
0
$0
0
$0
0
$0
0
$0
Aggregated Statistics For Year 1999 (Based on 1 partial tract)
A) FHA, FSA/RHS & VA Home Purchase Loans
B) Conventional Home Purchase Loans
C) Refinancings
D) Home Improvement Loans
F) Non-occupant Loans on < 5 Family Dwellings (A B C & D)

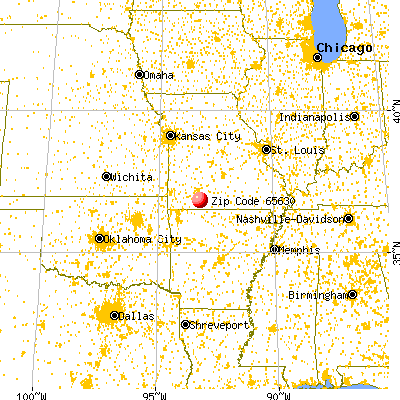


 Nearest zip codes: 65771, 65754, 65653, 65669, 65740, 65728.