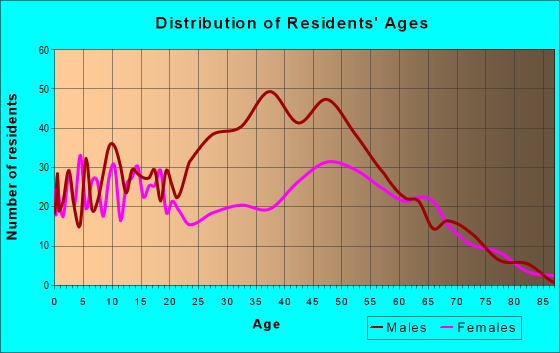
Estimated zip code population in 2022: 4,408 Zip code population in 2010: 4,157 Zip code population in 2000: 3,690
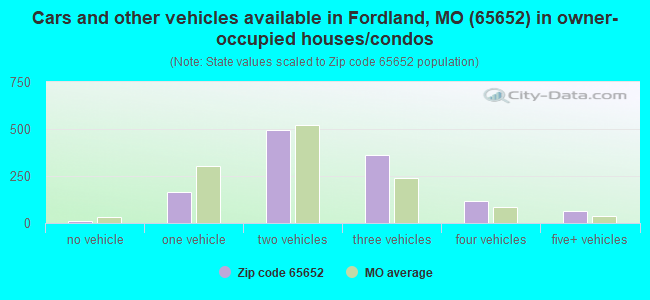
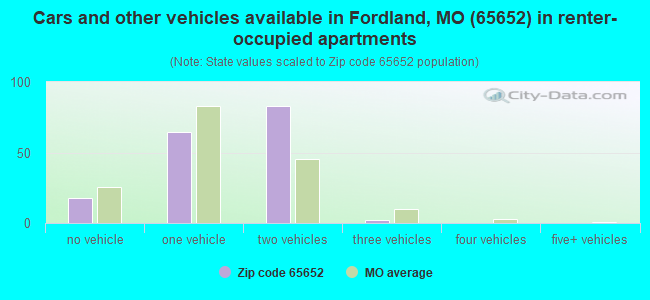
Houses and condos: 1,488 Renter-occupied apartments: 167
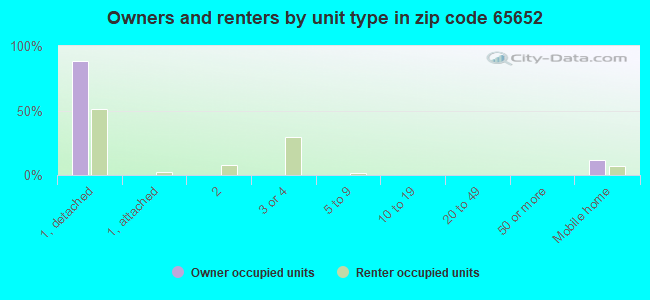
% of renters here:
12%
State:
32%
March 2022 cost of living index in zip code 65652: 76.5 (low, U.S. average is 100)
Land area: 72.3 sq. mi. Water area: 0.1 sq. mi.
Population density: 61 people per square mile
(very low).
OSM Map
General Map
Google Map
MSN Map
OSM Map
General Map
Google Map
MSN Map
OSM Map
General Map
Google Map
MSN Map
OSM Map
General Map
Google Map
MSN Map
Please wait while loading the map...
Real estate property taxes paid for housing units in 2022:
This zip code:
0.5% ($1,121)
Missouri:
0.8% ($1,810)
Median real estate property taxes paid for housing units with mortgages in 2022: $1,141 (0.5%) Median real estate property taxes paid for housing units with no mortgage in 2022: $1,044 (0.5%)
Averages for the 2020 tax year for zip code 65652, filed in 2021:
Average Adjusted Gross Income (AGI) in 2020: $51,207 (Individual Income Tax Returns)
Here:
$51,207
State:
$68,151
Salary/wage: $49,152 (reported on 78.8% of returns)
Here:
$49,152
State:
$56,131
(% of AGI for various income ranges: 1211.1% for AGIs below $25k, 3690.9% for AGIs $25k-50k, 6646.4% for AGIs $50k-75k, 10322.0% for AGIs $75k-100k, 14360.0% for AGIs $100k-200k)
Taxable interest for individuals: $609 (reported on 27.5% of returns)
This zip code:
$609
Missouri:
$1,586
(% of AGI for various income ranges: 15.9% for AGIs below $25k, 11.5% for AGIs $25k-50k, 33.6% for AGIs $50k-75k, 15.0% for AGIs $75k-100k, 82.0% for AGIs $100k-200k)
Ordinary dividends: $1,306 (reported on 10.6% of returns)
Here:
$1,306
State:
$10,947
(% of AGI for various income ranges: 10.0% for AGIs below $25k, 13.3% for AGIs $25k-50k, 10.5% for AGIs $50k-75k, 18.0% for AGIs $75k-100k, 100.0% for AGIs $100k-200k)
Net capital gain/loss in AGI: +$9,113 (reported on 9.4% of returns)
Here:
+$9,113
State:
+$18,453
(% of AGI for various income ranges: 17.6% for AGIs below $25k, 23.0% for AGIs $25k-50k, 54.5% for AGIs $50k-75k, 369.0% for AGIs $75k-100k, 737.0% for AGIs $100k-200k)
Profit/loss from business: +$8,900 (reported on 19.4% of returns)
Here:
+$8,900
State:
+$12,260
(% of AGI for various income ranges: 218.4% for AGIs below $25k, 200.3% for AGIs $25k-50k, 85.0% for AGIs $50k-75k, 304.0% for AGIs $75k-100k, 799.0% for AGIs $100k-200k)
Taxable individual retirement arrangement distribution: $15,269 (reported on 8.1% of returns)
65652:
$15,269
Missouri:
$19,719
(% of AGI for various income ranges: 55.1% for AGIs below $25k, 98.2% for AGIs $25k-50k, 362.7% for AGIs $50k-75k, 659.0% for AGIs $100k-200k)
Total itemized deductions: $28,220 (reported on 3.1% of returns)
Here:
$28,220
State:
$36,651
(% of AGI for various income ranges: 131.6% for AGIs below $25k, 924.0% for AGIs $75k-100k)
Charity contributions: $9,200 (reported on 1.9% of returns)
Here:
$9,200
State:
$15,671
(% of AGI for various income ranges: 276.0% for AGIs $75k-100k)
Taxes paid: $4,400 (reported on 3.1% of returns)
65652:
$4,400
State:
$7,608
(% of AGI for various income ranges: 220.0% for AGIs $75k-100k)
Earned income credit: $2,393 (reported on 18.1% of returns)
Here:
$2,393
State:
$2,315
(% of AGI for various income ranges: 102.4% for AGIs below $25k, 95.5% for AGIs $25k-50k)
Percentage of individuals using paid preparers for their 2020 taxes: 93.8%
Here:
94%
State:
93%
(% for various income ranges: 94.5% for AGIs below $25k, 95.2% for AGIs $25k-50k, 93.1% for AGIs $50k-75k, 87.5% for AGIs $75k-100k, 100.0% for AGIs $100k-200k, 66.7% for AGIs over 200k)
Averages for the 2012 tax year for zip code 65652, filed in 2013:
Average Adjusted Gross Income (AGI) in 2012: $42,536 (Individual Income Tax Returns)
Here:
$42,536
State:
$55,896
Salary/wage: $39,658 (reported on 82.6% of returns)
Here:
$39,658
State:
$46,205
(% of AGI for various income ranges: 77.2% for AGIs below $25k, 79.4% for AGIs $25k-50k, 82.9% for AGIs $50k-75k, 82.6% for AGIs $75k-100k, 63.5% for AGIs $100k-200k)
Taxable interest for individuals: $700 (reported on 29.7% of returns)
This zip code:
$700
Missouri:
$1,559
(% of AGI for various income ranges: 1.4% for AGIs below $25k, 0.4% for AGIs $25k-50k, 0.3% for AGIs $50k-75k, 0.2% for AGIs $75k-100k, 0.5% for AGIs $100k-200k)
Ordinary dividends: $775 (reported on 11.6% of returns)
Here:
$775
State:
$7,410
(% of AGI for various income ranges: 0.4% for AGIs below $25k, 0.3% for AGIs $25k-50k, 0.2% for AGIs $75k-100k, 0.1% for AGIs $100k-200k)
Net capital gain/loss in AGI: +$3,593 (reported on 10.1% of returns)
Here:
+$3,593
State:
+$11,579
(% of AGI for various income ranges: 0.4% for AGIs below $25k, 0.4% for AGIs $25k-50k, 1.3% for AGIs $50k-75k, 2.3% for AGIs $75k-100k)
Profit/loss from business: +$9,262 (reported on 17.4% of returns)
Here:
+$9,262
State:
+$11,688
(% of AGI for various income ranges: 8.9% for AGIs below $25k, 4.7% for AGIs $25k-50k, 2.8% for AGIs $50k-75k, 5.3% for AGIs $75k-100k)
Taxable individual retirement arrangement distribution: $11,400 (reported on 9.4% of returns)
65652:
$11,400
Missouri:
$14,773
(% of AGI for various income ranges: 2.8% for AGIs below $25k, 2.3% for AGIs $25k-50k, 2.6% for AGIs $50k-75k, 5.9% for AGIs $75k-100k)
Total itemized deductions: $18,080 (22% of AGI, reported on 21.7% of returns)
Here:
$18,080
State:
$22,730
Here:
22.4% of AGI
State:
19.2% of AGI
(% of AGI for various income ranges: 5.7% for AGIs below $25k, 7.9% for AGIs $25k-50k, 9.2% for AGIs $50k-75k, 10.0% for AGIs $75k-100k, 12.0% for AGIs $100k-200k)
Charity contributions: $4,105 (reported on 13.8% of returns)
Here:
$4,105
State:
$4,745
(% of AGI for various income ranges: 1.2% for AGIs $25k-50k, 1.4% for AGIs $50k-75k, 1.7% for AGIs $75k-100k, 1.8% for AGIs $100k-200k)
Taxes paid: $4,720 (reported on 21.7% of returns)
65652:
$4,720
State:
$8,399
(% of AGI for various income ranges: 0.6% for AGIs below $25k, 1.1% for AGIs $25k-50k, 1.7% for AGIs $50k-75k, 2.8% for AGIs $75k-100k, 5.2% for AGIs $100k-200k)
Earned income credit: $2,294 (reported on 23.2% of returns)
Here:
$2,294
State:
$2,288
(% of AGI for various income ranges: 6.7% for AGIs below $25k, 1.8% for AGIs $25k-50k)
Percentage of individuals using paid preparers for their 2012 taxes: 63.8%
Here:
64%
State:
55%
(% for various income ranges: 61.4% for AGIs below $25k, 63.2% for AGIs $25k-50k, 62.5% for AGIs $50k-75k, 72.7% for AGIs $75k-100k, 75.0% for AGIs $100k-200k)
Averages for the 2004 tax year for zip code 65652, filed in 2005:
Average Adjusted Gross Income (AGI) in 2004: $32,176 (Individual Income Tax Returns)
Here:
$32,176
State:
$44,591
Salary/wage: $31,923 (reported on 85.3% of returns)
Here:
$31,923
State:
$38,941
(% of AGI for various income ranges: 217.5% for AGIs below $10k, 82.3% for AGIs $10k-25k, 86.0% for AGIs $25k-50k, 88.9% for AGIs $50k-75k, 82.9% for AGIs $75k-100k, 58.2% for AGIs over 100k)
Taxable interest for individuals: $834 (reported on 35.0% of returns)
This zip code:
$834
Missouri:
$1,801
(% of AGI for various income ranges: 7.6% for AGIs below $10k, 2.1% for AGIs $10k-25k, 0.8% for AGIs $25k-50k, 0.6% for AGIs $50k-75k, 0.2% for AGIs $75k-100k, 0.3% for AGIs over 100k)
Taxable dividends: $472 (reported on 12.6% of returns)
Here:
$472
State:
$3,677
(% of AGI for various income ranges: 0.5% for AGIs below $10k, 0.4% for AGIs $10k-25k, 0.2% for AGIs $25k-50k, 0.1% for AGIs $50k-75k, 0.2% for AGIs $75k-100k, 0.1% for AGIs over 100k)
Net capital gain/loss: +$5,323 (reported on 12.0% of returns)
Here:
+$5,323
State:
+$8,915
(% of AGI for various income ranges: -0.3% for AGIs below $10k, 1.3% for AGIs $10k-25k, 1.7% for AGIs $25k-50k, 1.8% for AGIs $50k-75k, 3.9% for AGIs $75k-100k, 1.9% for AGIs over 100k)
Profit/loss from business: +$4,422 (reported on 21.3% of returns)
Here:
+$4,422
State:
+$9,793
(% of AGI for various income ranges: 18.5% for AGIs below $10k, 6.2% for AGIs $10k-25k, 2.8% for AGIs $25k-50k, 2.1% for AGIs $50k-75k, 1.9% for AGIs $75k-100k)
IRA payment deduction: $2,850 (reported on 1.4% of returns)
65652:
$2,850
Missouri:
$2,972
Total itemized deductions: $14,621 (25% of AGI, reported on 21.4% of returns)
Here:
$14,621
State:
$18,261
Here:
25.3% of AGI
State:
20.5% of AGI
(% of AGI for various income ranges: 22.6% for AGIs below $10k, 5.6% for AGIs $10k-25k, 7.7% for AGIs $25k-50k, 10.9% for AGIs $50k-75k, 15.4% for AGIs $75k-100k, 10.1% for AGIs over 100k)
Charity contributions deductions: $2,654 (4% of AGI, reported on 15.4% of returns)
Here:
$2,654
State:
$3,665
Here:
4.2% of AGI
State:
3.9% of AGI
(% of AGI for various income ranges: 0.4% for AGIs $10k-25k, 1.1% for AGIs $25k-50k, 1.5% for AGIs $50k-75k, 1.8% for AGIs $75k-100k, 2.0% for AGIs over 100k)
Total tax: $3,393 (reported on 72.1% of returns)
65652:
$3,393
State:
$6,999
(% of AGI for various income ranges: 8.6% for AGIs below $10k, 3.8% for AGIs $10k-25k, 5.7% for AGIs $25k-50k, 7.8% for AGIs $50k-75k, 9.9% for AGIs $75k-100k, 15.7% for AGIs over 100k)
Earned income credit: $1,678 (reported on 21.6% of returns)
Here:
$1,678
State:
$1,728
Percentage of individuals using paid preparers for their 2004 taxes: 68.7%
Here:
69%
State:
62%
(% for various income ranges: 66.8% for AGIs below $10k, 68.8% for AGIs $10k-25k, 64.5% for AGIs $25k-50k, 77.5% for AGIs $50k-75k, 72.4% for AGIs $75k-100k, 81.2% for AGIs over 100k)
Household received Food Stamps/SNAP in the past 12 months: 147 Household did not receive Food Stamps/SNAP in the past 12 months: 1,240
Women who had a birth in the past 12 months: 88 (84 now married, 0 unmarried) Women who did not have a birth in the past 12 months: 613 (380 now married, 229 unmarried)
Housing units in zip code 65652 with a mortgage: 814 (66 second mortgage, 60 both second mortgage and home equity loan) Median monthly owner costs for units with a mortgage: $1,107 Median monthly owner costs for units without a mortgage: $420
Residents with income below the poverty level in 2022:
This zip code:
12.0%
Whole state:
13.2%
Residents with income below 50% of the poverty level in 2022:
This zip code:
6.4%
Whole state:
6.8%
Median number of rooms in houses and condos:
Here:
6.0
State:
6.4
Median number of rooms in apartments:
Here:
4.6
State:
4.4
Notable locations in this zip code not listed on our city pages
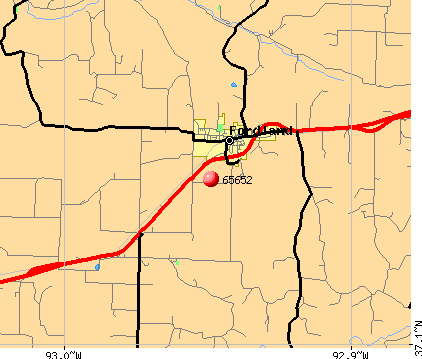
Notable locations in zip code 65652: Mathal (A), Tandy (B), Fordland Honor Camp (C), Southern Webster County Fire Protection District Station 4 (D), Southern Webster County Fire Protection District Station 1 (E). Display/hide their locations on the map
Churches in zip code 65652 include: Pleasant View Church (A), Union Chapel (B), Cass Chapel (C), Fairview Church (D), Mount Gillian Church (E), Green Hill Chapel (F), West Finley Church (G). Display/hide their locations on the map
Cemeteries: Steward Cemetery (1), Easter Cemetery (2), Temple Hill Cemetery (3), Panther Valley Cemetery (4), Ragsdale Cemetery (5), Fordland Cemetery (6), West Finley Cemetery (7). Display/hide their locations on the map
Streams, rivers, and creeks: Martins Branch (A), Dry Fork (B), Davis Branch (C), Stewart Creek (D), Terell Branch (E), Greasy Creek (F). Display/hide their locations on the map
In group quarters: 649 (-1 institutionalized population)
Size of family households: 618 2-persons, 167 3-persons, 115 4-persons, 105 5-persons, 31 6-persons, 36 7-or-more-persons
Size of nonfamily households: 298 1-person, 14 2-persons
756 married couples with children.
116 single-parent households (53 men, 63 women).
95.4% of residents of 65652 zip code speak English at home.
0.6% of residents speak Spanish at home (83% very well, 8% well, 8% not well).
2.9% of residents speak other Indo-European language at home (94% very well, 6% not well).
0.1% of residents speak Asian or Pacific Island language at home (100% well).
1.1% of residents speak other language at home (58% very well, 42% not well).
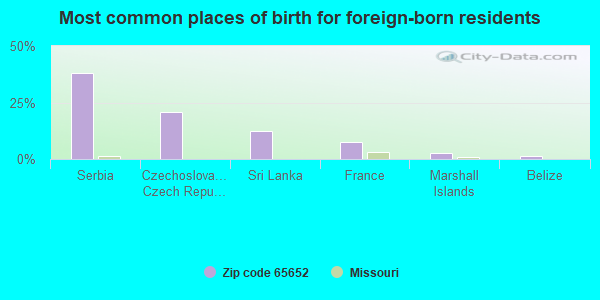
Foreign born population: 81 (1.8%) (91.7% of them are naturalized citizens)
This zip code:
1.8%
Whole state:
4.1%
38%Serbia
21%Czechoslovakia (includes Czech Republic and Slovakia)
12%Sri Lanka
7%France
2%Marshall Islands
1%Belize
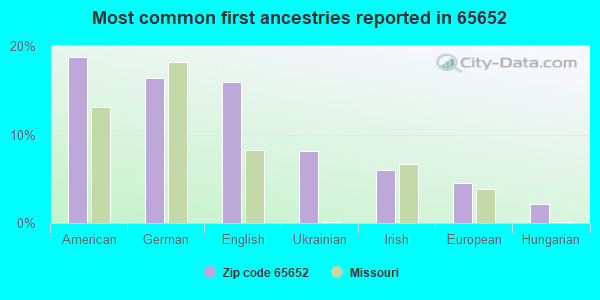
19%American
16%German
16%English
8%Ukrainian
6%Irish
5%European
2%Hungarian
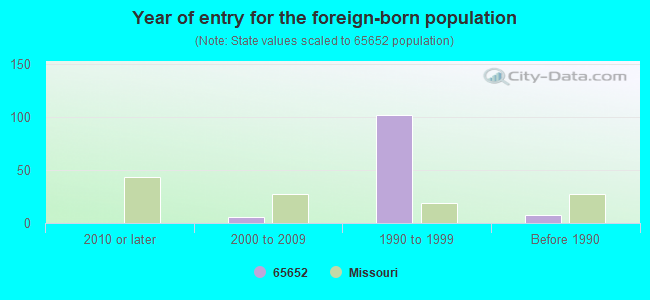
Year of entry for the foreign-born population
02010 or later
62000 to 2009
1021990 to 1999
8Before 1990
Facilities with environmental interests located in this zip code:
FORDLAND WASTE WATER TREATMENT FACILITY (MAIN STREET in FORDLAND, MO)
(Integrated Compliance Information System) - ICIS-07-1997-0321, FORMAL ENFORCEMENT ACTION STATE MASTER (Missouri monitoring and compilance) - ICIS-31712, ENFORCEMENT/COMPLIANCE ACTIVITY, PCS-MO0099813, NPDES NON-MAJOR National Pollutant Discharge Elimination System NON-MAJOR (Tracking pollutant discharge elimination systems) - permit COMMUNITY WATER SYSTEM (SDWIS) Business SIC classification: SEWERAGE SYSTEMS Organizations: CITY OF FORDLAND (CONTACT/OWNER)
Alternative names: FORDLAND WATER SUPPLY C/O CITY HALL, FORDLAND WWTF
OZARK CORRECTIONAL CENTER (929 ONNER CAMP LANE in FORDLAND, MO)
STATE MASTER (Missouri monitoring and compilance) - PCS-MO0093556, NPDES NON-MAJOR, RCRAINFO-MOR000014217, NOT IN A UNIVERSE National Pollutant Discharge Elimination System NON-MAJOR (Tracking pollutant discharge elimination systems) - permit (Resource Conservation and Recovery Act (tracking hazardous waste)) COMMUNITY WATER SYSTEM (SDWIS) Business SIC classification: CORRECTIONAL INSTITUTIONS Organizations: MO DEPT OF CORRECTIONS (CONTACT/OWNER)
, MISSOURI DEPARTMENT OF CO (CONTACT/OWNER)
Alternative names: MDOC,OZARK CORRECTNL CNTR, MO DEPT OF CORRECTIONS
G T E (102 MAIN ST in FORDLAND, MO)
STATE MASTER (Missouri monitoring and compilance) - RCRAINFO-MOP000026070, NOT IN A UNIVERSE (Resource Conservation and Recovery Act (tracking hazardous waste)) Organizations: GTE (CONTACT/OWNER)
FORDLAND ELEM. (252 N CENTER ST in FORDLAND, MO)
(National Center for Education Statistics) - STATE ID-4020112101 Organizations: FORDLAND R-III (SCHOOL DISTRICT)
FORDLAND HIGH (1248 SCHOOL ST in FORDLAND, MO)
(National Center for Education Statistics) - STATE ID-1050112101 Organizations: FORDLAND R-III (SCHOOL DISTRICT)
FORDLAND MIDDLE (1230 SCHOOL ST in FORDLAND, MO)
(National Center for Education Statistics) - STATE ID-3000112101 Organizations: FORDLAND R-III (SCHOOL DISTRICT)
Housing units lacking complete plumbing facilities: 3.4% Housing units lacking complete kitchen facilities: 4.1%
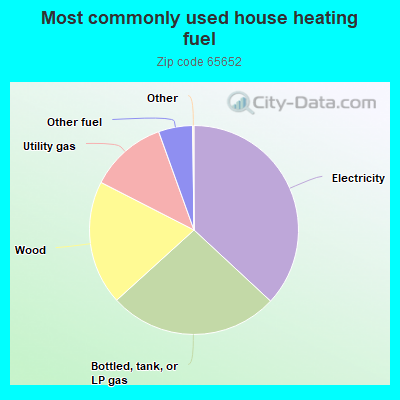
37.0%Electricity
26.4%Bottled, tank, or LP gas
19.3%Wood
12.0%Utility gas
5.3%Other fuel
Population in 1990: 2,080. Population change in the 1990s: +1,610 (+77.4%).
Place of birth for U.S.-born residents:
This state: 2,672
Northeast: 96
Midwest: 544
South: 530
West: 442
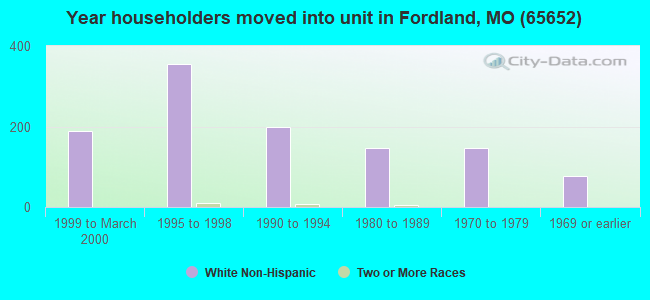
50% of the 65652 zip code residents lived in the same house 5 years ago. Out of people who lived in different houses, 27% lived in this county. Out of people who lived in different counties, 50% lived in Missouri.
87% of the 65652 zip code residents lived in the same house 1 year ago. Out of people who lived in different houses, 7% moved from this county. Out of people who lived in different houses, 78% moved from different county within same state. Out of people who lived in different houses, 17% moved from different state.
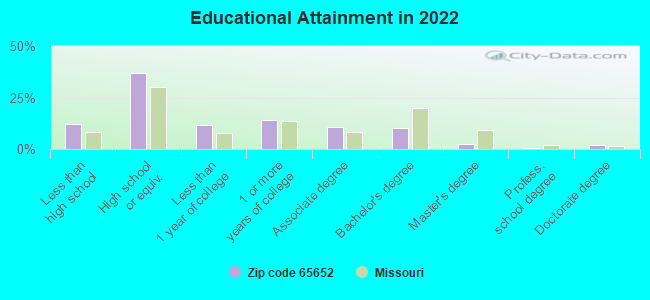
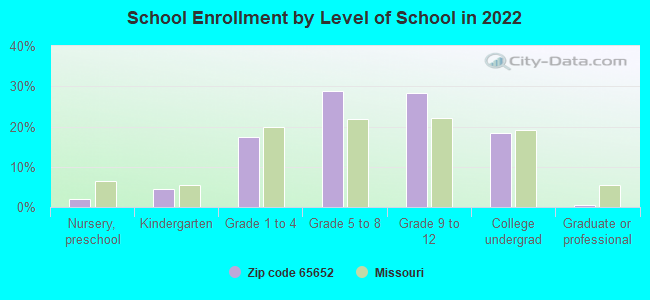
Private vs. public school enrollment:
Students in private schools in grades 1 to 8 (elementary and middle school): 48
Here:
12.3%
Missouri:
15.4%
Students in private schools in grades 9 to 12 (high school): 54
Here:
22.5%
Missouri:
13.9%
Students in private undergraduate colleges: 21
Here:
13.5%
Missouri:
22.6%
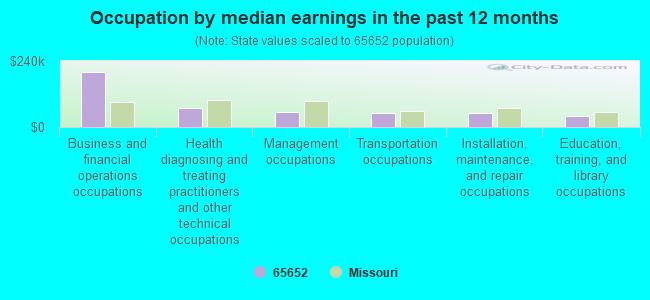
Occupation by median earnings in the past 12 months ($)
201,364Business and financial operations occupations
69,073Health diagnosing and treating practitioners and other technical occupations
56,353Management occupations
50,593Transportation occupations
49,950Installation, maintenance, and repair occupations
39,057Education, training, and library occupations
Top industries in this zip code by the number of employees in 2005:
Health Care and Social Assistance: All Other Outpatient Care Centers (10-19 employees: 2 establishments)
Accommodation and Food Services: Full-Service Restaurants (10-19: 1, 5-9: 1)
Administrative and Support and Waste Management and Remediation Services: Solid Waste Collection (10-19: 1)
Finance and Insurance: Commercial Banking (10-19: 1)
Construction: Plumbing, Heating, and Air-Conditioning Contractors (10-19: 1)
Health Care and Social Assistance: Child Day Care Services (5-9: 1, 1-4: 1)
Health Care and Social Assistance: Offices of Mental Health Practitioners (except Physicians) (5-9: 1)
Wholesale Trade: Electrical and Electronic Appliance, Television, and Radio Set Merchant Wholesalers (5-9: 1)
People in group quarters in 2010:
629 people in state prisons
People in group quarters in 2000:
678 people in state prisons
Fatal accident statistics in 2012:
Fatal accident count: 1
Vehicles involved in fatal accidents: 1
Fatal accidents caused by drunken drivers: 0
Fatalities: 1
Persons involved in fatal accidents: 1
Pedestrians involved in fatal accidents: 0
Home Mortgage Disclosure Act Aggregated Statistics For Year 2009 (Based on 4 partial tracts)
A) FHA, FSA/RHS & VA Home Purchase Loans
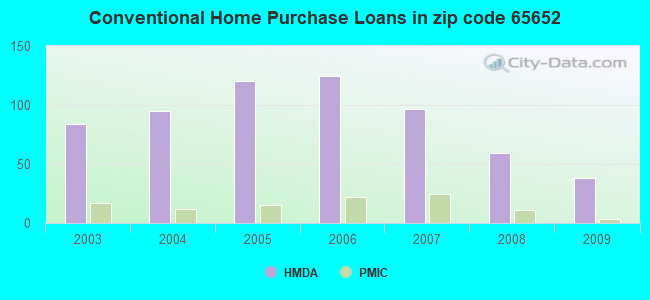
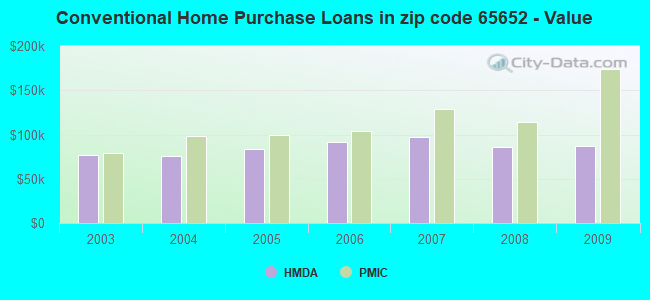
B) Conventional Home Purchase Loans
C) Refinancings
D) Home Improvement Loans
F) Non-occupant Loans on < 5 Family Dwellings (A B C & D)
G) Loans On Manufactured Home Dwelling (A B C & D)
Number
Average Value
Number
Average Value
Number
Average Value
Number
Average Value
Number
Average Value
Number
Average Value
LOANS ORIGINATED
25
$105,663
38
$86,763
154
$124,997
15
$32,877
18
$69,655
12
$44,577
APPLICATIONS APPROVED, NOT ACCEPTED
1
$58,550
2
$143,885
11
$163,835
0
$0
1
$121,090
1
$33,290
APPLICATIONS DENIED
2
$69,505
7
$77,081
57
$126,922
6
$27,350
1
$159,280
7
$61,533
APPLICATIONS WITHDRAWN
2
$126,320
3
$109,137
31
$129,195
1
$86,500
0
$0
2
$42,985
FILES CLOSED FOR INCOMPLETENESS
0
$0
1
$17,220
7
$113,281
0
$0
0
$0
1
$40,180
Aggregated Statistics For Year 2008 (Based on 4 partial tracts)
A) FHA, FSA/RHS & VA Home Purchase Loans
B) Conventional Home Purchase Loans
C) Refinancings
D) Home Improvement Loans
F) Non-occupant Loans on < 5 Family Dwellings (A B C & D)
G) Loans On Manufactured Home Dwelling (A B C & D)
Number
Average Value
Number
Average Value
Number
Average Value
Number
Average Value
Number
Average Value
Number
Average Value
LOANS ORIGINATED
22
$106,481
59
$86,256
119
$106,081
14
$51,754
23
$69,817
21
$41,480
APPLICATIONS APPROVED, NOT ACCEPTED
0
$0
2
$92,040
11
$120,920
0
$0
0
$0
1
$56,890
APPLICATIONS DENIED
5
$80,274
16
$81,820
66
$111,405
12
$52,012
4
$127,120
7
$80,330
APPLICATIONS WITHDRAWN
1
$171,090
8
$85,582
23
$120,773
1
$97,580
3
$82,163
2
$70,935
FILES CLOSED FOR INCOMPLETENESS
1
$48,790
0
$0
3
$125,100
1
$40,180
0
$0
0
$0
Aggregated Statistics For Year 2007 (Based on 4 partial tracts)
A) FHA, FSA/RHS & VA Home Purchase Loans
B) Conventional Home Purchase Loans
C) Refinancings
D) Home Improvement Loans
F) Non-occupant Loans on < 5 Family Dwellings (A B C & D)
G) Loans On Manufactured Home Dwelling (A B C & D)
Number
Average Value
Number
Average Value
Number
Average Value
Number
Average Value
Number
Average Value
Number
Average Value
LOANS ORIGINATED
13
$111,828
97
$96,975
129
$104,514
23
$55,774
25
$88,378
26
$51,107
APPLICATIONS APPROVED, NOT ACCEPTED
0
$0
7
$78,084
17
$111,399
2
$16,105
1
$106,270
1
$45,920
APPLICATIONS DENIED
5
$96,982
31
$77,554
86
$110,468
13
$58,048
6
$92,287
10
$61,721
APPLICATIONS WITHDRAWN
1
$176,070
12
$109,422
24
$108,158
4
$63,988
1
$68,840
2
$90,460
FILES CLOSED FOR INCOMPLETENESS
1
$124,280
3
$62,503
12
$140,242
0
$0
1
$161,890
1
$63,320
Aggregated Statistics For Year 2006 (Based on 4 partial tracts)
A) FHA, FSA/RHS & VA Home Purchase Loans
B) Conventional Home Purchase Loans
C) Refinancings
D) Home Improvement Loans
F) Non-occupant Loans on < 5 Family Dwellings (A B C & D)
G) Loans On Manufactured Home Dwelling (A B C & D)
Number
Average Value
Number
Average Value
Number
Average Value
Number
Average Value
Number
Average Value
Number
Average Value
LOANS ORIGINATED
11
$80,849
125
$91,277
144
$91,862
25
$45,610
40
$85,100
23
$46,490
APPLICATIONS APPROVED, NOT ACCEPTED
0
$0
16
$88,414
18
$118,074
3
$50,723
2
$104,450
4
$70,578
APPLICATIONS DENIED
1
$123,130
50
$75,185
108
$98,503
15
$42,028
7
$84,536
29
$58,716
APPLICATIONS WITHDRAWN
1
$139,700
12
$85,935
42
$99,860
5
$66,342
3
$103,580
0
$0
FILES CLOSED FOR INCOMPLETENESS
0
$0
3
$78,650
6
$145,632
1
$40,180
0
$0
1
$8,040
Aggregated Statistics For Year 2005 (Based on 4 partial tracts)
A) FHA, FSA/RHS & VA Home Purchase Loans
B) Conventional Home Purchase Loans
C) Refinancings
D) Home Improvement Loans
E) Loans on Dwellings For 5+ Families
F) Non-occupant Loans on < 5 Family Dwellings (A B C & D)
G) Loans On Manufactured Home Dwelling (A B C & D)
Number
Average Value
Number
Average Value
Number
Average Value
Number
Average Value
Number
Average Value
Number
Average Value
Number
Average Value
LOANS ORIGINATED
13
$98,843
120
$84,120
165
$89,751
24
$47,790
2
$925,140
24
$68,572
22
$38,371
APPLICATIONS APPROVED, NOT ACCEPTED
1
$158,630
11
$92,645
16
$86,489
1
$111,080
0
$0
2
$38,255
4
$84,882
APPLICATIONS DENIED
1
$101,530
42
$70,837
86
$90,251
18
$40,513
1
$72,320
4
$87,132
23
$49,210
APPLICATIONS WITHDRAWN
2
$93,045
16
$77,966
48
$102,571
5
$94,530
0
$0
4
$82,430
7
$65,357
FILES CLOSED FOR INCOMPLETENESS
0
$0
2
$106,670
8
$143,579
0
$0
0
$0
0
$0
0
$0
Aggregated Statistics For Year 2004 (Based on 4 partial tracts)
A) FHA, FSA/RHS & VA Home Purchase Loans
B) Conventional Home Purchase Loans
C) Refinancings
D) Home Improvement Loans
E) Loans on Dwellings For 5+ Families
F) Non-occupant Loans on < 5 Family Dwellings (A B C & D)
G) Loans On Manufactured Home Dwelling (A B C & D)
Number
Average Value
Number
Average Value
Number
Average Value
Number
Average Value
Number
Average Value
Number
Average Value
Number
Average Value
LOANS ORIGINATED
17
$94,619
95
$75,406
129
$99,160
26
$43,191
1
$919,140
20
$55,148
16
$38,082
APPLICATIONS APPROVED, NOT ACCEPTED
1
$109,460
10
$69,166
19
$97,680
0
$0
0
$0
1
$58,750
4
$71,920
APPLICATIONS DENIED
2
$88,125
31
$68,057
91
$86,257
17
$42,846
0
$0
6
$83,770
18
$51,798
APPLICATIONS WITHDRAWN
1
$97,640
12
$63,362
51
$96,133
4
$79,392
0
$0
1
$33,650
5
$42,246
FILES CLOSED FOR INCOMPLETENESS
1
$104,120
1
$49,940
13
$99,868
1
$14,890
0
$0
0
$0
0
$0
Aggregated Statistics For Year 2003 (Based on 4 partial tracts)
A) FHA, FSA/RHS & VA Home Purchase Loans
B) Conventional Home Purchase Loans
C) Refinancings
D) Home Improvement Loans
F) Non-occupant Loans on < 5 Family Dwellings (A B C & D)
Detailed PMIC statistics for the following Tracts:9703.00
, 9704.00
2002 - 2018 National Fire Incident Reporting System (NFIRS) incidents
Based on the data from the years 2002 - 2018 the average number of fires per year is 20. The highest number of fire incidents - 44 took place in 2006, and the least - 3 in 2018. The data has a declining trend.
When looking into fire subcategories, the most incidents belonged to: Outside Fires (42.5%), and Structure Fires (37.3%).
Fire incident types reported to NFIRS in Zip Code 65652
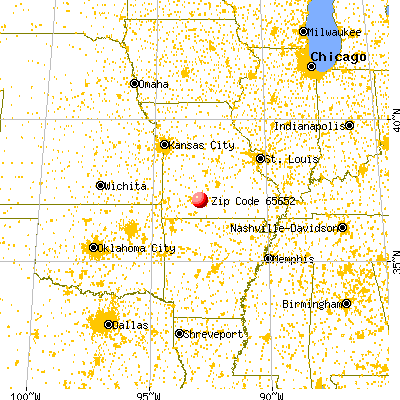


 Nearest zip codes: 65620, 65742, 65753, 65746, 65720, 65706.


 Based on the data from the years 2002 - 2018 the average number of fires per year is 20. The highest number of fire incidents - 44 took place in 2006, and the least - 3 in 2018. The data has a declining trend.
 When looking into fire subcategories, the most incidents belonged to: Outside Fires (42.5%), and Structure Fires (37.3%).