Estimated zip code population in 2022: 21,121 Zip code population in 2010: 21,852 Zip code population in 2000: 20,643
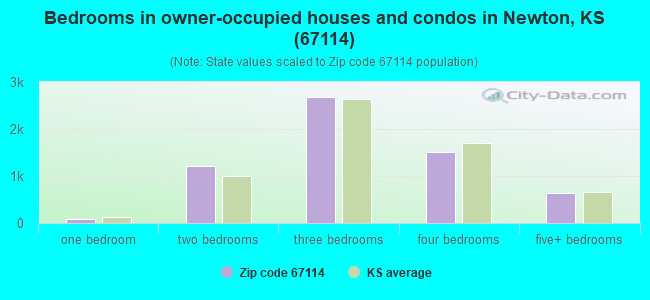
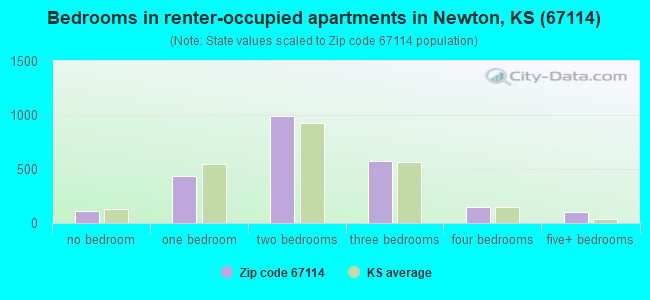
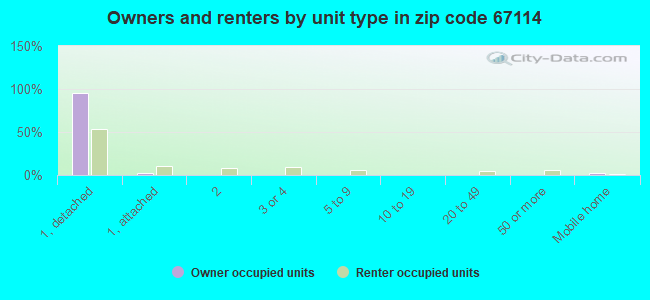
Houses and condos: 9,433 Renter-occupied apartments: 2,362
% of renters here:
28%
State:
32%
March 2022 cost of living index in zip code 67114: 81.5 (low, U.S. average is 100)
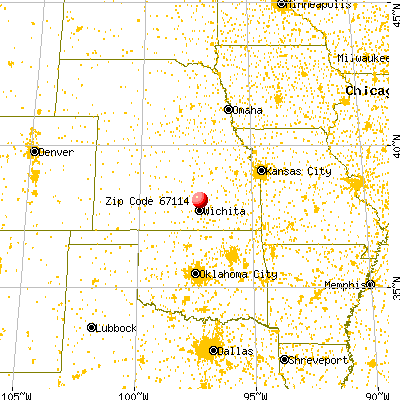
Land area: 237.6 sq. mi. Water area: 0.5 sq. mi.
Population density: 89 people per square mile
(very low).
OSM Map
General Map
Google Map
MSN Map
OSM Map
General Map
Google Map
MSN Map
OSM Map
General Map
Google Map
MSN Map
OSM Map
General Map
Google Map
MSN Map
Please wait while loading the map...
Real estate property taxes paid for housing units in 2022:
This zip code:
1.5% ($2,386)
Kansas:
1.2% ($2,578)
Median real estate property taxes paid for housing units with mortgages in 2022: $2,746 (1.6%) Median real estate property taxes paid for housing units with no mortgage in 2022: $1,964 (1.4%)
Averages for the 2020 tax year for zip code 67114, filed in 2021:
Average Adjusted Gross Income (AGI) in 2020: $54,770 (Individual Income Tax Returns)
Here:
$54,770
State:
$72,721
Salary/wage: $47,440 (reported on 82.4% of returns)
Here:
$47,440
State:
$58,641
(% of AGI for various income ranges: 1213.2% for AGIs below $25k, 3764.8% for AGIs $25k-50k, 6619.3% for AGIs $50k-75k, 9839.3% for AGIs $75k-100k, 16796.9% for AGIs $100k-200k, 64300.0% for AGIs over 200k)
Taxable interest for individuals: $1,039 (reported on 30.0% of returns)
This zip code:
$1,039
Kansas:
$1,625
(% of AGI for various income ranges: 20.3% for AGIs below $25k, 21.4% for AGIs $25k-50k, 39.0% for AGIs $50k-75k, 72.7% for AGIs $75k-100k, 112.5% for AGIs $100k-200k, 956.7% for AGIs over 200k)
Ordinary dividends: $3,804 (reported on 16.7% of returns)
Here:
$3,804
State:
$7,290
(% of AGI for various income ranges: 21.5% for AGIs below $25k, 24.9% for AGIs $25k-50k, 76.2% for AGIs $50k-75k, 119.0% for AGIs $75k-100k, 260.5% for AGIs $100k-200k, 3426.7% for AGIs over 200k)
Net capital gain/loss in AGI: +$7,808 (reported on 15.6% of returns)
Here:
+$7,808
State:
+$20,511
(% of AGI for various income ranges: 10.6% for AGIs below $25k, 29.8% for AGIs $25k-50k, 90.8% for AGIs $50k-75k, 159.3% for AGIs $75k-100k, 578.8% for AGIs $100k-200k, 9300.0% for AGIs over 200k)
Profit/loss from business: +$11,287 (reported on 12.4% of returns)
Here:
+$11,287
State:
+$13,852
(% of AGI for various income ranges: 75.9% for AGIs below $25k, 110.8% for AGIs $25k-50k, 239.6% for AGIs $50k-75k, 224.5% for AGIs $75k-100k, 574.0% for AGIs $100k-200k, 3646.7% for AGIs over 200k)
Taxable individual retirement arrangement distribution: $15,965 (reported on 11.4% of returns)
67114:
$15,965
Kansas:
$19,921
(% of AGI for various income ranges: 72.2% for AGIs below $25k, 101.5% for AGIs $25k-50k, 267.6% for AGIs $50k-75k, 428.4% for AGIs $75k-100k, 894.3% for AGIs $100k-200k, 4963.3% for AGIs over 200k)
Self-employed (Keogh) retirement plans: $11,933 (reported on 0.3% of returns)
67114:
$11,933
Kansas:
$25,388
(% of AGI for various income ranges: 55.1% for AGIs $100k-200k)
Total itemized deductions: $33,685 (reported on 4.8% of returns)
Here:
$33,685
State:
$36,939
(% of AGI for various income ranges: 56.5% for AGIs below $25k, 86.8% for AGIs $25k-50k, 205.6% for AGIs $50k-75k, 250.7% for AGIs $75k-100k, 846.0% for AGIs $100k-200k, 6053.3% for AGIs over 200k)
Charity contributions: $14,721 (reported on 3.9% of returns)
Here:
$14,721
State:
$15,443
(% of AGI for various income ranges: 5.2% for AGIs below $25k, 16.4% for AGIs $25k-50k, 44.2% for AGIs $50k-75k, 87.9% for AGIs $75k-100k, 339.7% for AGIs $100k-200k, 3340.0% for AGIs over 200k)
Taxes paid: $6,921 (reported on 4.7% of returns)
67114:
$6,921
State:
$8,001
(% of AGI for various income ranges: 5.2% for AGIs below $25k, 13.3% for AGIs $25k-50k, 36.0% for AGIs $50k-75k, 61.2% for AGIs $75k-100k, 199.2% for AGIs $100k-200k, 1265.0% for AGIs over 200k)
Earned income credit: $2,208 (reported on 15.8% of returns)
Here:
$2,208
State:
$2,267
(% of AGI for various income ranges: 81.6% for AGIs below $25k, 73.9% for AGIs $25k-50k, 1.9% for AGIs $50k-75k)
Percentage of individuals using paid preparers for their 2020 taxes: 95.6%
Here:
96%
State:
95%
(% for various income ranges: 94.9% for AGIs below $25k, 95.7% for AGIs $25k-50k, 97.4% for AGIs $50k-75k, 97.1% for AGIs $75k-100k, 94.8% for AGIs $100k-200k, 90.9% for AGIs over 200k)
Averages for the 2012 tax year for zip code 67114, filed in 2013:
Average Adjusted Gross Income (AGI) in 2012: $48,266 (Individual Income Tax Returns)
Here:
$48,266
State:
$60,095
Salary/wage: $41,629 (reported on 83.2% of returns)
Here:
$41,629
State:
$48,770
(% of AGI for various income ranges: 74.4% for AGIs below $25k, 77.5% for AGIs $25k-50k, 79.5% for AGIs $50k-75k, 77.3% for AGIs $75k-100k, 72.9% for AGIs $100k-200k, 38.6% for AGIs over 200k)
Taxable interest for individuals: $1,029 (reported on 35.2% of returns)
This zip code:
$1,029
Kansas:
$1,506
(% of AGI for various income ranges: 1.3% for AGIs below $25k, 0.7% for AGIs $25k-50k, 0.5% for AGIs $50k-75k, 0.6% for AGIs $75k-100k, 0.7% for AGIs $100k-200k, 1.0% for AGIs over 200k)
Ordinary dividends: $3,668 (reported on 18.1% of returns)
Here:
$3,668
State:
$6,093
(% of AGI for various income ranges: 1.2% for AGIs below $25k, 1.0% for AGIs $25k-50k, 1.0% for AGIs $50k-75k, 0.8% for AGIs $75k-100k, 1.3% for AGIs $100k-200k, 3.6% for AGIs over 200k)
Net capital gain/loss in AGI: +$8,350 (reported on 14.6% of returns)
Here:
+$8,350
State:
+$14,598
(% of AGI for various income ranges: 0.4% for AGIs $25k-50k, 0.5% for AGIs $50k-75k, 0.7% for AGIs $75k-100k, 1.4% for AGIs $100k-200k, 15.6% for AGIs over 200k)
Profit/loss from business: +$10,309 (reported on 14.3% of returns)
Here:
+$10,309
State:
+$12,554
(% of AGI for various income ranges: 4.2% for AGIs below $25k, 2.7% for AGIs $25k-50k, 2.9% for AGIs $50k-75k, 2.2% for AGIs $75k-100k, 3.9% for AGIs $100k-200k, 2.4% for AGIs over 200k)
Taxable individual retirement arrangement distribution: $10,199 (reported on 12.9% of returns)
67114:
$10,199
Kansas:
$14,098
(% of AGI for various income ranges: 4.6% for AGIs below $25k, 2.7% for AGIs $25k-50k, 2.2% for AGIs $50k-75k, 3.1% for AGIs $75k-100k, 3.0% for AGIs $100k-200k, 1.1% for AGIs over 200k)
Self-employment retirement plans: $14,920 (reported on 0.5% of returns)
67114:
$14,920
Kansas:
$19,780
Total itemized deductions: $20,194 (22% of AGI, reported on 25.6% of returns)
Here:
$20,194
State:
$23,678
Here:
21.9% of AGI
State:
18.9% of AGI
(% of AGI for various income ranges: 9.6% for AGIs below $25k, 9.1% for AGIs $25k-50k, 8.6% for AGIs $50k-75k, 11.4% for AGIs $75k-100k, 13.6% for AGIs $100k-200k, 11.4% for AGIs over 200k)
Charity contributions: $5,187 (reported on 20.8% of returns)
Here:
$5,187
State:
$5,321
(% of AGI for various income ranges: 1.2% for AGIs below $25k, 1.6% for AGIs $25k-50k, 1.5% for AGIs $50k-75k, 2.3% for AGIs $75k-100k, 3.2% for AGIs $100k-200k, 3.6% for AGIs over 200k)
Taxes paid: $6,933 (reported on 25.5% of returns)
67114:
$6,933
State:
$9,548
(% of AGI for various income ranges: 1.7% for AGIs below $25k, 2.0% for AGIs $25k-50k, 2.5% for AGIs $50k-75k, 4.1% for AGIs $75k-100k, 5.8% for AGIs $100k-200k, 5.3% for AGIs over 200k)
Earned income credit: $2,250 (reported on 17.8% of returns)
Here:
$2,250
State:
$2,212
(% of AGI for various income ranges: 6.0% for AGIs below $25k, 1.2% for AGIs $25k-50k)
Percentage of individuals using paid preparers for their 2012 taxes: 54.7%
Here:
55%
State:
56%
(% for various income ranges: 49.1% for AGIs below $25k, 56.3% for AGIs $25k-50k, 56.1% for AGIs $50k-75k, 59.6% for AGIs $75k-100k, 63.4% for AGIs $100k-200k, 85.7% for AGIs over 200k)
Averages for the 2004 tax year for zip code 67114, filed in 2005:
Average Adjusted Gross Income (AGI) in 2004: $37,515 (Individual Income Tax Returns)
Here:
$37,515
State:
$45,726
Salary/wage: $34,565 (reported on 84.2% of returns)
Here:
$34,565
State:
$40,112
(% of AGI for various income ranges: 107.8% for AGIs below $10k, 73.5% for AGIs $10k-25k, 80.6% for AGIs $25k-50k, 83.7% for AGIs $50k-75k, 80.9% for AGIs $75k-100k, 62.8% for AGIs over 100k)
Taxable interest for individuals: $1,375 (reported on 48.6% of returns)
This zip code:
$1,375
Kansas:
$1,749
(% of AGI for various income ranges: 7.7% for AGIs below $10k, 3.0% for AGIs $10k-25k, 1.6% for AGIs $25k-50k, 1.0% for AGIs $50k-75k, 1.1% for AGIs $75k-100k, 2.1% for AGIs over 100k)
Taxable dividends: $1,960 (reported on 23.4% of returns)
Here:
$1,960
State:
$3,066
(% of AGI for various income ranges: 4.6% for AGIs below $10k, 1.6% for AGIs $10k-25k, 0.8% for AGIs $25k-50k, 0.7% for AGIs $50k-75k, 0.8% for AGIs $75k-100k, 2.1% for AGIs over 100k)
Net capital gain/loss: +$3,683 (reported on 18.5% of returns)
Here:
+$3,683
State:
+$7,555
(% of AGI for various income ranges: -0.2% for AGIs below $10k, 0.6% for AGIs $10k-25k, 0.9% for AGIs $25k-50k, 0.9% for AGIs $50k-75k, 1.4% for AGIs $75k-100k, 5.4% for AGIs over 100k)
Profit/loss from business: +$9,043 (reported on 15.3% of returns)
Here:
+$9,043
State:
+$9,571
(% of AGI for various income ranges: 4.8% for AGIs below $10k, 3.0% for AGIs $10k-25k, 2.9% for AGIs $25k-50k, 2.9% for AGIs $50k-75k, 2.7% for AGIs $75k-100k, 6.8% for AGIs over 100k)
IRA payment deduction: $2,834 (reported on 3.1% of returns)
67114:
$2,834
Kansas:
$2,922
(% of AGI for various income ranges: 0.3% for AGIs below $10k, 0.2% for AGIs $10k-25k, 0.4% for AGIs $25k-50k, 0.3% for AGIs $50k-75k, 0.2% for AGIs $75k-100k, 0.1% for AGIs over 100k)
Self-employed pension: $9,141 (reported on 0.7% of returns)
Here:
$9,141
Kansas:
$14,209
(% of AGI for various income ranges: 0.0% for AGIs $25k-50k, 0.1% for AGIs $50k-75k, 0.1% for AGIs $75k-100k, 0.6% for AGIs over 100k)
Total itemized deductions: $16,333 (24% of AGI, reported on 27.5% of returns)
Here:
$16,333
State:
$18,779
Here:
23.6% of AGI
State:
20.5% of AGI
(% of AGI for various income ranges: 17.4% for AGIs below $10k, 12.9% for AGIs $10k-25k, 9.3% for AGIs $25k-50k, 11.1% for AGIs $50k-75k, 13.6% for AGIs $75k-100k, 14.1% for AGIs over 100k)
Charity contributions deductions: $4,069 (6% of AGI, reported on 23.7% of returns)
Here:
$4,069
State:
$3,892
Here:
5.6% of AGI
State:
4.0% of AGI
(% of AGI for various income ranges: 1.3% for AGIs below $10k, 1.8% for AGIs $10k-25k, 1.6% for AGIs $25k-50k, 2.5% for AGIs $50k-75k, 2.9% for AGIs $75k-100k, 4.3% for AGIs over 100k)
Total tax: $4,835 (reported on 71.5% of returns)
67114:
$4,835
State:
$7,203
(% of AGI for various income ranges: 2.4% for AGIs below $10k, 3.7% for AGIs $10k-25k, 6.4% for AGIs $25k-50k, 8.2% for AGIs $50k-75k, 10.2% for AGIs $75k-100k, 17.2% for AGIs over 100k)
Earned income credit: $1,596 (reported on 14.6% of returns)
Here:
$1,596
State:
$1,674
Percentage of individuals using paid preparers for their 2004 taxes: 64.6%
Here:
65%
State:
63%
(% for various income ranges: 59.0% for AGIs below $10k, 68.8% for AGIs $10k-25k, 65.1% for AGIs $25k-50k, 62.4% for AGIs $50k-75k, 65.1% for AGIs $75k-100k, 72.0% for AGIs over 100k)
Household received Food Stamps/SNAP in the past 12 months: 374 Household did not receive Food Stamps/SNAP in the past 12 months: 8,119
Women who had a birth in the past 12 months: 370 (294 now married, 76 unmarried) Women who did not have a birth in the past 12 months: 3,933 (1,693 now married, 2,240 unmarried)
Housing units in zip code 67114 with a mortgage: 3,378 (209 second mortgage, 1 home equity loan, 172 both second mortgage and home equity loan) Houses without a mortgage: 63
Median monthly owner costs for units with a mortgage: $1,352 Median monthly owner costs for units without a mortgage: $579
Residents with income below the poverty level in 2022:
This zip code:
11.6%
Whole state:
12.0%
Residents with income below 50% of the poverty level in 2022:
This zip code:
8.1%
Whole state:
6.4%
Median number of rooms in houses and condos:
Here:
6.8
State:
6.9
Median number of rooms in apartments:
Here:
5.3
State:
4.4
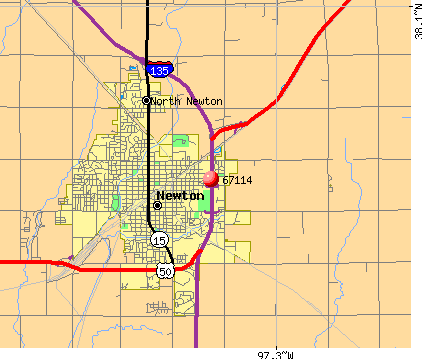
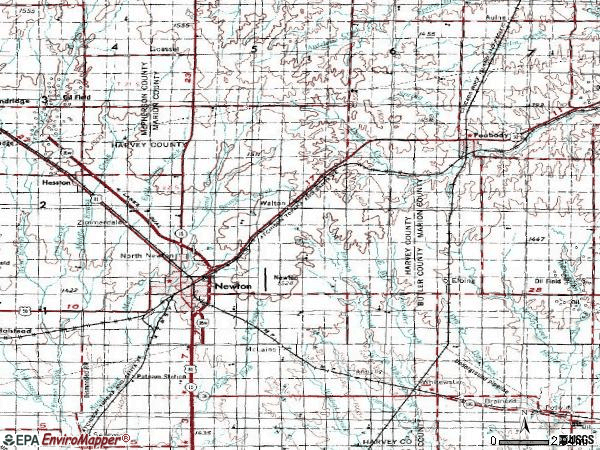
Notable locations in this zip code not listed on our city pages
Notable locations in zip code 67114: Sand Creek Station Golf Club (A), Pine Edge Golf Course (B), Newton Public Golf Course (C), Bethel College Thresher Stadium (D), Meadow Lake Campground (E), Newton Amtrak Station (F), Goessel Wastewater Treatment Plant (G), Newton Wastewater Plant (H), Elbing Wastewater Plant (I), Lake View Landing (J), Walton Landing (K), Newton Country Club (L), N N Siding (M), Team Marketing Alliance Grain Elevator Number 29 (N), Team Marketing Alliance Grain Elevator Number 26 (O), Team Marketing Alliance Grain Elevator Number 15 (P), Elbing Grain Elevator Number 1 (Q), Harvey County Fairgrounds (R), The Village Center (S), Kansas Highway Patrol Troop F (T). Display/hide their locations on the map
Churches in zip code 67114 include: Community Church of God (A), First Baptist Church (B), Kingdom Hall of Jehovah's Witnesses (C), Columbus Avenue Church of Christ (D), Chisholm Trail Bible Church (E), Trinity Heights United Methodist Church (F), First United Methodist Church (G), First Mennonite Church (H), Golden Plains Free Methodist Church (I). Display/hide their locations on the map
Cemeteries: Greenfield Cemetery (1), Restlawn Garden of Memory Cemetery (2), Church of God of the First Born Cemetery (3), Royer Cemetery (4), Greenwood Cemetery (5), Saint Mary's Cemetery (6), Mission Cemetery (7). Display/hide their locations on the map
Creeks: Walnut Creek (A), Beaver Creek (B), Dry Creek (C), Middle Emma Creek (D), East Fork Jester Creek (E), West Fork Jester Creek (F), Mud Creek (G). Display/hide their locations on the map
In group quarters: 430 (-1 institutionalized population)
Size of family households: 2,623 2-persons, 1,247 3-persons, 953 4-persons, 502 5-persons, 181 6-persons, 168 7-or-more-persons
Size of nonfamily households: 2,311 1-person, 444 2-persons, 31 4-persons
3,224 married couples with children.
1,068 single-parent households (195 men, 873 women).
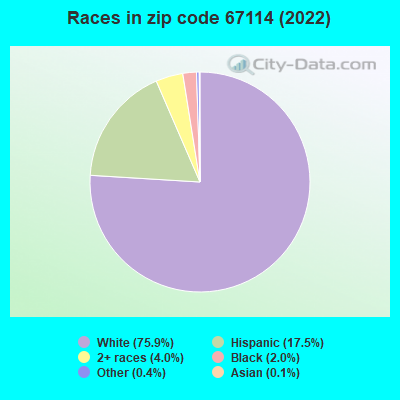
92.9% of residents of 67114 zip code speak English at home.
6.3% of residents speak Spanish at home (71% very well, 13% well, 11% not well, 6% not at all).
1.1% of residents speak other Indo-European language at home (90% very well, 10% well).
0.1% of residents speak Asian or Pacific Island language at home (100% very well).
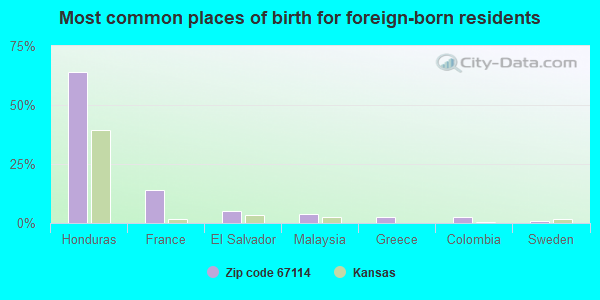
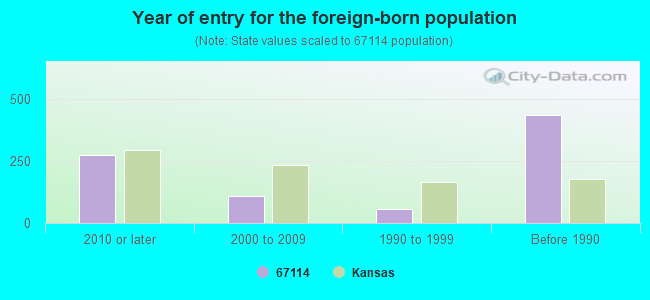
Foreign born population: 719 (3.4%) (57.5% of them are naturalized citizens)
Major facilities with environmental interests located in this zip code:
BUILDERS CONCRETE & SUPPLY INC (505 W 1ST ST in NEWTON, KS)
AIR MINOR (AIRS/AFS) AIR SYNTHETIC MINOR (AIRS/AFS) STATE MASTER (Kansas Facility Profiler) - TANKS-04651, UNDERGROUND STORAGE TANK PROGRAM, WWT-I-NE35-PR01, WASTEWATER FACILITY STATE MASTER (Kansas Facility Profiler) - ISTEPS-07900017, AIR PROGRAM, RTK-HV00174, EPCRA, WWT-I-LA13-NO06, WASTEWATER FACILITY Business SIC classification: READY-MIXED CONCRETE; LUMBER AND OTHER BUILDING MATERIALS DEALERS Alternative names: BUILDERS CON.(MERGED INTO 0790017), BUILDERS CONCRETE & SUPPLY, INC.
ACH FOAM TECHNOLOGIES (1418 COW PALACE ROAD in NEWTON, KS)
AIR SYNTHETIC MINOR (AIRS/AFS) - ICIS-, ENFORCEMENT/COMPLIANCE ACTIVITY STATE MASTER (Kansas Facility Profiler) - ISTEPS-07900054, AIR MINOR, RTK-HV00214, EPCRA, WWT-I-LA13-NO09, WASTEWATER FACILITY CRITERIA AND HAZARDOUS AIR POLLUTANT INVENTORY (Inventory of air pollution sources) National Pollutant Discharge Elimination System NON-MAJOR (Tracking pollutant discharge elimination systems) - permit Business SIC classification: UNSUPPORTED PLASTICS FILM AND SHEET; PLASTICS FOAM PRODUCTS; MANUFACTURING INDUSTRIES Business NAICS classification: UNLAMINATED PLASTICS FILM AND SHEET (EXCEPT PACKAGING) MANUFACTURING. Organizations: CONTOUR PRODUCTS INC, ACH FOAM TECNOLOGIES (CONTACT/OWNER)
Alternative names: ACH FOAM TECHNOLOGIES LLC., ACH FOAM TECNOLOGIES, CONTOUR PRODUCTS
CITY OF NEWTON (1100 SOUTH KANSAS AVENUE in NEWTON, KS)
STATE MASTER (Kansas Facility Profiler) - TANKS-28094, UNDERGROUND STORAGE TANK PROGRAM Conditionally Exempt Small Quantity Generators, less than 100 kg/month of hazardous waste (Resource Conservation and Recovery Act (tracking hazardous waste)) COMMUNITY WATER SYSTEM (SDWIS) - SDWIS-KS2007905 1T, WATER TREATMENT PLANT, SDWIS-KS2007905 2T, Business NAICS classification: GENERAL AUTOMOTIVE REPAIR. Organizations: CITY OF NEWTON, KANSAS (CONTACT/OWNER)
, NEWTON, CITY OF (OWNER/OPERATOR)
Alternative names: CITY SERVICE CENTER
USD #373 - SANTA FE MIDDLE SCH (130 W BROADWAY ST in NEWTON, KS)
(Geographic Names Information System) STATE MASTER (Kansas Facility Profiler) - TANKS-25877, UNDERGROUND STORAGE TANK PROGRAM (National Center for Education Statistics) - STATE ID-4807 Organizations: NEWTON (SCHOOL DISTRICT)
Alternative names: SANTA FE MIDDLE SCHOOL
ENGINEERED RECOVERY SYSTEMS INCORPORATED (1021 S SPENCER AVE in NEWTON, KS)
AIR MINOR (AIRS/AFS) STATE MASTER (Kansas Facility Profiler) - ISTEPS-07900051, AIR PROGRAM, TANKS-40612, UNDERGROUND STORAGE TANK PROGRAM, SOLWASTE-561, REFUSE DISPOSAL CRITERIA AND HAZARDOUS AIR POLLUTANT INVENTORY (Inventory of air pollution sources) Conditionally Exempt Small Quantity Generators, less than 100 kg/month of hazardous waste (Resource Conservation and Recovery Act (tracking hazardous waste)) Business SIC classification: REFUSE SYSTEMS Business NAICS classification: OTHER WASTE COLLECTION.; SOLID WASTE LANDFILL. Organizations: DEFFENBAUGH IND INC (CONTACT/OPERATOR)
, RONALD D DEFFENBAUGH (CONTACT/OWNER)
Alternative names: ENGINEERED RECOVERY SYS INC
BEST CLEANERS 2028 (201 WEST BROADWAY STREET in NEWTON, KS)
STATE MASTER (Kansas Facility Profiler) - ISL-C204071756, STATE CLEANUP SITE, DRYCLEAN-0175 (Resource Conservation and Recovery Act (tracking hazardous waste)) Organizations: PRIDE CLEANERS INC (CONTACT/OWNER)
, TOKE INC (CONTACT/OWNER)
, TOKE VI, LLC (CONTACT/OWNER)
, CLAUD MCLEOD FAMILY REVOCABLE TRUST (CONTACT/OWNER)
, DCI MGMT (DRY CLEANER EQUIPMENT OWNER)
Alternative names: BEST CLEANERS - 201 W BROADWAY, NEWTON, PRIDE CLEANERS DBA BEST CLEANERS 2028, PRIDE CLNRS DBA BEST CLNRS 2028
J & M AG SERVICE (1302 SOUTH KANSAS AVENUE in NEWTON, KS)
AIR MINOR (AIRS/AFS) (Integrated Compliance Information System) - ICIS-07-1998-0072, FORMAL ENFORCEMENT ACTION (Resource Conservation and Recovery Act (tracking hazardous waste)) Business SIC classification: REPAIR SHOPS AND RELATED SERVICES Organizations: JASPER EICHER (CONTACT/OPERATOR)
INDUSTRIAL SERVICE CORP. (1801 S.E. 9TH ST. in NEWTON, KS)
AIR MINOR (AIRS/AFS) STATE MASTER (Kansas Facility Profiler) - ISTEPS-07900052, AIR PROGRAM (Resource Conservation and Recovery Act (tracking hazardous waste)) Business SIC classification: SCRAP AND WASTE MATERIALS Business NAICS classification: RECYCLABLE MATERIAL WHOLESALERS. Organizations: SAFETY KLEEN SYSTEMS INC (CONTACT/OWNER)
APAC KANSAS INCORPORATED (911 SOUTHWEST 14TH STREET in NEWTON, KS)
AIR SYNTHETIC MINOR (AIRS/AFS) AIR MINOR (AIRS/AFS) STATE MASTER (Kansas Facility Profiler) - WWT-I-LA13-NO08, WASTEWATER FACILITY, RTK-HV00202, EPCRA, TANKS-04335, UNDERGROUND STORAGE TANK PROGRAM, ISTEPS-07900041, AIR PROGRAM, TANKS-41161, UNDERGROUND STORAGE TANK PROGRAM Business SIC classification: HIGHWAY AND STREET CONSTRUCTION, EXCEPT ELEVATED HIGHWAYS; ASPHALT PAVING MIXTURES AND BLOCKS Business NAICS classification: ASPHALT PAVING MIXTURE AND BLOCK MANUFACTURING. Organizations: APAC-KS SHEARS DIVISION (OWNER/OPERATOR)
, APAC KANSAS INC-SHEARS DIVISION (RTK PARENT ORGANIZATION)
Alternative names: APAC KANSAS SHEARS DIVISION, SHEARS CONSTRUCTION L P NUMBER 915
CASEY S GENERAL STORE - #1897 (1815 WEST 1ST STREET in NEWTON, KS)
STATE MASTER (Kansas Facility Profiler) - TANKS-29921, UNDERGROUND STORAGE TANK PROGRAM (Resource Conservation and Recovery Act (tracking hazardous waste)) Organizations: CASEYS GENERAL STORES INC (CONTACT/OPERATOR)
, CASEY S RETAIL COMPANY (OWNER/OPERATOR)
Alternative names: CASEYS GENERAL STORE
KMART #S1B6566 (1801 W 1ST in NEWTON, KS)
STATE MASTER (Kansas Facility Profiler) - TANKS-26441, UNDERGROUND STORAGE TANK PROGRAM (Resource Conservation and Recovery Act (tracking hazardous waste)) Organizations: K MART CORPORATION (CONTACT/OWNER)
, K-MART CORPORATION (OWNER/OPERATOR)
Alternative names: KMART #9517
KANSAS CHRISTIAN HOME, INC. (1035 SE 3RD in NEWTON, KS)
STATE MASTER (Kansas Facility Profiler) - TANKS-07438, UNDERGROUND STORAGE TANK PROGRAM (Resource Conservation and Recovery Act (tracking hazardous waste)) Organizations: KANSAS CHRISTIAN HOME INC (CONTACT/OWNER)
APAC KANSAS INC SHEARS ASPHALT PLANT 412 (1335 SOUTHWEST 14TH STREET in NEWTON, KS)
National Pollutant Discharge Elimination System NON-MAJOR (Tracking pollutant discharge elimination systems) - permit (Resource Conservation and Recovery Act (tracking hazardous waste)) TRI REPORTER (Tracking of toxic chemicals releasing facilities) Business SIC classification: ASPHALT PAVING MIXTURES AND BLOCKS Organizations: APAC KANSAS INC SHEARS DIV (CONTACT/OPERATOR)
, SHEARS CONSTR L P (CONTACT/OWNER)
, APAC-KANSAS, SHEARS DIV. (CONTACT/OWNER)
Alternative names: APAC-KANASAS INC. SHEARS ASPHALT PLANT 412, APAC KANSAS INCORPORATED, APAC-KANSAS INC. SHEARS DIV., APAC- KANSAS, SHEARS DIV., NEWTON PLANT_#915, SHEARS CONST L P
Housing units lacking complete plumbing facilities: 1.6% Housing units lacking complete kitchen facilities: 0.5%
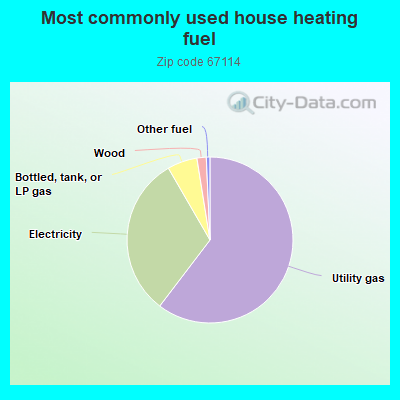
60.0%Utility gas
31.1%Electricity
5.8%Bottled, tank, or LP gas
1.8%Wood
0.7%Other fuel
Population in 1990: 20,273. Population change in the 1990s: +370 (+1.8%).
Place of birth for U.S.-born residents:
This state: 15,242
Northeast: 238
Midwest: 2,015
South: 1,437
West: 1,284
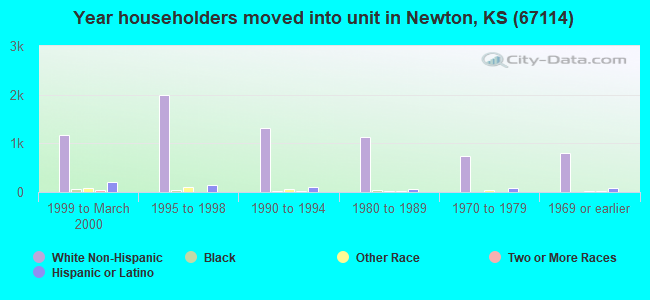
55% of the 67114 zip code residents lived in the same house 5 years ago. Out of people who lived in different houses, 51% lived in this county. Out of people who lived in different counties, 50% lived in Kansas.
88% of the 67114 zip code residents lived in the same house 1 year ago. Out of people who lived in different houses, 54% moved from this county. Out of people who lived in different houses, 27% moved from different county within same state. Out of people who lived in different houses, 18% moved from different state. Out of people who lived in different houses, 1% moved from abroad.
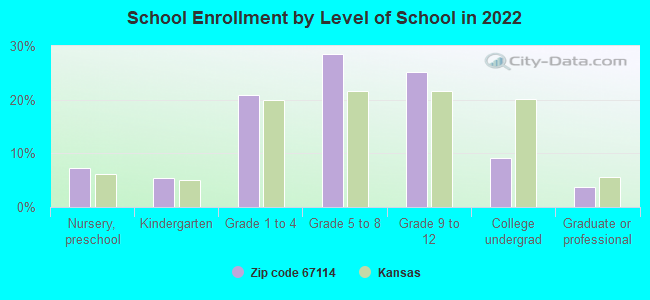
Private vs. public school enrollment:
Students in private schools in grades 1 to 8 (elementary and middle school): 530
Here:
22.2%
Kansas:
14.1%
Students in private schools in grades 9 to 12 (high school): 205
Here:
17.0%
Kansas:
10.8%
Students in private undergraduate colleges: 82
Here:
18.9%
Kansas:
15.4%
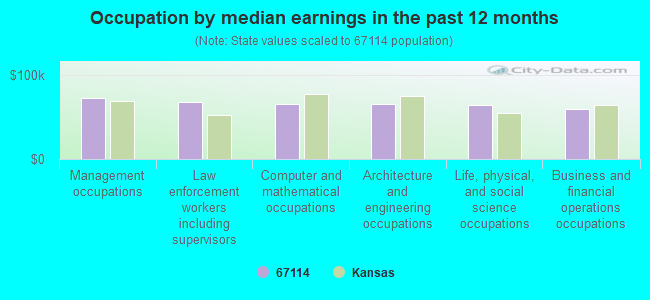
Occupation by median earnings in the past 12 months ($)
72,586Management occupations
68,400Law enforcement workers including supervisors
66,075Computer and mathematical occupations
65,182Architecture and engineering occupations
64,007Life, physical, and social science occupations
59,246Business and financial operations occupations
Companies with federal contracts located in this zip code (NEWTON, KS):
WHITEWINGCONSTRUCTION INC (1410 EAST 12TH ST; small business) : $1,759,659 in 11 contractsfrom 2000 to 2004
Contracts for Construction of Structures and Facilities -- Other Non-Building Facilities, Maintenance, Repair or Alteration of Real Property -- Miscellaneous Buildings, Maintenance, Repair or Alteration of Real Property -- Pollution Abatement and Control Facilities, Construction of Structures and Facilities -- Highways, Roads, Streets, Bridges, and Railways (includes resurfacing), and moreby Air Force, Army, Federal Highway Administration, Natural Resources Conservation Service, and others Signed by year:2000: $472,504; 2001: $182,000; 2002: $28,598; 2003: $492,800; 2004: $583,757; 2005: $0; 2006: $0.
Biggest contracts:
$583,757 with Air Force for Construction of Structures and Facilities -- Other Non-Building Facilities. Signed on 2004-09-24. Completion date: 2005-06-23.
$490,000 with Army for Maintenance, Repair or Alteration of Real Property -- Miscellaneous Buildings. Signed on 2003-03-18. Completion date: 2003-09-30.
$351,350 with Army for Maintenance, Repair or Alteration of Real Property -- Pollution Abatement and Control Facilities. Signed on 2000-07-12. Completion date: 2001-04-06.
$166,000 with Federal Highway Administration for Construction of Structures and Facilities -- Highways, Roads, Streets, Bridges, and Railways (includes resurfacing). Signed on 2001-03-15. Completion date: 2001-03-15.
BRIDGES INC. (911 SOUTHWEST 14TH STREET; small business) : $29,128 in 2 contractsin 2000
$29,128 with Army for Maintenance, Repair or Alteration of Real Property -- Highways, Roads, Streets, Bridges, and Railways (includes resurfacing). Signed on 2000-01-10. Completion date: 2000-05-31.
$0, same as above.Signed on 2000-01-10. Completion date: 2000-05-31.
BUNTING MAGNETICS CO (500 S SPENCER RD; small business)
$19,840 with Navy for Miscellaneous Items. Signed on 2005-08-22. Completion date: 2005-08-31.
WRAY ROOFING INCORPORATED (1521 NW 36TH ST; small business)
$14,220 with U.S. Army Corps of Engineers - civil program financing only for Construction of Structures and Facilities -- Office Buildings. Signed on 2000-03-10. Completion date: 2000-04-24.
FULL VISION, INC (3017 FULL VISION DR; small business)
$5,938 with Army for Athletic and Sporting Equipment. Signed on 2006-04-24. Completion date: 2006-05-15.
LESLIE GUHR (713 S E 2ND; small business)
$2,800 with Army for Installation of Equipment -- Electrical and Electronic Equipment Components. Signed on 2001-12-28. Completion date: 2002-01-02.
Top industries in this zip code by the number of employees in 2005:
Health Care and Social Assistance: Continuing Care Retirement Communities (100-249 employees: 3 establishments)
Health Care and Social Assistance: General Medical and Surgical Hospitals (250-499: 1, 1-4: 1)
Health Care and Social Assistance: Psychiatric and Substance Abuse Hospitals (250-499: 1)
2002 - 2018 National Fire Incident Reporting System (NFIRS) incidents
Based on the data from the years 2002 - 2018 the average number of fires per year is 116. The highest number of reported fires - 164 took place in 2006, and the least - 57 in 2008. The data has a dropping trend.
When looking into fire subcategories, the most incidents belonged to: Outside Fires (53.0%), and Structure Fires (24.4%).
Fire incident types reported to NFIRS in Zip Code 67114


 Nearest zip codes: 67117, 67151, 67041, 67062, 67053, 67154.


 Based on the data from the years 2002 - 2018 the average number of fires per year is 116. The highest number of reported fires - 164 took place in 2006, and the least - 57 in 2008. The data has a dropping trend.
 When looking into fire subcategories, the most incidents belonged to: Outside Fires (53.0%), and Structure Fires (24.4%).