Estimated zip code population in 2022: 605 Zip code population in 2010: 774 Zip code population in 2000: 830
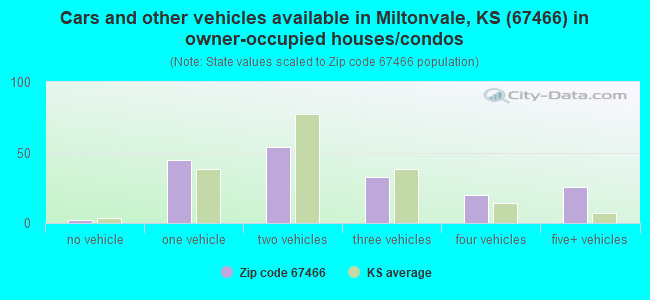
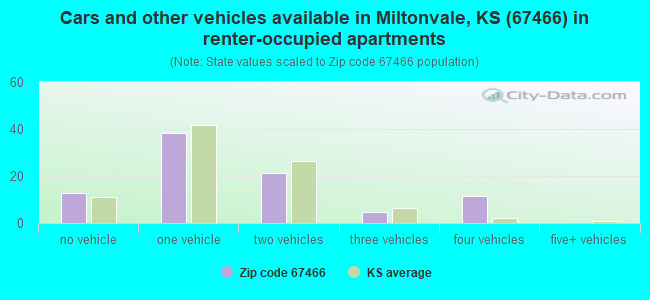
Houses and condos: 374 Renter-occupied apartments: 88
% of renters here:
33%
State:
32%
March 2022 cost of living index in zip code 67466: 78.0 (low, U.S. average is 100)
Land area: 148.6 sq. mi. Water area: 0.1 sq. mi.
Population density: 4 people per square mile
(very low).
OSM Map
General Map
Google Map
MSN Map
OSM Map
General Map
Google Map
MSN Map
OSM Map
General Map
Google Map
MSN Map
OSM Map
General Map
Google Map
MSN Map
Please wait while loading the map...
Real estate property taxes paid for housing units in 2022:
This zip code:
1.8% ($1,455)
Kansas:
1.2% ($2,578)
Median real estate property taxes paid for housing units with mortgages in 2022: $2,664 (2.6%) Median real estate property taxes paid for housing units with no mortgage in 2022: $863 (1.9%)
Business Search- 14 Million verified businesses
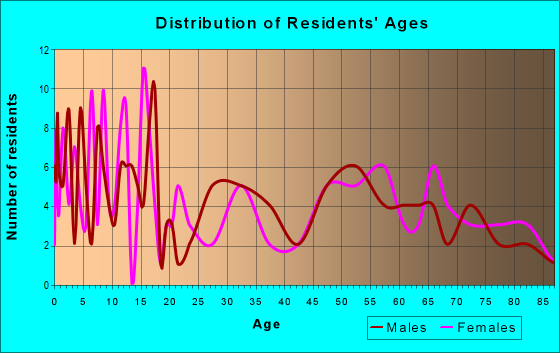
Males: 326
(54.0%)
Females: 278
(46.0%)
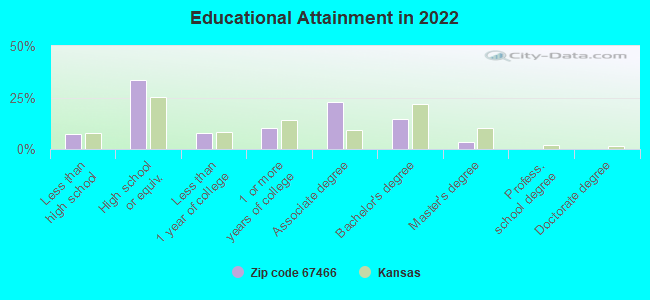
For population 25 years and over in 67466:
High school or higher: 91.7%
Bachelor's degree or higher: 18.1%
Graduate or professional degree: 3.5%
Unemployed: 3.3%
Mean travel time to work (commute): 24.4 minutes
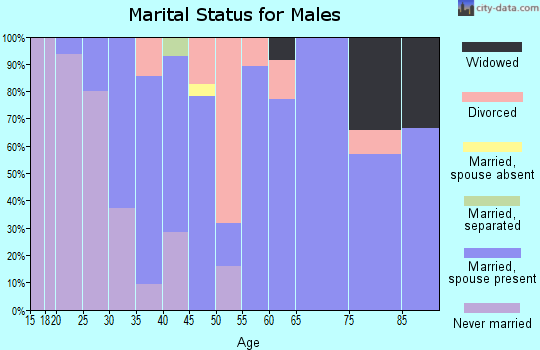
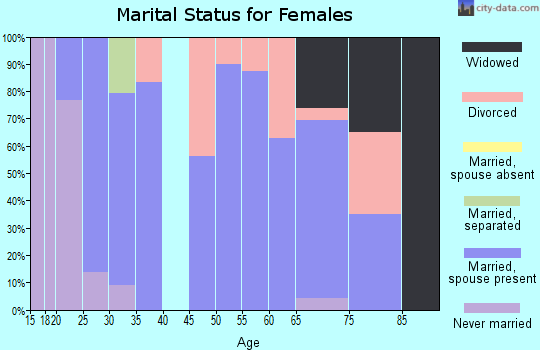
For population 15 years and over in 67466:
Never married: 28.1%
Now married: 44.8%
Separated: 0.3%
Widowed: 8.7%
Divorced: 18.0%
Zip code 67466 compared to state average:
Median house value significantly below state average.
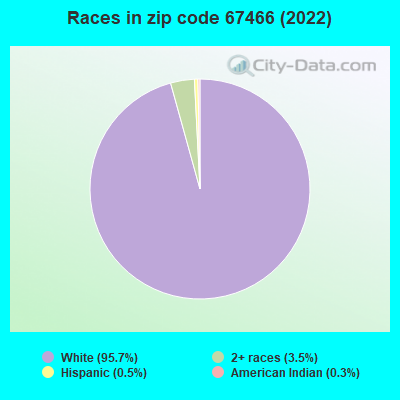
Black race population percentage significantly below state average.
Hispanic race population percentage significantly below state average.
Median age significantly above state average.
Foreign-born population percentage significantly below state average.
Length of stay since moving in significantly above state average.
House age above state average.
Percentage of population with a bachelor's degree or higher below state average.
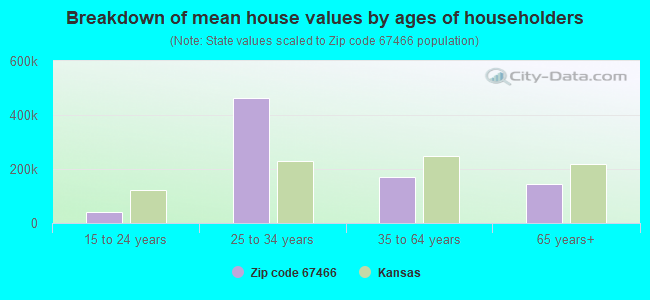
Estimated median house/condo value in 2022: $79,999
67466:
$79,999
Kansas:
$206,600
According to our research of Kansas and other state lists, there were 3 registered sex offenders living in 67466 zip code as of April 19, 2024. The ratio of all residents to sex offenders in zip code 67466 is 284 to 1. The ratio of registered sex offenders to all residents in this zip code is near the state average.
Median resident age:
This zip code:
52.3 years
Kansas median age:
37.6 years
Average household size:
This zip code:
2.3 people
Kansas:
2.4 people
Averages for the 2020 tax year for zip code 67466, filed in 2021:
Average Adjusted Gross Income (AGI) in 2020: $44,493 (Individual Income Tax Returns)
Here:
$44,493
State:
$72,721
Salary/wage: $36,523 (reported on 78.6% of returns)
Here:
$36,523
State:
$58,641
(% of AGI for various income ranges: 1075.7% for AGIs below $25k, 3778.3% for AGIs $25k-50k, 7975.0% for AGIs $50k-75k, 7290.0% for AGIs $75k-100k)
Taxable interest for individuals: $564 (reported on 39.3% of returns)
This zip code:
$564
Kansas:
$1,625
(% of AGI for various income ranges: 32.9% for AGIs below $25k, 46.7% for AGIs $25k-50k, 55.0% for AGIs $75k-100k)
Ordinary dividends: $1,560 (reported on 17.9% of returns)
Here:
$1,560
State:
$7,290
(% of AGI for various income ranges: 71.4% for AGIs below $25k, 140.0% for AGIs $50k-75k)
Net capital gain/loss in AGI: +$10,700 (reported on 14.3% of returns)
Here:
+$10,700
State:
+$20,511
(% of AGI for various income ranges: 92.9% for AGIs below $25k, 1815.0% for AGIs $50k-75k)
Profit/loss from business: +$4,650 (reported on 14.3% of returns)
Here:
+$4,650
State:
+$13,852
(% of AGI for various income ranges: 310.0% for AGIs $25k-50k)
Taxable individual retirement arrangement distribution: $12,600 (reported on 7.1% of returns)
67466:
$12,600
Kansas:
$19,921
(% of AGI for various income ranges: 360.0% for AGIs below $25k)
Earned income credit: $2,171 (reported on 25.0% of returns)
Here:
$2,171
State:
$2,267
(% of AGI for various income ranges: 127.1% for AGIs below $25k, 105.0% for AGIs $25k-50k)
Percentage of individuals using paid preparers for their 2020 taxes: 96.4%
Here:
96%
State:
95%
(% for various income ranges: 100.0% for AGIs below $25k, 87.5% for AGIs $25k-50k, 100.0% for AGIs $50k-75k, 100.0% for AGIs $75k-100k, 100.0% for AGIs $100k-200k)
Averages for the 2012 tax year for zip code 67466, filed in 2013:
Average Adjusted Gross Income (AGI) in 2012: $35,600 (Individual Income Tax Returns)
Here:
$35,600
State:
$60,095
Salary/wage: $32,228 (reported on 75.8% of returns)
Here:
$32,228
State:
$48,770
(% of AGI for various income ranges: 61.4% for AGIs below $25k, 77.1% for AGIs $25k-50k, 75.4% for AGIs $50k-75k, 59.0% for AGIs $75k-100k)
Taxable interest for individuals: $1,006 (reported on 48.5% of returns)
This zip code:
$1,006
Kansas:
$1,506
(% of AGI for various income ranges: 4.9% for AGIs below $25k, 0.9% for AGIs $25k-50k, 0.6% for AGIs $50k-75k, 0.8% for AGIs $75k-100k)
Ordinary dividends: $940 (reported on 15.2% of returns)
Here:
$940
State:
$6,093
Net capital gain/loss in AGI: +$9,200 (reported on 21.2% of returns)
Here:
+$9,200
State:
+$14,598
Profit/loss from business: +$5,200 (reported on 12.1% of returns)
Here:
+$5,200
State:
+$12,554
Taxable individual retirement arrangement distribution: $6,767 (reported on 9.1% of returns)
67466:
$6,767
Kansas:
$14,098
Total itemized deductions: $15,600 (20% of AGI, reported on 12.1% of returns)
Here:
$15,600
State:
$23,678
Here:
19.8% of AGI
State:
18.9% of AGI
Charity contributions: $2,500 (reported on 6.1% of returns)
Here:
$2,500
State:
$5,321
Taxes paid: $5,450 (reported on 12.1% of returns)
67466:
$5,450
State:
$9,548
Earned income credit: $2,013 (reported on 24.2% of returns)
Here:
$2,013
State:
$2,212
(% of AGI for various income ranges: 5.7% for AGIs below $25k, 1.9% for AGIs $25k-50k)
Percentage of individuals using paid preparers for their 2012 taxes: 66.7%
Here:
67%
State:
56%
(% for various income ranges: 64.3% for AGIs below $25k, 63.6% for AGIs $25k-50k, 75.0% for AGIs $50k-75k, 75.0% for AGIs $75k-100k)
Averages for the 2004 tax year for zip code 67466, filed in 2005:
Average Adjusted Gross Income (AGI) in 2004: $24,763 (Individual Income Tax Returns)
Here:
$24,763
State:
$45,726
Salary/wage: $23,322 (reported on 71.6% of returns)
Here:
$23,322
State:
$40,112
(% of AGI for various income ranges: 96.5% for AGIs below $10k, 56.2% for AGIs $10k-25k, 73.0% for AGIs $25k-50k, 66.7% for AGIs $50k-75k)
Taxable interest for individuals: $1,453 (reported on 53.6% of returns)
This zip code:
$1,453
Kansas:
$1,749
(% of AGI for various income ranges: 8.9% for AGIs below $10k, 6.6% for AGIs $10k-25k, 3.7% for AGIs $25k-50k, 0.3% for AGIs $50k-75k)
Taxable dividends: $565 (reported on 19.6% of returns)
Here:
$565
State:
$3,066
(% of AGI for various income ranges: 1.8% for AGIs below $10k, 0.6% for AGIs $10k-25k, 0.2% for AGIs $25k-50k, 0.4% for AGIs $50k-75k)
Net capital gain/loss: +$2,257 (reported on 23.3% of returns)
Here:
+$2,257
State:
+$7,555
(% of AGI for various income ranges: 0.4% for AGIs below $10k, 3.7% for AGIs $10k-25k, 3.5% for AGIs $25k-50k, 0.3% for AGIs $50k-75k)
Profit/loss from business: +$6,245 (reported on 15.5% of returns)
Here:
+$6,245
State:
+$9,571
Profit/loss from farming: +$1,391 (reported on 21.8% of returns)
Here:
+$1,391
State:
-$2,650
(% of AGI for various income ranges: -46.8% for AGIs below $10k, 5.7% for AGIs $10k-25k, 5.4% for AGIs $25k-50k, -0.3% for AGIs $50k-75k)
Total itemized deductions: $15,452 (32% of AGI, reported on 9.8% of returns)
Here:
$15,452
State:
$18,779
Here:
32.0% of AGI
State:
20.5% of AGI
Charity contributions deductions: $2,292 (5% of AGI, reported on 7.6% of returns)
Here:
$2,292
State:
$3,892
Here:
4.8% of AGI
State:
4.0% of AGI
Total tax: $2,810 (reported on 64.7% of returns)
67466:
$2,810
State:
$7,203
(% of AGI for various income ranges: 3.9% for AGIs below $10k, 4.6% for AGIs $10k-25k, 6.6% for AGIs $25k-50k, 9.7% for AGIs $50k-75k)
Earned income credit: $1,764 (reported on 17.4% of returns)
Here:
$1,764
State:
$1,674
Percentage of individuals using paid preparers for their 2004 taxes: 76.7%
Here:
77%
State:
63%
(% for various income ranges: 72.5% for AGIs below $10k, 81.5% for AGIs $10k-25k, 80.3% for AGIs $25k-50k, 68.1% for AGIs $50k-75k)
Household received Food Stamps/SNAP in the past 12 months: 11 Household did not receive Food Stamps/SNAP in the past 12 months: 255
Women who had a birth in the past 12 months: 5 (0 now married, 5 unmarried) Women who did not have a birth in the past 12 months: 80 (38 now married, 41 unmarried)
Housing units in zip code 67466 with a mortgage: 54 Median monthly owner costs for units with a mortgage: $1,488 Median monthly owner costs for units without a mortgage: $397
Residents with income below the poverty level in 2022:
This zip code:
22.4%
Whole state:
12.0%
Residents with income below 50% of the poverty level in 2022:
This zip code:
14.8%
Whole state:
6.4%
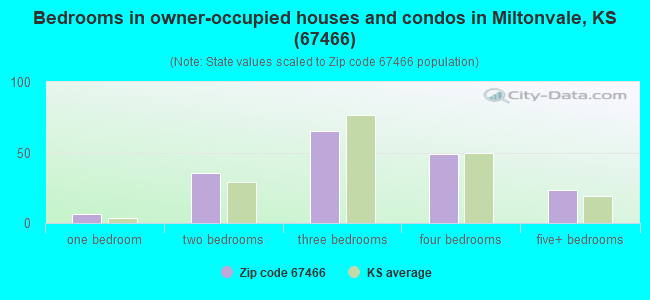
Median number of rooms in houses and condos:
Here:
7.1
State:
6.9
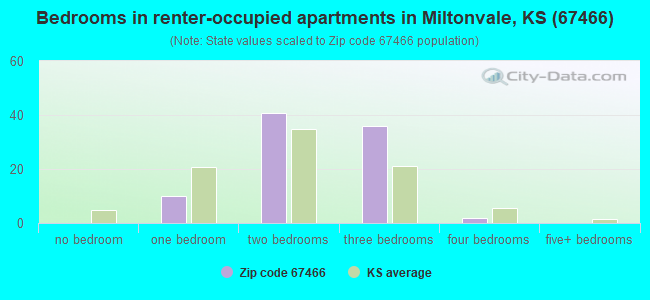
Median number of rooms in apartments:
Here:
5.6
State:
4.4
Notable locations in this zip code not listed on our city pages
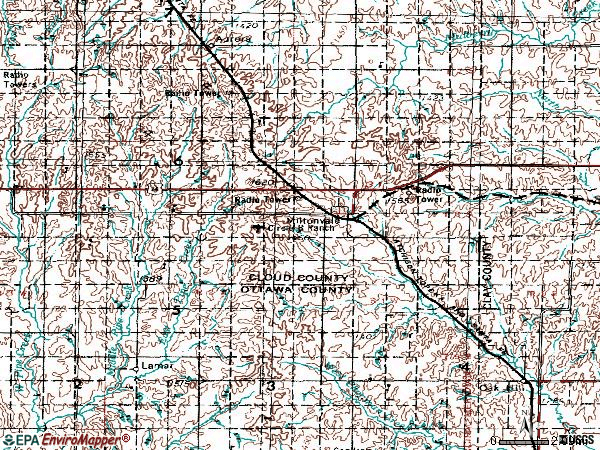
Notable locations in zip code 67466: Miltonvale Sewer Treatment Plant (A), Agmark Grain Elevator Number 14 (B), Miltonvale City Fire Department (C), Miltonvale Rural Fire Department Station 1 (D), Miltonvale Ambulance Service (E), Miltonvale City Hall (F). Display/hide their locations on the map
Churches in zip code 67466 include: Bible Methodist Church (A), Sulphur Springs Church (B), Meredith Church (C), Miltonvale United Methodist Church (D), Miltonvale Christian Church (E), Saint Anthony Catholic Church (F), Miltonvale Wesleyan Church (G), First Presbyterian Church (H). Display/hide their locations on the map
Size of family households: 82 2-persons, 32 3-persons, 6 4-persons, 7 5-persons, 16 6-persons, 2 7-or-more-persons
Size of nonfamily households: 89 1-person, 20 2-persons, 13 3-persons
80 married couples with children.
19 single-parent households (10 men, 9 women).
All residents speak English at home
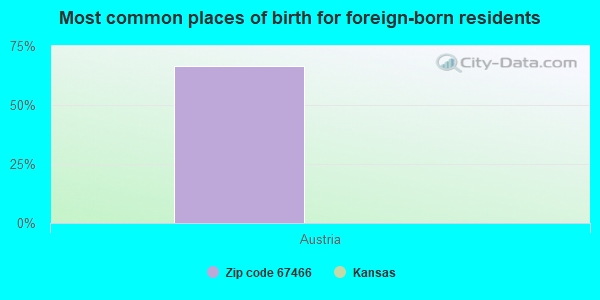
Foreign born population: 2 (0.5%) (100.0% of them are naturalized citizens)
This zip code:
0.5%
Whole state:
7.1%
67%Austria
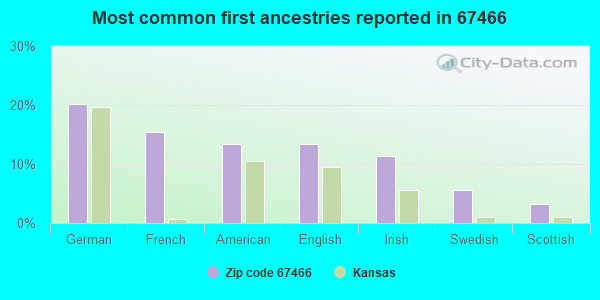
20%German
15%French
13%American
13%English
11%Irish
6%Swedish
3%Scottish
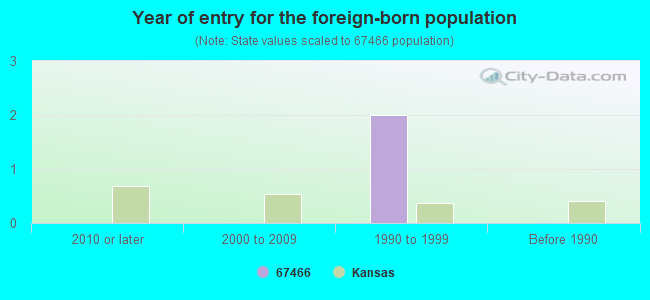
Year of entry for the foreign-born population
02010 or later
02000 to 2009
21990 to 1999
0Before 1990
Facilities with environmental interests located in this zip code:
ENRON LIQUIDS PIPELINE CO. (1 MI. NORTH & I MI. WEST in MILTONVALE, KS)
AIR MINOR (AIRS/AFS) STATE MASTER (Kansas Facility Profiler) - ISTEPS-02900002, AIR PROGRAM CRITERIA AND HAZARDOUS AIR POLLUTANT INVENTORY (Inventory of air pollution sources) Business SIC classification: NATURAL GAS TRANSMISSION Business NAICS classification: PIPELINE TRANSPORTATION OF NATURAL GAS.; PIPELINE TRANSPORTATION OF NATURAL GAS.
MILTONVALE FARMERS UNION CO-OP ASSN. (S.E. EDGE OF TOWN in MILTONVALE, KS)
AIR MINOR (AIRS/AFS) STATE MASTER (Kansas Facility Profiler) - ISTEPS-02900020, AIR PROGRAM Business SIC classification: GRAIN AND FIELD BEANS Business NAICS classification: GRAIN AND FIELD BEAN WHOLESALERS.
MILTONVALE ELEM (BOX 394 in MILTONVALE, KS)
(National Center for Education Statistics) - STATE ID-3836 Organizations: SOUTHERN CLOUD (SCHOOL DISTRICT)
MILTONVALE HIGH (619 TOOTLE in MILTONVALE, KS)
(National Center for Education Statistics) - STATE ID-3838 Organizations: SOUTHERN CLOUD (SCHOOL DISTRICT)
MILTONVALE SEWER TREATMENT PLANT C/O CITY HALL (107 STARR in MILTONVALE, KS)
National Pollutant Discharge Elimination System NON-MAJOR (Tracking pollutant discharge elimination systems) - permit Business SIC classification: SEWERAGE SYSTEMS Organizations: MILTONVALE, CITY OF (CONTACT/OWNER)
Alternative names: MILTONVILLE CITY OF STP
MAX & ALICE COPPLE (10 NORTH 200TH ROAD in MILTONVALE, KS)
National Pollutant Discharge Elimination System NON-MAJOR (Tracking pollutant discharge elimination systems) - permit Business SIC classification: DAIRY FARMS Alternative names: COPPLE, MAX & ALICE
Housing units lacking complete plumbing facilities: 5.0% Housing units lacking complete kitchen facilities: 7.5%
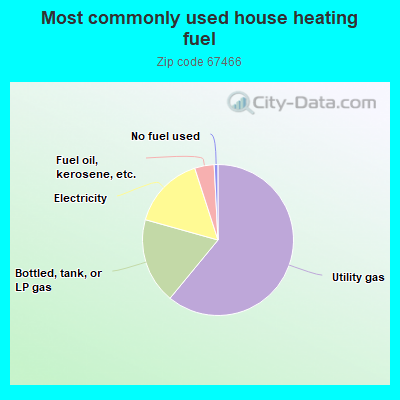
61.4%Utility gas
18.5%Bottled, tank, or LP gas
15.8%Electricity
4.2%Fuel oil, kerosene, etc.
0.8%No fuel used
Population in 1990: 677. Population change in the 1990s: +153 (+22.6%).
Place of birth for U.S.-born residents:
This state: 404
Northeast: 19
Midwest: 67
South: 29
West: 83
61% of the 67466 zip code residents lived in the same house 5 years ago. Out of people who lived in different houses, 42% lived in this county. Out of people who lived in different counties, 50% lived in Kansas.
94% of the 67466 zip code residents lived in the same house 1 year ago. Out of people who lived in different houses, 44% moved from this county. Out of people who lived in different houses, 48% moved from different county within same state. Out of people who lived in different houses, 4% moved from different state.
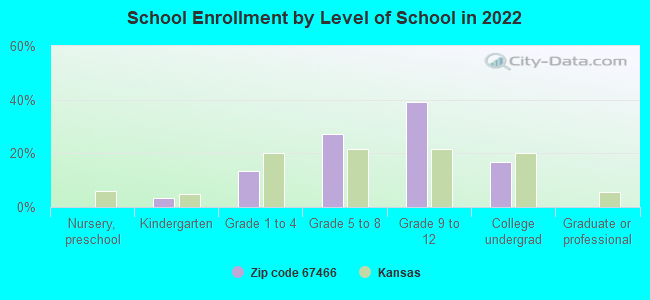
Private vs. public school enrollment:
Students in private schools in grades 1 to 8 (elementary and middle school):
Here:
0.0%
Kansas:
14.1%
Students in private schools in grades 9 to 12 (high school):
Here:
0.0%
Kansas:
10.8%
Students in private undergraduate colleges:
Here:
0.0%
Kansas:
15.4%
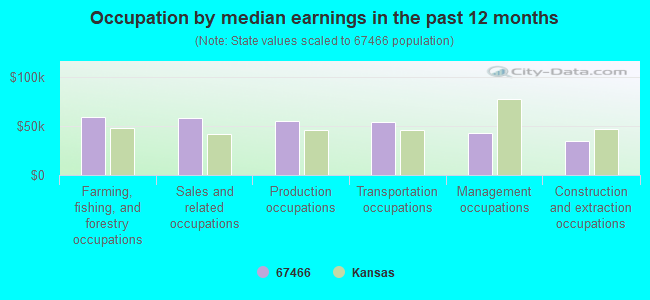
Occupation by median earnings in the past 12 months ($)
59,018Farming, fishing, and forestry occupations
58,479Sales and related occupations
55,457Production occupations
54,515Transportation occupations
43,186Management occupations
34,437Construction and extraction occupations
Top industries in this zip code by the number of employees in 2005:
Health Care and Social Assistance: Homes for the Elderly (10-19: 1)
Finance and Insurance: Commercial Banking (10-19: 1)
Accommodation and Food Services: Full-Service Restaurants (5-9: 1)
Health Care and Social Assistance: Services for the Elderly and Persons with Disabilities (5-9: 1)
Information: Newspaper Publishers (1-4: 1)
Finance and Insurance: Insurance Agencies and Brokerages (1-4: 1)
Construction: New Single-Family Housing Construction (except Operative Builders) (1-4: 1)
People in group quarters in 2000:
16 people in nursing homes
Fatal accident statistics in 2013:
Fatal accident count: 1
Vehicles involved in fatal accidents: 2
Fatal accidents caused by drunken drivers: 2
Fatalities: 1
Persons involved in fatal accidents: 4
Pedestrians involved in fatal accidents: 0
Fatal accident statistics in 2011:
Fatal accident count: 1
Vehicles involved in fatal accidents: 1
Fatal accidents caused by drunken drivers: 1
Fatalities: 1
Persons involved in fatal accidents: 1
Pedestrians involved in fatal accidents: 0
2002 - 2018 National Fire Incident Reporting System (NFIRS) incidents
According to the data from the years 2002 - 2018 the average number of fire incidents per year is 14. The highest number of fires - 28 took place in 2011, and the least - 3 in 2004. The data has an increasing trend.
When looking into fire subcategories, the most reports belonged to: Outside Fires (68.3%), and Structure Fires (14.8%).
Fire incident types reported to NFIRS in Zip Code 67466


+$1,391
-$2,650
(% of AGI for various income ranges: -46.8% for AGIs below $10k, 5.7% for AGIs $10k-25k, 5.4% for AGIs $25k-50k, -0.3% for AGIs $50k-75k)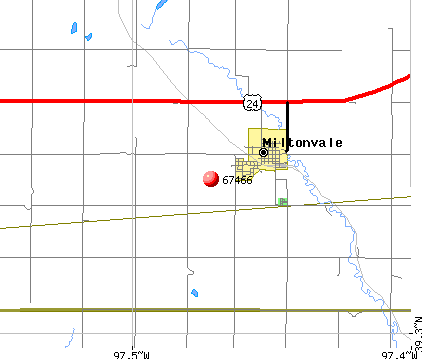 Nearest zip codes: 67417, 67458, 67468, 66938, 67436, 67432.
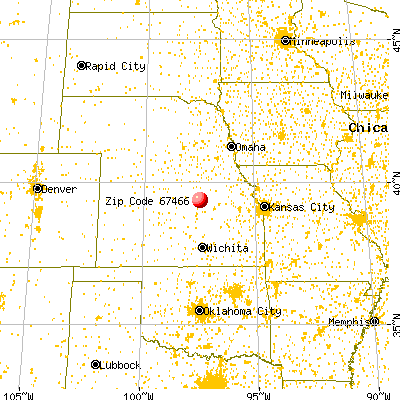
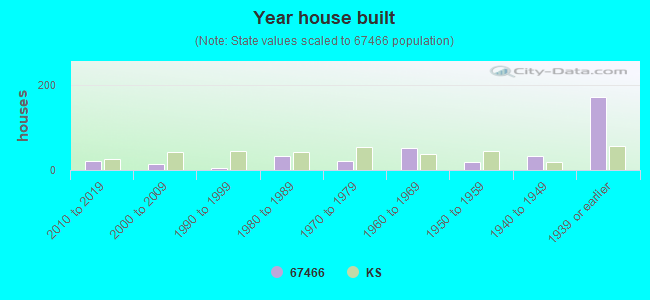


 According to the data from the years 2002 - 2018 the average number of fire incidents per year is 14. The highest number of fires - 28 took place in 2011, and the least - 3 in 2004. The data has an increasing trend.
 When looking into fire subcategories, the most reports belonged to: Outside Fires (68.3%), and Structure Fires (14.8%).