Estimated zip code population in 2022: 35,637 Zip code population in 2010: 36,228 Zip code population in 2000: 50,175
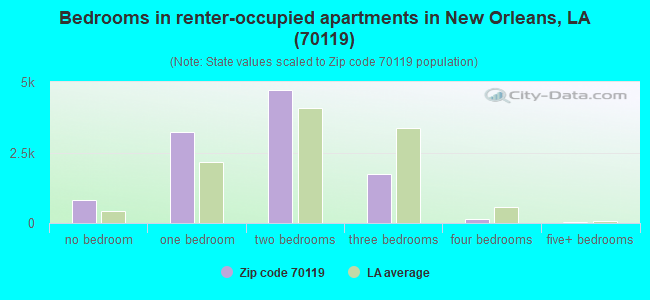
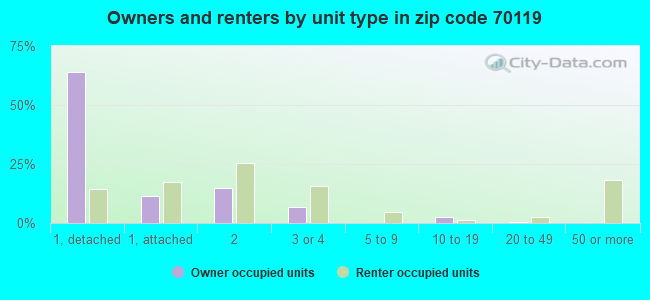
Houses and condos: 21,441 Renter-occupied apartments: 10,671
% of renters here:
62%
State:
32%
March 2022 cost of living index in zip code 70119: 99.8 (near average, U.S. average is 100)
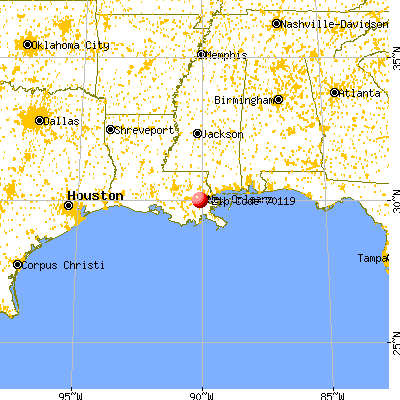
Land area: 4.5 sq. mi. Water area: 0.0 sq. mi.
Population density: 7,969 people per square mile
(high).
OSM Map
General Map
Google Map
MSN Map
OSM Map
General Map
Google Map
MSN Map
OSM Map
General Map
Google Map
MSN Map
OSM Map
General Map
Google Map
MSN Map
Please wait while loading the map...
Real estate property taxes paid for housing units in 2022:
This zip code:
0.9% ($3,065)
Louisiana:
0.5% ($1,127)
Median real estate property taxes paid for housing units with mortgages in 2022: $3,907 (0.9%) Median real estate property taxes paid for housing units with no mortgage in 2022: $1,914 (0.7%)
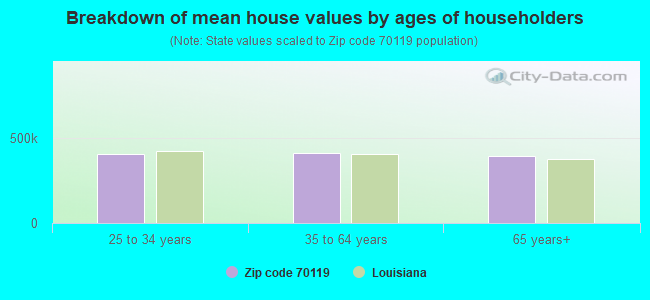
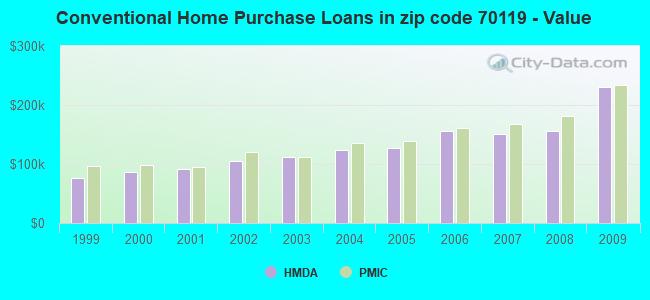
Estimated median house/condo value in 2022: $344,974
70119:
$344,974
Louisiana:
$209,200
According to our research of Louisiana and other state lists, there were 107 registered sex offenders living in 70119 zip code as of April 19, 2024. The ratio of all residents to sex offenders in zip code 70119 is 350 to 1. The ratio of registered sex offenders to all residents in this zip code is near the state average.
Median resident age:
This zip code:
38.4 years
Louisiana median age:
38.2 years
Average household size:
This zip code:
1.9 people
Louisiana:
2.5 people
Averages for the 2020 tax year for zip code 70119, filed in 2021:
Average Adjusted Gross Income (AGI) in 2020: $52,619 (Individual Income Tax Returns)
Here:
$52,619
State:
$60,757
Salary/wage: $46,281 (reported on 83.2% of returns)
Here:
$46,281
State:
$50,882
(% of AGI for various income ranges: 1092.0% for AGIs below $25k, 3669.6% for AGIs $25k-50k, 7129.9% for AGIs $50k-75k, 11326.2% for AGIs $75k-100k, 20389.2% for AGIs $100k-200k, 78817.5% for AGIs over 200k)
Taxable interest for individuals: $1,016 (reported on 21.5% of returns)
This zip code:
$1,016
Louisiana:
$1,576
(% of AGI for various income ranges: 5.1% for AGIs below $25k, 10.5% for AGIs $25k-50k, 21.7% for AGIs $50k-75k, 44.8% for AGIs $75k-100k, 96.1% for AGIs $100k-200k, 1035.6% for AGIs over 200k)
Ordinary dividends: $5,563 (reported on 15.4% of returns)
Here:
$5,563
State:
$7,743
(% of AGI for various income ranges: 16.8% for AGIs below $25k, 32.1% for AGIs $25k-50k, 85.0% for AGIs $50k-75k, 168.8% for AGIs $75k-100k, 628.2% for AGIs $100k-200k, 3348.1% for AGIs over 200k)
Net capital gain/loss in AGI: +$16,004 (reported on 14.1% of returns)
Here:
+$16,004
State:
+$16,917
(% of AGI for various income ranges: 13.8% for AGIs below $25k, 30.1% for AGIs $25k-50k, 116.3% for AGIs $50k-75k, 264.1% for AGIs $75k-100k, 777.7% for AGIs $100k-200k, 16350.6% for AGIs over 200k)
Profit/loss from business: +$9,581 (reported on 24.3% of returns)
Here:
+$9,581
State:
+$7,679
(% of AGI for various income ranges: 89.4% for AGIs below $25k, 146.6% for AGIs $25k-50k, 325.6% for AGIs $50k-75k, 437.5% for AGIs $75k-100k, 1389.8% for AGIs $100k-200k, 6945.6% for AGIs over 200k)
Taxable individual retirement arrangement distribution: $19,177 (reported on 3.8% of returns)
70119:
$19,177
Louisiana:
$20,716
(% of AGI for various income ranges: 17.3% for AGIs below $25k, 33.3% for AGIs $25k-50k, 111.5% for AGIs $50k-75k, 187.0% for AGIs $75k-100k, 443.5% for AGIs $100k-200k, 2520.6% for AGIs over 200k)
Self-employed (Keogh) retirement plans: $20,408 (reported on 0.7% of returns)
70119:
$20,408
Louisiana:
$27,459
(% of AGI for various income ranges: 7.5% for AGIs $25k-50k, 89.4% for AGIs $100k-200k, 998.1% for AGIs over 200k)
Total itemized deductions: $29,767 (reported on 6.4% of returns)
Here:
$29,767
State:
$36,265
(% of AGI for various income ranges: 29.5% for AGIs below $25k, 89.3% for AGIs $25k-50k, 222.6% for AGIs $50k-75k, 498.6% for AGIs $75k-100k, 1147.9% for AGIs $100k-200k, 7628.7% for AGIs over 200k)
Charity contributions: $8,423 (reported on 4.7% of returns)
Here:
$8,423
State:
$13,106
(% of AGI for various income ranges: 2.9% for AGIs below $25k, 17.2% for AGIs $25k-50k, 34.9% for AGIs $50k-75k, 78.9% for AGIs $75k-100k, 193.6% for AGIs $100k-200k, 2145.6% for AGIs over 200k)
Taxes paid: $7,594 (reported on 6.2% of returns)
70119:
$7,594
State:
$6,643
(% of AGI for various income ranges: 4.2% for AGIs below $25k, 13.4% for AGIs $25k-50k, 52.1% for AGIs $50k-75k, 155.5% for AGIs $75k-100k, 381.2% for AGIs $100k-200k, 1685.6% for AGIs over 200k)
Earned income credit: $2,124 (reported on 24.2% of returns)
Here:
$2,124
State:
$2,671
(% of AGI for various income ranges: 121.8% for AGIs below $25k, 55.4% for AGIs $25k-50k)
Percentage of individuals using paid preparers for their 2020 taxes: 91.6%
Here:
92%
State:
92%
(% for various income ranges: 90.1% for AGIs below $25k, 93.5% for AGIs $25k-50k, 92.8% for AGIs $50k-75k, 91.1% for AGIs $75k-100k, 91.5% for AGIs $100k-200k, 92.2% for AGIs over 200k)
Averages for the 2012 tax year for zip code 70119, filed in 2013:
Average Adjusted Gross Income (AGI) in 2012: $38,771 (Individual Income Tax Returns)
Here:
$38,771
State:
$56,730
Salary/wage: $34,484 (reported on 86.5% of returns)
Here:
$34,484
State:
$45,545
(% of AGI for various income ranges: 82.7% for AGIs below $25k, 88.5% for AGIs $25k-50k, 83.6% for AGIs $50k-75k, 82.3% for AGIs $75k-100k, 74.3% for AGIs $100k-200k, 49.4% for AGIs over 200k)
Taxable interest for individuals: $1,017 (reported on 18.7% of returns)
This zip code:
$1,017
Louisiana:
$1,804
(% of AGI for various income ranges: 0.4% for AGIs below $25k, 0.3% for AGIs $25k-50k, 0.4% for AGIs $50k-75k, 0.4% for AGIs $75k-100k, 0.6% for AGIs $100k-200k, 0.8% for AGIs over 200k)
Ordinary dividends: $6,084 (reported on 10.7% of returns)
Here:
$6,084
State:
$7,610
(% of AGI for various income ranges: 0.9% for AGIs below $25k, 0.7% for AGIs $25k-50k, 1.4% for AGIs $50k-75k, 1.3% for AGIs $75k-100k, 1.7% for AGIs $100k-200k, 4.1% for AGIs over 200k)
Net capital gain/loss in AGI: +$9,732 (reported on 7.9% of returns)
Here:
+$9,732
State:
+$17,096
(% of AGI for various income ranges: 0.3% for AGIs $25k-50k, 0.5% for AGIs $50k-75k, 0.9% for AGIs $75k-100k, 1.8% for AGIs $100k-200k, 8.1% for AGIs over 200k)
Profit/loss from business: +$10,505 (reported on 21.4% of returns)
Here:
+$10,505
State:
+$12,088
(% of AGI for various income ranges: 10.3% for AGIs below $25k, 2.8% for AGIs $25k-50k, 4.6% for AGIs $50k-75k, 4.3% for AGIs $75k-100k, 8.1% for AGIs $100k-200k, 5.0% for AGIs over 200k)
Taxable individual retirement arrangement distribution: $12,185 (reported on 3.3% of returns)
70119:
$12,185
Louisiana:
$16,085
(% of AGI for various income ranges: 0.5% for AGIs below $25k, 0.8% for AGIs $25k-50k, 1.1% for AGIs $50k-75k, 1.5% for AGIs $75k-100k, 1.5% for AGIs $100k-200k, 1.2% for AGIs over 200k)
Self-employment retirement plans: $23,012 (reported on 0.5% of returns)
70119:
$23,012
Louisiana:
$25,119
(% of AGI for various income ranges: 0.3% for AGIs $50k-75k, 0.4% for AGIs $100k-200k, 1.0% for AGIs over 200k)
Total itemized deductions: $18,661 (19% of AGI, reported on 17.2% of returns)
Here:
$18,661
State:
$23,585
Here:
19.0% of AGI
State:
18.1% of AGI
(% of AGI for various income ranges: 4.8% for AGIs below $25k, 7.1% for AGIs $25k-50k, 9.0% for AGIs $50k-75k, 10.1% for AGIs $75k-100k, 11.5% for AGIs $100k-200k, 9.0% for AGIs over 200k)
Charity contributions: $3,495 (reported on 13.0% of returns)
Here:
$3,495
State:
$5,533
(% of AGI for various income ranges: 0.4% for AGIs below $25k, 1.0% for AGIs $25k-50k, 1.2% for AGIs $50k-75k, 1.5% for AGIs $75k-100k, 1.6% for AGIs $100k-200k, 1.6% for AGIs over 200k)
Taxes paid: $5,719 (reported on 16.9% of returns)
70119:
$5,719
State:
$6,282
(% of AGI for various income ranges: 0.7% for AGIs below $25k, 1.3% for AGIs $25k-50k, 2.2% for AGIs $50k-75k, 2.8% for AGIs $75k-100k, 4.2% for AGIs $100k-200k, 4.6% for AGIs over 200k)
Earned income credit: $2,400 (reported on 33.8% of returns)
Here:
$2,400
State:
$2,633
(% of AGI for various income ranges: 10.5% for AGIs below $25k, 0.9% for AGIs $25k-50k)
Percentage of individuals using paid preparers for their 2012 taxes: 47.5%
Here:
47%
State:
57%
(% for various income ranges: 47.5% for AGIs below $25k, 41.7% for AGIs $25k-50k, 47.1% for AGIs $50k-75k, 56.5% for AGIs $75k-100k, 60.3% for AGIs $100k-200k, 84.0% for AGIs over 200k)
Averages for the 2004 tax year for zip code 70119, filed in 2005:
Average Adjusted Gross Income (AGI) in 2004: $25,477 (Individual Income Tax Returns)
Here:
$25,477
State:
$39,411
Salary/wage: $23,609 (reported on 88.7% of returns)
Here:
$23,609
State:
$34,434
(% of AGI for various income ranges: 91.0% for AGIs below $10k, 89.2% for AGIs $10k-25k, 90.6% for AGIs $25k-50k, 83.8% for AGIs $50k-75k, 83.5% for AGIs $75k-100k, 55.1% for AGIs over 100k)
Taxable interest for individuals: $1,444 (reported on 18.8% of returns)
This zip code:
$1,444
Louisiana:
$1,606
(% of AGI for various income ranges: 1.6% for AGIs below $10k, 0.6% for AGIs $10k-25k, 0.8% for AGIs $25k-50k, 1.1% for AGIs $50k-75k, 1.6% for AGIs $75k-100k, 1.8% for AGIs over 100k)
Taxable dividends: $2,701 (reported on 9.2% of returns)
Here:
$2,701
State:
$3,235
(% of AGI for various income ranges: 0.7% for AGIs below $10k, 0.4% for AGIs $10k-25k, 0.6% for AGIs $25k-50k, 1.4% for AGIs $50k-75k, 1.4% for AGIs $75k-100k, 2.0% for AGIs over 100k)
Net capital gain/loss: +$6,436 (reported on 7.0% of returns)
Here:
+$6,436
State:
+$8,531
(% of AGI for various income ranges: -0.3% for AGIs below $10k, 0.1% for AGIs $10k-25k, 0.4% for AGIs $25k-50k, 1.1% for AGIs $50k-75k, 2.5% for AGIs $75k-100k, 7.1% for AGIs over 100k)
Profit/loss from business: +$7,797 (reported on 12.8% of returns)
Here:
+$7,797
State:
+$9,128
(% of AGI for various income ranges: 9.8% for AGIs below $10k, 4.2% for AGIs $10k-25k, 1.4% for AGIs $25k-50k, 2.7% for AGIs $50k-75k, 3.7% for AGIs $75k-100k, 6.4% for AGIs over 100k)
IRA payment deduction: $2,321 (reported on 1.3% of returns)
70119:
$2,321
Louisiana:
$3,055
(% of AGI for various income ranges: 0.1% for AGIs $10k-25k, 0.2% for AGIs $25k-50k, 0.2% for AGIs $50k-75k, 0.2% for AGIs $75k-100k, 0.1% for AGIs over 100k)
Self-employed pension: $11,887 (reported on 0.4% of returns)
Here:
$11,887
Louisiana:
$17,274
(% of AGI for various income ranges: 0.0% for AGIs $10k-25k, 0.2% for AGIs $50k-75k, 0.9% for AGIs over 100k)
Total itemized deductions: $16,013 (24% of AGI, reported on 13.7% of returns)
Here:
$16,013
State:
$18,222
Here:
24.1% of AGI
State:
20.3% of AGI
(% of AGI for various income ranges: 3.0% for AGIs below $10k, 4.3% for AGIs $10k-25k, 10.2% for AGIs $25k-50k, 11.1% for AGIs $50k-75k, 12.8% for AGIs $75k-100k, 10.8% for AGIs over 100k)
Charity contributions deductions: $3,348 (5% of AGI, reported on 11.6% of returns)
Here:
$3,348
State:
$4,190
Here:
4.8% of AGI
State:
4.4% of AGI
(% of AGI for various income ranges: 0.2% for AGIs below $10k, 0.7% for AGIs $10k-25k, 1.8% for AGIs $25k-50k, 2.1% for AGIs $50k-75k, 2.2% for AGIs $75k-100k, 2.0% for AGIs over 100k)
Total tax: $4,436 (reported on 53.7% of returns)
70119:
$4,436
State:
$6,529
(% of AGI for various income ranges: 2.3% for AGIs below $10k, 2.8% for AGIs $10k-25k, 6.9% for AGIs $25k-50k, 11.1% for AGIs $50k-75k, 13.2% for AGIs $75k-100k, 22.1% for AGIs over 100k)
Earned income credit: $2,215 (reported on 47.2% of returns)
Here:
$2,215
State:
$2,103
Percentage of individuals using paid preparers for their 2004 taxes: 65.8%
Here:
66%
State:
61%
(% for various income ranges: 66.9% for AGIs below $10k, 70.4% for AGIs $10k-25k, 57.5% for AGIs $25k-50k, 55.6% for AGIs $50k-75k, 64.5% for AGIs $75k-100k, 71.4% for AGIs over 100k)
Likely homosexual households (counted as self-reported same-sex unmarried-partner households)
Lesbian couples: 0.2% of all households
Gay men: 0.4% of all households
Household received Food Stamps/SNAP in the past 12 months: 3,627 Household did not receive Food Stamps/SNAP in the past 12 months: 13,760
Women who had a birth in the past 12 months: 382 (170 now married, 214 unmarried) Women who did not have a birth in the past 12 months: 8,705 (1,908 now married, 6,844 unmarried)
Housing units in zip code 70119 with a mortgage: 3,458 (320 second mortgage, 218 both second mortgage and home equity loan) Houses without a mortgage: 20
Median monthly owner costs for units with a mortgage: $2,041 Median monthly owner costs for units without a mortgage: $644
Residents with income below the poverty level in 2022:
This zip code:
21.9%
Whole state:
18.6%
Residents with income below 50% of the poverty level in 2022:
This zip code:
11.0%
Whole state:
10.1%
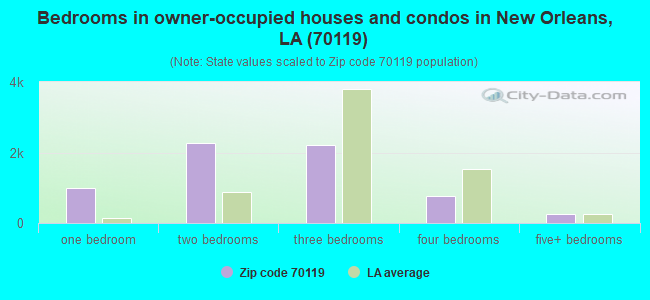
Median number of rooms in houses and condos:
Here:
5.5
State:
6.2
Median number of rooms in apartments:
Here:
4.1
State:
4.4
Notable locations in this zip code not listed on our city pages
Notable locations in zip code 70119: Maestri Market (A), Louisiana Jockey Club (B), Le Breton Market (C), Camp Nicholls (D), New Orleans Police Department - Crime Lab (E), New Orleans Police Department - Education and Training (F), New Orleans Police Department - Public Integrity Division (G), Broad Street Jail (H), Orleans Parish Community Correctional Center (I), Orleans Parish Criminal District Court - Property (J), Israel M Augustine Justice Center (K), New Orleans City Hall Annex (L), Orleans Parish Criminal District Court - Records (M), Orleans Parish Office Mid - Town Branch (N), New Orleans Police Department - Narcotics (O), Orleans Parish Criminal District Court - Judicial (P), Pitot House Museum (Q), New Orleans Regional Transit Authority (R), Edgar Degas Foundation (S), New Orleans Police Department Third District (T). Display/hide their locations on the map
Churches in zip code 70119 include: Mount Hermon Baptist Church (A), Church of God El Milagro (B), Evangelistic Baptist Church (C), Saint Rose of Lima Church (D), Redemption Nondenominational Fellowship Church (E), New Creation Spiritual Church (F), Interfaith Communications International (G), Greater New Orleans Church (H), Greater Mount Sinai Full Gospel Baptist Church (I). Display/hide their locations on the map
Cemeteries: Saint Louis Cemetery Number 3 (1), Charity Hospital Cemetery (2), Jewish Cemetery (3), Masonic Cemetery (4). Display/hide their locations on the map
Parks in zip code 70119 include: Saint Patrick Playground (1), Easton Park (2), Desmare Playground (3), Stallings Playground (4), Jefferson Davis Monument (5), Hardin Playground (6), Gayarre Place Monument (7), Dreux Monument (8), City Park (9). Display/hide their locations on the map
Tourist attractions (not listed on the city page) : Louisiana Landmarks Society (Museums; 1440 Moss Street), New Orleans Gaming & Cigarette (730 South Pierce Street).
1,992 married couples with children.
2,538 single-parent households (427 men, 2,111 women).
91.5% of residents of 70119 zip code speak English at home.
5.1% of residents speak Spanish at home (54% very well, 11% well, 13% not well, 21% not at all).
2.1% of residents speak other Indo-European language at home (81% very well, 5% well, 7% not well, 7% not at all).
0.7% of residents speak Asian or Pacific Island language at home (86% very well, 11% well, 3% not well).
0.6% of residents speak other language at home (76% very well, 3% well, 21% not well).
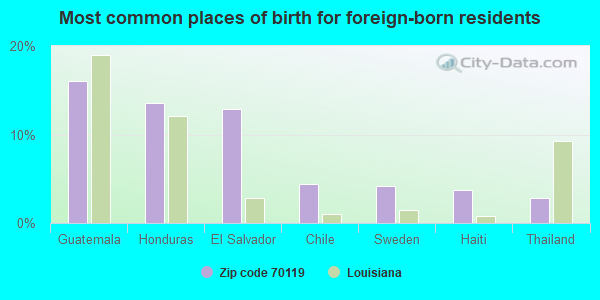
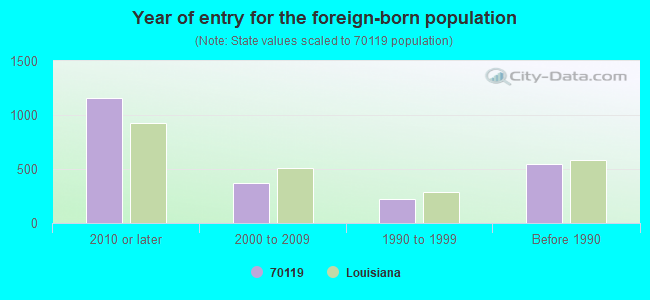
Foreign born population: 1,866 (5.2%) (36.9% of them are naturalized citizens)
Major facilities with environmental interests located in this zip code:
BELL JUNIOR HIGH SCHOOL (1010 NORTH GALVEZ STREET in NEW ORLEANS, LA)
(Geographic Names Information System) (National Center for Education Statistics) - STATE ID-036009 Organizations: ORLEANS PARISH SCHOOL BOARD (SCHOOL DISTRICT)
Alternative names: ANDREW J. BELL JUNIOR HIGH SCHOOL
A D CROSSMAN ELEMENTARY SCHOOL (4407 SOUTH CARROLLTON AVE in NEW ORLEANS, LA)
(Geographic Names Information System) (National Center for Education Statistics) - STATE ID-036027 Organizations: ORLEANS PARISH SCHOOL BOARD (SCHOOL DISTRICT)
FISK-HOWARD ELEMENTARY SCHOOL (211 SOUTH LOPEZ STREET in NEW ORLEANS, LA)
(Geographic Names Information System) (National Center for Education Statistics) - STATE ID-036041 Organizations: ORLEANS PARISH SCHOOL BOARD (SCHOOL DISTRICT)
PHILLIS WHEATLEY ELEMENTARY SCHOOL (2300 DUMAINE STREET in NEW ORLEANS, LA)
(Geographic Names Information System) (National Center for Education Statistics) - STATE ID-036125 Organizations: ORLEANS PARISH SCHOOL BOARD (SCHOOL DISTRICT)
FAIR GROUNDS INC (1751 GENTILLY BLVD in NEW ORLEANS, LA)
National Pollutant Discharge Elimination System NON-MAJOR (Tracking pollutant discharge elimination systems) - permit National Pollutant Discharge Elimination System NON-MAJOR (Tracking pollutant discharge elimination systems) - permit Conditionally Exempt Small Quantity Generators, less than 100 kg/month of hazardous waste (Resource Conservation and Recovery Act (tracking hazardous waste)) - notification Business NAICS classification: RACETRACKS. Organizations: FAIR GROUNDS CORP (CONTACT/OWNER)
Alternative names: FAIRGROUNDS
MORRIS F. X. JEFF ELEMENTARY SCHOOL (800 NORTH RENDON STREET in NEW ORLEANS, LA)
(National Center for Education Statistics) - STATE ID-036086 Organizations: ORLEANS PARISH SCHOOL BOARD (SCHOOL DISTRICT)
GEORGE O. MONDY, JR. ELEMENTARY SCHOOL (2327 SAINT PHILIP STREET in NEW ORLEANS, LA)
(National Center for Education Statistics) - STATE ID-036111 Organizations: ORLEANS PARISH SCHOOL BOARD (SCHOOL DISTRICT)
CITY OF NEW ORLEANS/ST. MAINT. (838 S. GENOIS in NEW ORLEANS, LA)
National Pollutant Discharge Elimination System NON-MAJOR (Tracking pollutant discharge elimination systems) - permit Conditionally Exempt Small Quantity Generators, less than 100 kg/month of hazardous waste (Resource Conservation and Recovery Act (tracking hazardous waste)) - notification Business NAICS classification: OTHER AUTOMOTIVE MECHANICAL AND ELECTRICAL REPAIR AND MAINTENANCE. Alternative names: EQUIPMENT MAINTENANCE
ALESSI DRY CLEANERS (4133 BIENVILLE STREET in NEW ORLEANS, LA)
AIR MINOR (AIRS/AFS) Small Quantity Generators, between 100 kg and 1000 kg of hazardous waste/month (Resource Conservation and Recovery Act (tracking hazardous waste)) - notification Business SIC classification: DRYCLEANING PLANTS, EXCEPT RUG CLEANING Organizations: JOSEPH R AUGUST (CONTACT/OWNER)
Alternative names: PHASE 1 DRY CLEANING
GRAINGER (601 S GALVEZ ST in NEW ORLEANS, LA)
Large Quantity Generators, more that 1000 kg of hazardous waste/month (Resource Conservation and Recovery Act (tracking hazardous waste)) Organizations: W W GRAINGER INC (CONTACT/OPERATOR)
ACTION TOWING & RENTAL (711 CLARK ST in NEW ORLEANS, LA)
Large Quantity Generators, more that 1000 kg of hazardous waste/month (Resource Conservation and Recovery Act (tracking hazardous waste)) - notification
ACTION TOWING & RENTAL CO (3326 TULANE AVE in NEW ORLEANS, LA)
(Resource Conservation and Recovery Act (tracking hazardous waste)) Organizations: H FORD BROWN SR AND MARTIAL H VOITIER (CONTACT/OWNER)
CENTURY GRAPHICS CORP (4422 TOULOUSE ST in NEW ORLEANS, LA)
(Resource Conservation and Recovery Act (tracking hazardous waste))
Housing units lacking complete plumbing facilities: 4.5% Housing units lacking complete kitchen facilities: 6.3%
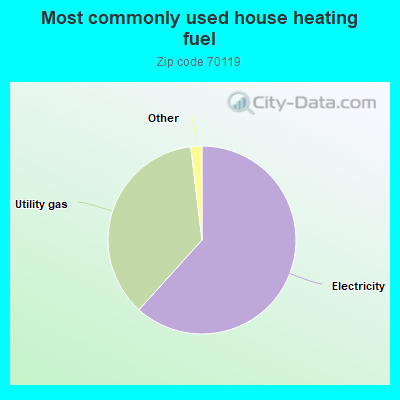
61.7%Electricity
36.4%Utility gas
0.9%Bottled, tank, or LP gas
0.6%Solar energy
Population in 1990: 47,894. Population change in the 1990s: +2,281 (+4.8%).
Place of birth for U.S.-born residents:
This state: 22,638
Northeast: 2,355
Midwest: 2,386
South: 4,409
West: 1,660
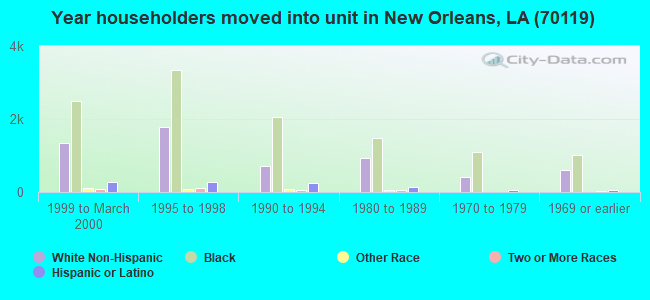
51% of the 70119 zip code residents lived in the same house 5 years ago. Out of people who lived in different houses, 61% lived in this county. Out of people who lived in different counties, 50% lived in Louisiana.
86% of the 70119 zip code residents lived in the same house 1 year ago. Out of people who lived in different houses, 56% moved from this county. Out of people who lived in different houses, 15% moved from different county within same state. Out of people who lived in different houses, 23% moved from different state. Out of people who lived in different houses, 5% moved from abroad.
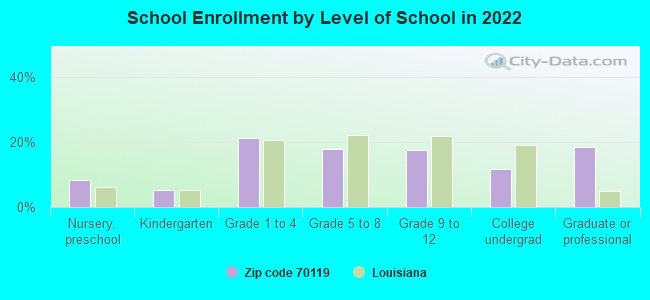
Private vs. public school enrollment:
Students in private schools in grades 1 to 8 (elementary and middle school): 529
Here:
23.5%
Louisiana:
19.6%
Students in private schools in grades 9 to 12 (high school): 211
Here:
20.8%
Louisiana:
18.3%
Students in private undergraduate colleges: 203
Here:
30.1%
Louisiana:
17.4%
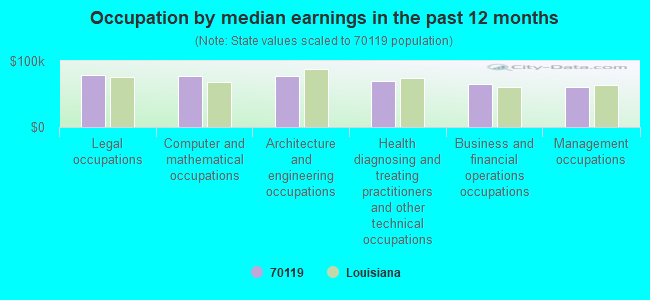
Occupation by median earnings in the past 12 months ($)
79,094Legal occupations
77,970Computer and mathematical occupations
77,682Architecture and engineering occupations
69,450Health diagnosing and treating practitioners and other technical occupations
65,614Business and financial operations occupations
60,631Management occupations
Companies with biggest federal contracts located in this zip code (NEW ORLEANS, LA):
BOH BROS CONSTRUCTION CO., LLC (730 S. TONTI ST.) : $224,702,362 in 328 contractsfrom 1999 to 2006
Contracts for Construction of Structures and Facilities -- Other Non-Building Facilities, Maintenance, Repair or Alteration of Real Property -- Other Airfield Structures, Maintenance, Repair or Alteration of Real Property -- Other Non-Building Facilities, Maintenance, Repair or Alteration of Real Property -- Sewage and Waste Facilities, and moreby Army, U.S. Army Corps of Engineers - civil program financing only, Navy Signed by year:2000: $15,893,798; 2001: $20,926,537; 2002: $5,425,285; 2003: $3,766,015; 2004: $22,623,696; 2005: $60,012,892; 2006: $93,197,050.
Biggest contracts:
$27,806,500 with Army for Construction of Structures and Facilities -- Other Non-Building Facilities. Signed on 2006-01-27. Completion date: 2006-07-14.
$15,189,862, same as above.Signed on 2005-11-14. Completion date: 2006-04-01.
$14,817,225, same as above.Signed on 2006-02-15. Completion date: 2006-09-14.
$10,000,000, same as above.Signed on 2006-04-27. Completion date: 2006-07-23.
BOH ENVIRONMENTAL, LLC (730 SOUTH TONTI STREET; small business) : $134,470,696 in 714 contractsfrom 2000 to 2006
Contracts for Prefabricated and Portable Buildings, Specialized Shipping and Storage Containers, Trailers, Laundry and Dry Cleaning Equipment, and moreby Army, Defense Logistics Agency, Navy Signed by year:2000: $38,727; 2001: $785,472; 2002: $12,003,911; 2003: $25,635,111; 2004: $47,663,252; 2005: $31,752,445; 2006: $16,591,778.
Biggest contracts:
$9,634,000 with Army for Prefabricated and Portable Buildings. Signed on 2003-09-30. Completion date: 2003-09-30.
$4,703,432 with Defense Logistics Agency for Specialized Shipping and Storage Containers. Signed on 2004-07-26. Completion date: 2004-09-24.
$3,798,825 with Army for Specialized Shipping and Storage Containers. Taking place in TX. Signed on 2004-09-27. Completion date: 2005-01-27.
$3,747,733 with Army for Specialized Shipping and Storage Containers. Signed on 2005-09-01. Completion date: 2004-11-10.
NOLA COMPUTER SERVICES INC (3535 CANAL ST; small business) : $25,092,307 in 86 contractsfrom 1999 to 2006
Contracts for ADP Data Entry Services, ADP Facility Operation and Maintenance Services, Other Professional Services, Maintenance, Repair and Rebuilding of Equipment -- Automatic Data Processing Equipment (Including Firmware), Software, Supplies and Support Equipment, and moreby Office of Operations (disused code), ENERGY, Department of, Department of State, Assistant Secretary for Administration, and others Signed by year:2000: $3,793,410; 2001: $2,571,202; 2002: $8,626,089; 2003: $1,610,335; 2004: $2,194,267; 2005: $3,070,662; 2006: $1,670,143.
Biggest contracts:
$1,923,000 with Office of Operations (disused code) for ADP Data Entry Services. Signed on 2000-12-15. Completion date: 2002-03-15.
$1,679,915 with ENERGY, Department of for ADP Facility Operation and Maintenance Services. Signed on 2004-01-30. Completion date: 2004-11-01.
$1,636,702, same as above.Signed on 2005-02-28. Completion date: 2005-11-01.
$1,395,000, same as above.Signed on 2002-09-15. Completion date: 2003-10-15.
CRESCENT GUARDIAN INC (4640 S CARROLLTON AVE) : $7,526,150 in 66 contractsfrom 1999 to 2005
Contracts for Other Natural Resources and Conservation Services, Guard Services by U.S. Army Corps of Engineers - civil program financing only, Army, United States Coast Guard (disused code: now 7008), U.S. Coast Guard, and others Signed by year:2000: $1,167,967; 2001: $997,893; 2002: $1,403,852; 2003: $3,209,135; 2004: $641,647; 2005: $2,656; 2006: $0.
Biggest contracts:
$1,180,412 with U.S. Army Corps of Engineers - civil program financing only for Other Natural Resources and Conservation Services. Signed on 2002-01-02. Completion date: 2002-01-01.
$796,751 with Army for Guard Services. Signed on 2003-11-25. Completion date: 2003-09-30.
$786,893 with U.S. Army Corps of Engineers - civil program financing only for Other Natural Resources and Conservation Services. Signed on 2001-03-07. Completion date: 2002-01-01.
$757,970, same as above.Signed on 2000-05-01. Completion date: 2002-01-01.
BEECH CONSTRUCTION CO (237 TALACRISTAL DR; small business) 2 employees, $1325001 revenue. : $5,024,819 in 105 contractsfrom 1999 to 2006
Contracts for Lease or Rental of Facilities -- Office Buildings, Miscellaneous Items, Other Salvage Services, Electric Services by Public Buildings Service, SOCIAL SECURITY ADMINISTRATION Signed by year:2000: $228,000; 2001: $230,000; 2002: $566,140; 2003: $1,432,115; 2004: $285,615; 2005: $1,268,619; 2006: $957,330.
Biggest contracts:
$127,089 with Public Buildings Service for Lease or Rental of Facilities -- Office Buildings. Taking place in TX. Signed on 2003-06-15. Completion date: 2003-06-15.
$127,089, same as above.Signed on 2003-09-15. Completion date: 2003-09-15.
$92,059, same as above.Signed on 2003-09-15. Completion date: 2003-09-15.
$92,059, same as above.Signed on 2003-09-15. Completion date: 2003-09-15.
THE BLOOD CENTER (312 SOUTH GALVEZ STREET) : $1,665,773 in 16 contractsfrom 2000 to 2005
Contracts for Hematology Services, Laboratory Testing Services by Department of Veterans Affairs, Air Force Signed by year:2000: $135,761; 2001: $252,468; 2002: $548,574; 2003: $448,000; 2004: $296,900; 2005: -$15,930; 2006: $0.
Biggest contracts:
$360,000 with Department of Veterans Affairs for Hematology Services. Signed on 2003-09-15. Completion date: 2003-10-15.
$296,900 with Air Force for Laboratory Testing Services. Taking place in MS. Signed on 2004-10-01. Completion date: 2005-09-30.
$234,800, same as above.Signed on 2003-12-01. Completion date: 2004-09-30.
$202,000 with Department of Veterans Affairs for Hematology Services. Signed on 2002-09-15. Completion date: 2004-09-15.
BKI/CEEC/DEI, A JOINT VENTURE (4176 CANAL STREET) : $1,277,760 in 13 contractsfrom 2000 to 2004
Contracts for Architect - Engineer Services (including landscaping, interior layout, and designing), Other Architect and Engineering Services by U.S. Army Corps of Engineers - civil program financing only, Army Signed by year:2000: $500,000; 2001: $489,677; 2002: $140,709; 2003: $50,622; 2004: $96,752; 2005: $0; 2006: $0.
Biggest contracts:
$500,000 with U.S. Army Corps of Engineers - civil program financing only for Architect - Engineer Services (including landscaping, interior layout, and designing). Signed on 2000-12-04. Completion date: 2004-05-28.
$300,000, same as above.Signed on 2001-11-27. Completion date: 2004-05-28.
$110,000, same as above.Signed on 2001-09-18. Completion date: 2004-05-28.
$100,000 with U.S. Army Corps of Engineers - civil program financing only for Other Architect and Engineering Services. Signed on 2002-06-26. Completion date: 2004-05-28.
LAKELAND ROOFING & CONSTRUCTIO (331 N ALEXANDER ST; small business) : $1,116,012 in 35 contractsfrom 2000 to 2006
Contracts for Construction of Structures and Facilities -- Other Administrative Facilities and Service Buildings, Maintenance, Repair and Rebuilding of Equipment -- Brushes, Paints, Sealers, and Adhesives, Maintenance, Repair or Alteration of Real Property -- Office Buildings, Maintenance, Repair or Alteration of Real Property -- Maintenance Buildings, and moreby Army Signed by year:2000: $68,980; 2001: $79,943; 2002: $255,327; 2003: $184,545; 2004: $150,615; 2005: $268,002; 2006: $108,600.
Biggest contracts:
$169,981 with Army for Construction of Structures and Facilities -- Other Administrative Facilities and Service Buildings. Signed on 2005-07-15. Completion date: 2005-09-08.
$108,600 with Army for Maintenance, Repair and Rebuilding of Equipment -- Brushes, Paints, Sealers, and Adhesives. Signed on 2006-04-25. Completion date: 2006-04-17.
$92,920 with Army for Maintenance, Repair or Alteration of Real Property -- Office Buildings. Signed on 2002-09-12. Completion date: 2002-12-02.
$84,299 with Army for Construction of Structures and Facilities -- Other Administrative Facilities and Service Buildings. Signed on 2003-02-20. Completion date: 2003-03-31.
GALLO MECHANICAL CONTRACTORS I (1839 AGRICULTURE ST)
$1,100,000 with Navy for Maintenance, Repair or Alteration of Real Property -- Miscellaneous Buildings. Signed on 2000-04-20. Completion date: 1997-06-02.
INNOVATIVE STRATEGIC ADVANCED (3701 CANAL ST STE M; small business) : $551,014 in 2 contractsfrom 2003 to 2005
$546,900 with Army for ADP Input/Output and Storage Devices. Signed on 2003-09-23. Completion date: 2004-02-27.
$4,114 with Defense Logistics Agency for ADP Input/Output and Storage Devices. Signed on 2005-11-16. Completion date: 2005-12-17.
Top industries in this zip code by the number of employees in 2005:
Arts, Entertainment, and Recreation: Racetracks (500-999 employees: 1 establishment)
2002 - 2018 National Fire Incident Reporting System (NFIRS) incidents
Based on the data from the years 2002 - 2018 the average number of fire incidents per year is 164. The highest number of fire incidents - 295 took place in 2004, and the least - 0 in 2017. The data has a decreasing trend.
When looking into fire subcategories, the most incidents belonged to: Structure Fires (50.0%), and Mobile Property/Vehicle Fires (29.7%).
Fire incident types reported to NFIRS in Zip Code 70119


 Nearest zip codes: 70112, 70116, 70163, 70125, 70139, 70113.


 Based on the data from the years 2002 - 2018 the average number of fire incidents per year is 164. The highest number of fire incidents - 295 took place in 2004, and the least - 0 in 2017. The data has a decreasing trend.
 When looking into fire subcategories, the most incidents belonged to: Structure Fires (50.0%), and Mobile Property/Vehicle Fires (29.7%).