Estimated zip code population in 2022: 22,293 Zip code population in 2010: 17,113 Zip code population in 2000: 20,556
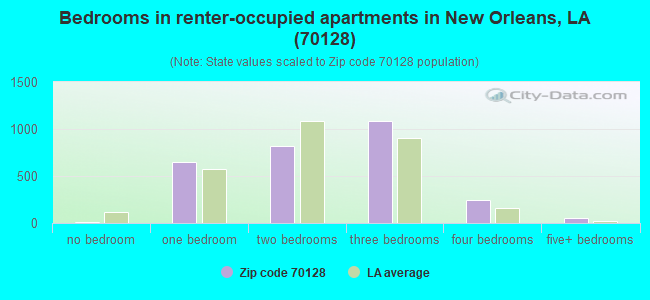
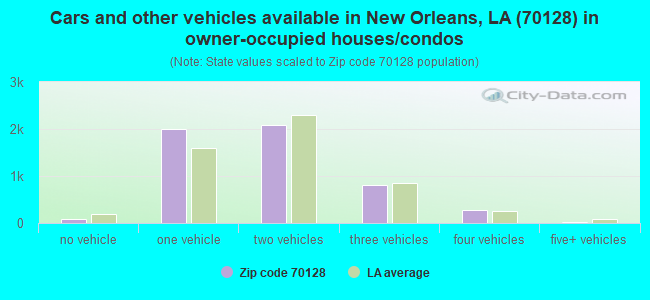
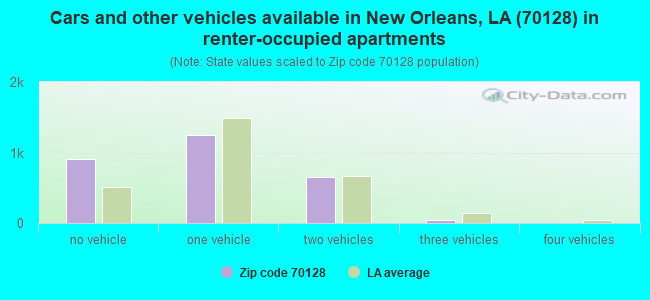
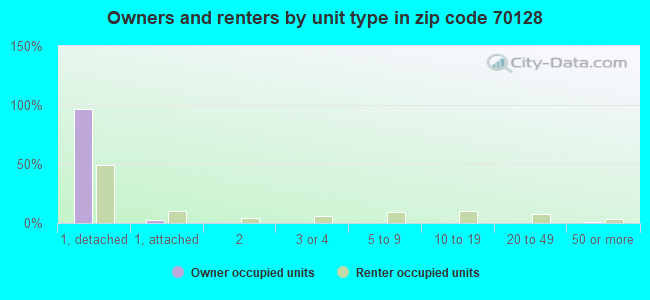
Houses and condos: 8,970 Renter-occupied apartments: 2,870
% of renters here:
35%
State:
32%
March 2022 cost of living index in zip code 70128: 96.7 (near average, U.S. average is 100)
Land area: 4.9 sq. mi. Water area: 1.2 sq. mi.
Population density: 4,574 people per square mile
(average).
OSM Map
General Map
Google Map
MSN Map
OSM Map
General Map
Google Map
MSN Map
OSM Map
General Map
Google Map
MSN Map
OSM Map
General Map
Google Map
MSN Map
Please wait while loading the map...
Real estate property taxes paid for housing units in 2022:
This zip code:
0.6% ($1,443)
Louisiana:
0.5% ($1,127)
Median real estate property taxes paid for housing units with mortgages in 2022: $1,646 (0.7%) Median real estate property taxes paid for housing units with no mortgage in 2022: $1,324 (0.6%)
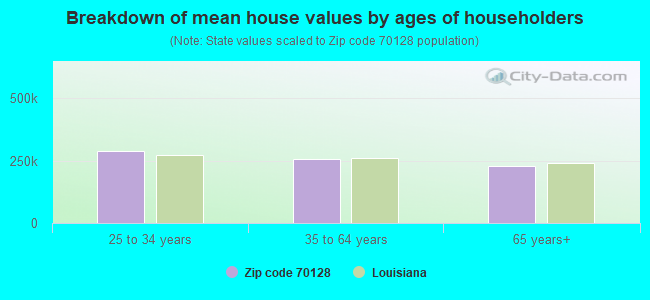
Estimated median house/condo value in 2022: $225,025
70128:
$225,025
Louisiana:
$209,200
According to our research of Louisiana and other state lists, there were 19 registered sex offenders living in 70128 zip code as of April 23, 2024. The ratio of all residents to sex offenders in zip code 70128 is 1,040 to 1. The ratio of registered sex offenders to all residents in this zip code is much lower than the state average.
Median resident age:
This zip code:
38.6 years
Louisiana median age:
38.2 years
Average household size:
This zip code:
2.7 people
Louisiana:
2.5 people
Averages for the 2020 tax year for zip code 70128, filed in 2021:
Average Adjusted Gross Income (AGI) in 2020: $42,397 (Individual Income Tax Returns)
Here:
$42,397
State:
$60,757
Salary/wage: $37,458 (reported on 82.2% of returns)
Here:
$37,458
State:
$50,882
(% of AGI for various income ranges: 1100.4% for AGIs below $25k, 3358.2% for AGIs $25k-50k, 6659.7% for AGIs $50k-75k, 10722.9% for AGIs $75k-100k, 19137.9% for AGIs $100k-200k, 67750.0% for AGIs over 200k)
Taxable interest for individuals: $561 (reported on 15.5% of returns)
This zip code:
$561
Louisiana:
$1,576
(% of AGI for various income ranges: 2.1% for AGIs below $25k, 9.6% for AGIs $25k-50k, 21.0% for AGIs $50k-75k, 23.9% for AGIs $75k-100k, 50.3% for AGIs $100k-200k, 330.0% for AGIs over 200k)
Ordinary dividends: $2,548 (reported on 6.3% of returns)
Here:
$2,548
State:
$7,743
(% of AGI for various income ranges: 1.9% for AGIs below $25k, 4.5% for AGIs $25k-50k, 24.4% for AGIs $50k-75k, 31.8% for AGIs $75k-100k, 150.0% for AGIs $100k-200k, 1610.0% for AGIs over 200k)
Net capital gain/loss in AGI: +$6,266 (reported on 5.4% of returns)
Here:
+$6,266
State:
+$16,917
(% of AGI for various income ranges: 2.0% for AGIs below $25k, 17.4% for AGIs $25k-50k, 32.7% for AGIs $50k-75k, 87.9% for AGIs $75k-100k, 316.6% for AGIs $100k-200k, 3193.3% for AGIs over 200k)
Profit/loss from business: +$1,004 (reported on 25.7% of returns)
Here:
+$1,004
State:
+$7,679
(% of AGI for various income ranges: 10.8% for AGIs below $25k, 21.0% for AGIs $50k-75k, 400.3% for AGIs $100k-200k, 6816.7% for AGIs over 200k)
Taxable individual retirement arrangement distribution: $17,039 (reported on 3.8% of returns)
70128:
$17,039
Louisiana:
$20,716
(% of AGI for various income ranges: 9.7% for AGIs below $25k, 39.7% for AGIs $25k-50k, 101.7% for AGIs $50k-75k, 305.4% for AGIs $75k-100k, 906.9% for AGIs $100k-200k)
Total itemized deductions: $31,305 (reported on 7.3% of returns)
Here:
$31,305
State:
$36,265
(% of AGI for various income ranges: 30.9% for AGIs below $25k, 176.3% for AGIs $25k-50k, 514.9% for AGIs $50k-75k, 876.1% for AGIs $75k-100k, 1898.6% for AGIs $100k-200k, 9236.7% for AGIs over 200k)
Charity contributions: $11,167 (reported on 6.3% of returns)
Here:
$11,167
State:
$13,106
(% of AGI for various income ranges: 4.7% for AGIs below $25k, 44.0% for AGIs $25k-50k, 148.2% for AGIs $50k-75k, 267.5% for AGIs $75k-100k, 624.8% for AGIs $100k-200k, 3966.7% for AGIs over 200k)
Taxes paid: $5,961 (reported on 6.8% of returns)
70128:
$5,961
State:
$6,643
(% of AGI for various income ranges: 4.8% for AGIs below $25k, 22.9% for AGIs $25k-50k, 84.1% for AGIs $50k-75k, 169.6% for AGIs $75k-100k, 414.8% for AGIs $100k-200k, 1553.3% for AGIs over 200k)
Earned income credit: $2,898 (reported on 34.8% of returns)
Here:
$2,898
State:
$2,671
(% of AGI for various income ranges: 195.0% for AGIs below $25k, 114.1% for AGIs $25k-50k)
Percentage of individuals using paid preparers for their 2020 taxes: 92.1%
Here:
92%
State:
92%
(% for various income ranges: 92.9% for AGIs below $25k, 93.3% for AGIs $25k-50k, 91.2% for AGIs $50k-75k, 89.1% for AGIs $75k-100k, 87.7% for AGIs $100k-200k, 83.3% for AGIs over 200k)
Averages for the 2012 tax year for zip code 70128, filed in 2013:
Average Adjusted Gross Income (AGI) in 2012: $38,997 (Individual Income Tax Returns)
Here:
$38,997
State:
$56,730
Salary/wage: $35,706 (reported on 86.3% of returns)
Here:
$35,706
State:
$45,545
(% of AGI for various income ranges: 82.3% for AGIs below $25k, 86.9% for AGIs $25k-50k, 82.0% for AGIs $50k-75k, 77.7% for AGIs $75k-100k, 75.8% for AGIs $100k-200k, 56.7% for AGIs over 200k)
Taxable interest for individuals: $622 (reported on 17.7% of returns)
This zip code:
$622
Louisiana:
$1,804
(% of AGI for various income ranges: 0.3% for AGIs below $25k, 0.3% for AGIs $25k-50k, 0.2% for AGIs $50k-75k, 0.2% for AGIs $75k-100k, 0.3% for AGIs $100k-200k, 0.4% for AGIs over 200k)
Ordinary dividends: $2,449 (reported on 6.7% of returns)
Here:
$2,449
State:
$7,610
(% of AGI for various income ranges: 0.2% for AGIs below $25k, 0.3% for AGIs $25k-50k, 0.1% for AGIs $50k-75k, 0.3% for AGIs $75k-100k, 0.4% for AGIs $100k-200k, 1.8% for AGIs over 200k)
Net capital gain/loss in AGI: +$2,919 (reported on 4.2% of returns)
Here:
+$2,919
State:
+$17,096
(% of AGI for various income ranges: 0.1% for AGIs $50k-75k, 0.2% for AGIs $75k-100k, 0.7% for AGIs $100k-200k, 1.1% for AGIs over 200k)
Profit/loss from business: +$6,022 (reported on 22.7% of returns)
Here:
+$6,022
State:
+$12,088
(% of AGI for various income ranges: 9.3% for AGIs below $25k, 0.3% for AGIs $25k-50k, 1.1% for AGIs $50k-75k, 1.2% for AGIs $75k-100k, 2.2% for AGIs $100k-200k, 11.4% for AGIs over 200k)
Taxable individual retirement arrangement distribution: $13,756 (reported on 3.5% of returns)
70128:
$13,756
Louisiana:
$16,085
(% of AGI for various income ranges: 0.7% for AGIs below $25k, 0.9% for AGIs $25k-50k, 1.0% for AGIs $50k-75k, 1.9% for AGIs $75k-100k, 2.5% for AGIs $100k-200k)
Self-employment retirement plans: $20,600 (reported on 0.3% of returns)
70128:
$20,600
Louisiana:
$25,119
(% of AGI for various income ranges: 0.6% for AGIs $25k-50k)
Total itemized deductions: $20,806 (27% of AGI, reported on 26.1% of returns)
Here:
$20,806
State:
$23,585
Here:
27.5% of AGI
State:
18.1% of AGI
(% of AGI for various income ranges: 7.2% for AGIs below $25k, 13.5% for AGIs $25k-50k, 16.7% for AGIs $50k-75k, 16.1% for AGIs $75k-100k, 16.2% for AGIs $100k-200k, 14.6% for AGIs over 200k)
Charity contributions: $5,449 (reported on 21.9% of returns)
Here:
$5,449
State:
$5,533
(% of AGI for various income ranges: 1.0% for AGIs below $25k, 2.7% for AGIs $25k-50k, 3.9% for AGIs $50k-75k, 3.7% for AGIs $75k-100k, 3.7% for AGIs $100k-200k, 4.0% for AGIs over 200k)
Taxes paid: $4,473 (reported on 25.8% of returns)
70128:
$4,473
State:
$6,282
(% of AGI for various income ranges: 1.1% for AGIs below $25k, 2.0% for AGIs $25k-50k, 3.2% for AGIs $50k-75k, 3.4% for AGIs $75k-100k, 4.1% for AGIs $100k-200k, 5.2% for AGIs over 200k)
Earned income credit: $2,864 (reported on 38.9% of returns)
Here:
$2,864
State:
$2,633
(% of AGI for various income ranges: 14.5% for AGIs below $25k, 1.6% for AGIs $25k-50k)
Percentage of individuals using paid preparers for their 2012 taxes: 54.7%
Here:
55%
State:
57%
(% for various income ranges: 52.8% for AGIs below $25k, 54.5% for AGIs $25k-50k, 58.8% for AGIs $50k-75k, 58.1% for AGIs $75k-100k, 56.2% for AGIs $100k-200k, 75.0% for AGIs over 200k)
Averages for the 2004 tax year for zip code 70128, filed in 2005:
Average Adjusted Gross Income (AGI) in 2004: $33,596 (Individual Income Tax Returns)
Here:
$33,596
State:
$39,411
Salary/wage: $32,523 (reported on 91.0% of returns)
Here:
$32,523
State:
$34,434
(% of AGI for various income ranges: 103.9% for AGIs below $10k, 91.2% for AGIs $10k-25k, 92.3% for AGIs $25k-50k, 87.2% for AGIs $50k-75k, 84.7% for AGIs $75k-100k, 81.3% for AGIs over 100k)
Taxable interest for individuals: $761 (reported on 22.8% of returns)
This zip code:
$761
Louisiana:
$1,606
(% of AGI for various income ranges: 1.2% for AGIs below $10k, 0.5% for AGIs $10k-25k, 0.4% for AGIs $25k-50k, 0.7% for AGIs $50k-75k, 0.2% for AGIs $75k-100k, 0.6% for AGIs over 100k)
Taxable dividends: $1,038 (reported on 8.4% of returns)
Here:
$1,038
State:
$3,235
(% of AGI for various income ranges: 0.5% for AGIs below $10k, 0.2% for AGIs $10k-25k, 0.2% for AGIs $25k-50k, 0.3% for AGIs $50k-75k, 0.3% for AGIs $75k-100k, 0.4% for AGIs over 100k)
Net capital gain/loss: +$3,032 (reported on 5.4% of returns)
Here:
+$3,032
State:
+$8,531
(% of AGI for various income ranges: -0.2% for AGIs below $10k, 0.1% for AGIs $10k-25k, -0.0% for AGIs $25k-50k, 0.7% for AGIs $50k-75k, 0.1% for AGIs $75k-100k, 1.6% for AGIs over 100k)
Profit/loss from business: +$2,569 (reported on 14.8% of returns)
Here:
+$2,569
State:
+$9,128
(% of AGI for various income ranges: 8.2% for AGIs below $10k, 2.6% for AGIs $10k-25k, -1.5% for AGIs $25k-50k, 0.9% for AGIs $50k-75k, -0.1% for AGIs $75k-100k, 3.3% for AGIs over 100k)
IRA payment deduction: $2,350 (reported on 1.4% of returns)
70128:
$2,350
Louisiana:
$3,055
(% of AGI for various income ranges: 0.1% for AGIs $10k-25k, 0.1% for AGIs $25k-50k, 0.2% for AGIs $50k-75k, 0.1% for AGIs $75k-100k)
Total itemized deductions: $18,818 (29% of AGI, reported on 32.1% of returns)
Here:
$18,818
State:
$18,222
Here:
29.4% of AGI
State:
20.3% of AGI
(% of AGI for various income ranges: 5.3% for AGIs below $10k, 7.2% for AGIs $10k-25k, 19.2% for AGIs $25k-50k, 23.2% for AGIs $50k-75k, 22.6% for AGIs $75k-100k, 18.6% for AGIs over 100k)
Charity contributions deductions: $4,875 (7% of AGI, reported on 30.0% of returns)
Here:
$4,875
State:
$4,190
Here:
7.5% of AGI
State:
4.4% of AGI
(% of AGI for various income ranges: 0.8% for AGIs below $10k, 1.4% for AGIs $10k-25k, 4.1% for AGIs $25k-50k, 5.8% for AGIs $50k-75k, 5.7% for AGIs $75k-100k, 5.2% for AGIs over 100k)
Total tax: $4,574 (reported on 59.2% of returns)
70128:
$4,574
State:
$6,529
(% of AGI for various income ranges: 2.9% for AGIs below $10k, 2.3% for AGIs $10k-25k, 5.2% for AGIs $25k-50k, 8.0% for AGIs $50k-75k, 9.4% for AGIs $75k-100k, 15.9% for AGIs over 100k)
Earned income credit: $2,265 (reported on 37.9% of returns)
Here:
$2,265
State:
$2,103
Percentage of individuals using paid preparers for their 2004 taxes: 61.0%
Here:
61%
State:
61%
(% for various income ranges: 60.3% for AGIs below $10k, 66.8% for AGIs $10k-25k, 57.9% for AGIs $25k-50k, 57.9% for AGIs $50k-75k, 56.0% for AGIs $75k-100k, 53.9% for AGIs over 100k)
Likely homosexual households (counted as self-reported same-sex unmarried-partner households)
Lesbian couples: 0.0% of all households
Gay men: 0.1% of all households
Household received Food Stamps/SNAP in the past 12 months: 1,916 Household did not receive Food Stamps/SNAP in the past 12 months: 6,293
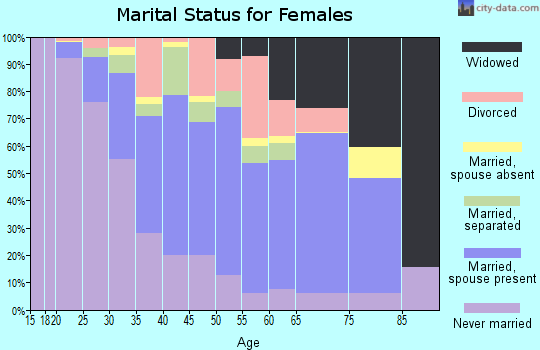
Women who had a birth in the past 12 months: 399 (17 now married, 395 unmarried) Women who did not have a birth in the past 12 months: 5,567 (1,232 now married, 4,364 unmarried)
Housing units in zip code 70128 with a mortgage: 2,831 (176 second mortgage, 14 home equity loan, 69 both second mortgage and home equity loan) Houses without a mortgage: 9
Median monthly owner costs for units with a mortgage: $1,551 Median monthly owner costs for units without a mortgage: $612
Residents with income below the poverty level in 2022:
This zip code:
24.7%
Whole state:
18.6%
Residents with income below 50% of the poverty level in 2022:
This zip code:
11.7%
Whole state:
10.1%
Median number of rooms in houses and condos:
Here:
6.9
State:
6.2
Median number of rooms in apartments:
Here:
4.8
State:
4.4
Notable locations in this zip code not listed on our city pages
Notable locations in zip code 70128: Shorewood Pumping Station (A), Briarwood Pumping Station (B), Berg Pumping Station (C), Ligget Pumping Station (D), Ferncrest Manor Living Center (E), New Orleans Fire Department Engine 10 (F), Arcadia Home (G), Bundles of Joy Preschool and Nursery (H), Louisiana Specialty Hospital Satellite Unit (I), Curran Home (J), Happy Kids Day Care Center (K), Kiddy Academy (L), Louise S Davis Developmental Center (M). Display/hide their locations on the map
Churches in zip code 70128 include: Eastern Star Missionary Baptist Church (A), Crown of Life Lutheran Church (B), Corner Stone United Methodist Church (C), New Home Full Gospel Cathedral (D), Faith Church (E). Display/hide their locations on the map
In group quarters: 103 (-1 institutionalized population)
Size of family households: 1,892 2-persons, 1,301 3-persons, 1,067 4-persons, 215 5-persons, 185 6-persons, 73 7-or-more-persons
Size of nonfamily households: 3,020 1-person, 355 2-persons, 28 5-persons
1,075 married couples with children.
2,920 single-parent households (89 men, 2,831 women).
94.4% of residents of 70128 zip code speak English at home.
0.6% of residents speak Spanish at home (71% very well, 17% well, 12% not well).
0.2% of residents speak other Indo-European language at home (64% very well, 36% well).
4.9% of residents speak Asian or Pacific Island language at home (74% very well, 13% well, 14% not well).
0.3% of residents speak other language at home (86% very well, 14% not at all).
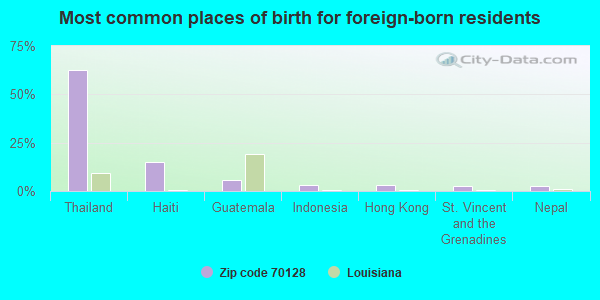
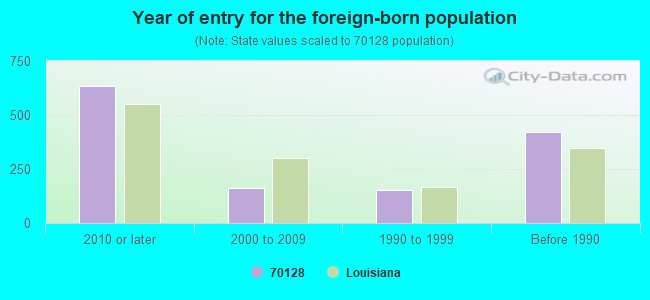
Foreign born population: 944 (4.2%) (77.2% of them are naturalized citizens)
Major facilities with environmental interests located in this zip code:
FANNIE C. WILLIAMS MIDDLE SCHOOL (11755 DWYER BOULEVARD in NEW ORLEANS, LA)
(Geographic Names Information System) (National Center for Education Statistics) - STATE ID-036138 Organizations: ORLEANS PARISH SCHOOL BOARD (SCHOOL DISTRICT)
FRANCES GAUDET ELEMENTARY SCHOOL (12000 HAYNE BOULEVARD in NEW ORLEANS, LA)
(National Center for Education Statistics) - STATE ID-036148 Organizations: ORLEANS PARISH SCHOOL BOARD (SCHOOL DISTRICT)
HINGLE CAL AUTO & TRUCK INC (11603 OLD GENTILLY RD in NEW ORLEANS, LA)
(Integrated Compliance Information System) - ICIS-06-1997-0165, FORMAL ENFORCEMENT ACTION, Business SIC classification: MOTOR VEHICLE PARTS, USED; SCRAP AND WASTE MATERIALS
GENUINE PARTS CO, ORLEANS PARISH (7030 BULLARD AVE in NEW ORLEANS, LA)
Large Quantity Generators, more that 1000 kg of hazardous waste/month (Resource Conservation and Recovery Act (tracking hazardous waste)) Organizations: STATE ST BANK (CONTACT/OWNER)
BOWMAN TRANSPORTATION (12301 OLD GENTILLY BLVD in NEW ORLEANS, LA)
(Resource Conservation and Recovery Act (tracking hazardous waste))
OMEGA OIL SERVICE INC (11681 OLD GENTILLY ROAD in NEW ORLEANS, LA)
PALACE TRUCK STOP (12170 OLD GENTILLY ROAD in NEW ORLEANS, LA)
National Pollutant Discharge Elimination System NON-MAJOR (Tracking pollutant discharge elimination systems) - permit
EXXON COMPANY 50804 (6090 BULLARD AVENUE in NEW ORLEANS, LA)
Conditionally Exempt Small Quantity Generators, less than 100 kg/month of hazardous waste (Resource Conservation and Recovery Act (tracking hazardous waste)) - notification Organizations: EXXON CO USA (CONTACT/OWNER)
, EXXONMOBIL CORP (CONTACT/OWNER)
Alternative names: EXXON CO USA 50804
ALAIN F CRACCO MD PROF MED CORP (6040 BULLARD RD STE 140 in NEW ORLEANS, LA)
Conditionally Exempt Small Quantity Generators, less than 100 kg/month of hazardous waste (Resource Conservation and Recovery Act (tracking hazardous waste)) - notification
ALS CLNRS (6003 BULLARD RD STE 1 in NEW ORLEANS, LA)
Conditionally Exempt Small Quantity Generators, less than 100 kg/month of hazardous waste (Resource Conservation and Recovery Act (tracking hazardous waste)) - notification Organizations: ALBERT FLUCKE (CONTACT/OWNER)
BRIDGE TERMINAL SERVICES (12170 OLD GENTILLY RD in NEW ORLEANS, LA)
Conditionally Exempt Small Quantity Generators, less than 100 kg/month of hazardous waste (Resource Conservation and Recovery Act (tracking hazardous waste)) - notification Organizations: ROBCO (CONTACT/OWNER)
NEW ORLEANS TRUCK & TRAVEL CNTR (12180 OLD GENTILLY RD in NEW ORLEANS, LA)
Conditionally Exempt Small Quantity Generators, less than 100 kg/month of hazardous waste (Resource Conservation and Recovery Act (tracking hazardous waste)) - notification Organizations: AMID TRAVEL PLAZA INC (CONTACT/OWNER)
ORTHOPAEDIC & SPORTS MED CLINIC (6050 BULLARD AVE STE 100 in NEW ORLEANS, LA)
Conditionally Exempt Small Quantity Generators, less than 100 kg/month of hazardous waste (Resource Conservation and Recovery Act (tracking hazardous waste)) - notification Organizations: ROBERT E RUEL JR MD APMC (CONTACT/OWNER)
Housing units lacking complete plumbing facilities: 3.1% Housing units lacking complete kitchen facilities: 2.7%
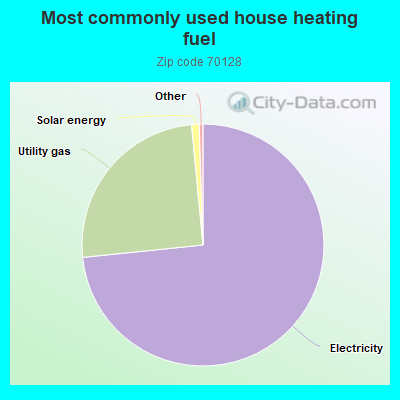
73.3%Electricity
25.1%Utility gas
1.0%Solar energy
Population in 1990: 18,844. Population change in the 1990s: +1,712 (+9.1%).
Place of birth for U.S.-born residents:
This state: 18,829
Northeast: 154
Midwest: 244
South: 1,510
West: 168
65% of the 70128 zip code residents lived in the same house 5 years ago. Out of people who lived in different houses, 85% lived in this county. Out of people who lived in different counties, 50% lived in Louisiana.
93% of the 70128 zip code residents lived in the same house 1 year ago. Out of people who lived in different houses, 73% moved from this county. Out of people who lived in different houses, 17% moved from different county within same state. Out of people who lived in different houses, 8% moved from different state. Out of people who lived in different houses, 2% moved from abroad.
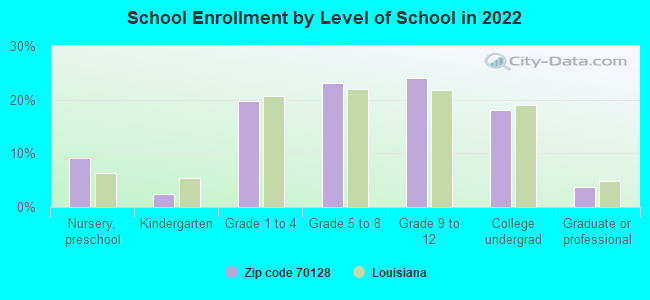
Private vs. public school enrollment:
Students in private schools in grades 1 to 8 (elementary and middle school): 283
Here:
11.4%
Louisiana:
19.6%
Students in private schools in grades 9 to 12 (high school): 209
Here:
14.9%
Louisiana:
18.3%
Students in private undergraduate colleges: 259
Here:
24.9%
Louisiana:
17.4%
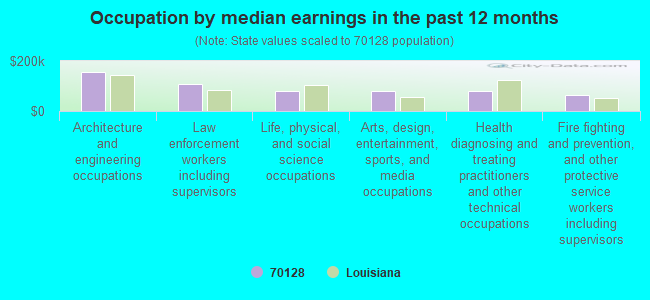
Occupation by median earnings in the past 12 months ($)
157,571Architecture and engineering occupations
106,214Law enforcement workers including supervisors
81,213Life, physical, and social science occupations
78,355Arts, design, entertainment, sports, and media occupations
78,205Health diagnosing and treating practitioners and other technical occupations
64,757Fire fighting and prevention, and other protective service workers including supervisors
Companies with federal contracts located in this zip code (NEW ORLEANS, LA):
DYKON COMPUTER HELP CENTER INC (11331 LAKE FOREST BLVD; small business) : $3,779,405 in 47 contractsfrom 2000 to 2006
Contracts for Logistics Support Services, ADP Software, ADP Support Equipment, ADP Components, and moreby Army, Office of the Chief Financial Officer, Office of Finance and Management (disused code), Assistant Secretary for Administration, and others Signed by year:2000: $99,000; 2001: $466,000; 2002: $552,940; 2003: $643,757; 2004: $762,790; 2005: $400,230; 2006: $854,688.
Biggest contracts:
$522,713 with Army for Logistics Support Services. Signed on 2006-01-11. Completion date: 2006-01-20.
$300,000 with Office of the Chief Financial Officer for ADP Software. Signed on 2004-10-01. Completion date: 2005-09-30.
$255,750 with Office of the Chief Financial Officer for ADP Support Equipment. Signed on 2005-06-09. Completion date: 2005-06-13.
$248,000 with Office of Finance and Management (disused code) for ADP Components. Signed on 2002-09-15. Completion date: 2002-09-15.
ISI PROFESSIONAL SERVICES (7921 BULLARD AV.; small business) : $857,017 in 3 contractsfrom 1999 to 2000
$406,498 with Navy for ADPE System Configuration. Taking place in DC. Signed on 2000-09-30. Completion date: 2000-12-31.
$302,925 with Navy for ADP System Acquisition Support Services. Includes preparation of statement of work, benchmarks, specifications, etc.. Taking place in DC. Signed on 1999-10-01. Completion date: 2000-09-30.
$147,594, same as above.Signed on 1999-10-01. Completion date: 2000-09-30.
GRIMBLES GRASS CUTTING AND LAN (11337 OLD SPANISH TRAIL; small business) : $695,097 in 27 contractsfrom 2000 to 2005
Contracts for Landscaping/Groundskeeping Services, Custodial Janitorial Services by Army, U.S. Army Corps of Engineers - civil program financing only Signed by year:2000: $115,078; 2001: $81,502; 2002: $250,928; 2003: $115,130; 2004: $94,095; 2005: $38,364; 2006: $0.
Biggest contracts:
$168,108 with Army for Landscaping/Groundskeeping Services. Signed on 2002-01-31. Completion date: 2003-02-28.
$80,854 with U.S. Army Corps of Engineers - civil program financing only for Landscaping/Groundskeeping Services. Signed on 2003-03-14. Completion date: 2003-04-01.
$78,120, same as above.Signed on 2002-03-12. Completion date: 2003-04-01.
$75,478, same as above.Signed on 2000-05-22. Completion date: 2003-04-01.
GRIMBLE, TORRANCE D (11337 OLD SPANISH TRAIL; small business) : $427,648 in 24 contractsfrom 2004 to 2006
Contracts for Landscaping/Groundskeeping Services by Army, U.S. Army Corps of Engineers - civil program financing only Signed by year:2000: $0; 2001: $0; 2002: $0; 2003: $0; 2004: $97,923; 2005: $254,175; 2006: $75,550.
Biggest contracts:
$89,351 with Army for Landscaping/Groundskeeping Services. Signed on 2005-12-05. Completion date: 2005-12-01.
$53,560, same as above.Signed on 2006-01-25. Completion date: 2006-09-30.
$39,000, same as above.Signed on 2005-03-11. Completion date: 2005-09-30.
$39,000 with U.S. Army Corps of Engineers - civil program financing only for Landscaping/Groundskeeping Services. Signed on 2005-03-11. Completion date: 2005-09-30.
PRIME EQUIPMENT (11580 CHEF MENTEUR HWY) : $79,960 in 4 contractsfrom 2002 to 2003
$56,160 with Army for Lease or Rental of Equipment -- Tractors. Signed on 2002-02-08. Completion date: 2002-02-08.
$10,200 with U.S. Army Corps of Engineers - civil program financing only for Lease or Rental of Equipment -- Miscellaneous. Signed on 2003-06-27. Completion date: 2003-10-07.
$6,800 with Army for Lease or Rental of Equipment -- Miscellaneous. Signed on 2003-10-14. Completion date: 2003-12-21.
$6,800 with U.S. Army Corps of Engineers - civil program financing only for Lease or Rental of Equipment -- Miscellaneous. Signed on 2003-10-14. Completion date: 2003-12-21.
KNOWLES CONSULTING INC (6003 BULLARD AVENUE 9 417) : $38,100 in 5 contractsfrom 2001 to 2004
Contracts for Psychiatry Services by U.S. Army Corps of Engineers - civil program financing only, Army Signed by year:2000: $0; 2001: $19,200; 2002: $19,200; 2003: $0; 2004: -$300; 2005: $0; 2006: $0.
Biggest contracts:
$19,200 with U.S. Army Corps of Engineers - civil program financing only for Psychiatry Services. Signed on 2002-11-21. Completion date: 2002-12-31.
$19,200, same as above.Signed on 2001-12-12. Completion date: 2002-12-31.
$0, same as above.Signed on 2001-12-12. Completion date: 2002-12-31.
-$150, same as above.Signed on 2004-10-20. Completion date: 2002-12-31.
$12,690 with Navy for Other Architect and Engineering Services. Signed on 2001-01-23. Completion date: 2001-01-31.
$0, same as above.Signed on 2001-01-23. Completion date: 2001-01-31.
CROSS, DR DOUGLAS W (4944 BULLARD AVE STE B; small business)
$10,000 with Army for Dentistry Services. Signed on 2003-11-18. Completion date: 2003-11-15.
KELLY PROPERTY INVESTMENT INC (5520 BULLET AVE; small business)
$3,375 with Public Buildings Service for Lease or Rental of Facilities -- Office Buildings. Signed on 2006-03-14. Completion date: 2007-09-13.
Top industries in this zip code by the number of employees in 2005:
2002 - 2018 National Fire Incident Reporting System (NFIRS) incidents
Based on the data from the years 2002 - 2018 the average number of fire incidents per year is 85. The highest number of fire incidents - 171 took place in 2002, and the least - 0 in 2017. The data has a decreasing trend.
When looking into fire subcategories, the most incidents belonged to: Mobile Property/Vehicle Fires (49.3%), and Structure Fires (28.2%).
Fire incident types reported to NFIRS in Zip Code 70128

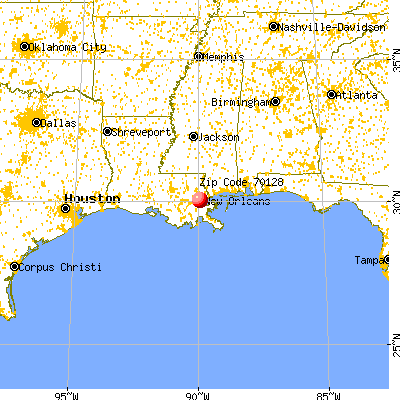


 Nearest zip codes: 70127, 70126, 70032, 70043, 70117, 70122.


 Based on the data from the years 2002 - 2018 the average number of fire incidents per year is 85. The highest number of fire incidents - 171 took place in 2002, and the least - 0 in 2017. The data has a decreasing trend.
 When looking into fire subcategories, the most incidents belonged to: Mobile Property/Vehicle Fires (49.3%), and Structure Fires (28.2%).