Estimated zip code population in 2022: 26,078 Zip code population in 2010: 24,851 Zip code population in 2000: 19,975
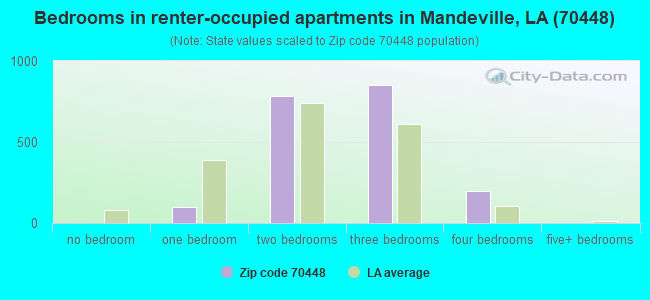
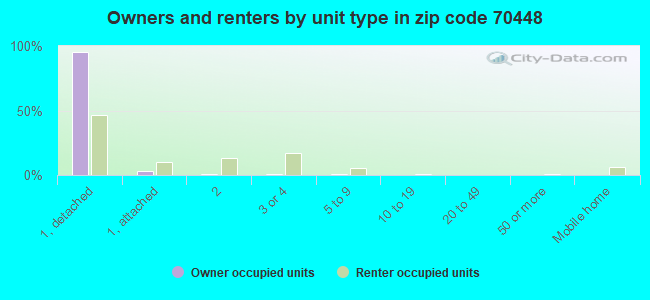
Houses and condos: 10,658 Renter-occupied apartments: 1,949
% of renters here:
19%
State:
32%
March 2022 cost of living index in zip code 70448: 97.0 (near average, U.S. average is 100)
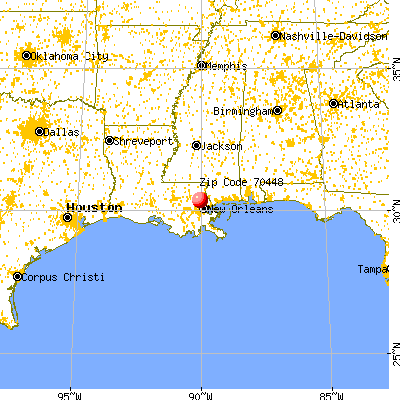
Land area: 21.9 sq. mi. Water area: 2.7 sq. mi.
Population density: 1,188 people per square mile
(low).
OSM Map
General Map
Google Map
MSN Map
OSM Map
General Map
Google Map
MSN Map
OSM Map
General Map
Google Map
MSN Map
OSM Map
General Map
Google Map
MSN Map
Please wait while loading the map...
Real estate property taxes paid for housing units in 2022:
This zip code:
0.8% ($2,469)
Louisiana:
0.5% ($1,127)
Median real estate property taxes paid for housing units with mortgages in 2022: $2,559 (0.8%) Median real estate property taxes paid for housing units with no mortgage in 2022: $2,167 (0.7%)
Estimated median house/condo value in 2022: $323,558
70448:
$323,558
Louisiana:
$209,200
According to our research of Louisiana and other state lists, there were 13 registered sex offenders living in 70448 zip code as of April 19, 2024. The ratio of all residents to sex offenders in zip code 70448 is 2,008 to 1. The ratio of registered sex offenders to all residents in this zip code is much lower than the state average.
Median resident age:
This zip code:
39.5 years
Louisiana median age:
38.2 years
Average household size:
This zip code:
2.6 people
Louisiana:
2.5 people
Averages for the 2020 tax year for zip code 70448, filed in 2021:
Average Adjusted Gross Income (AGI) in 2020: $88,528 (Individual Income Tax Returns)
Here:
$88,528
State:
$60,757
Salary/wage: $76,241 (reported on 81.2% of returns)
Here:
$76,241
State:
$50,882
(% of AGI for various income ranges: 1045.2% for AGIs below $25k, 3356.5% for AGIs $25k-50k, 6565.3% for AGIs $50k-75k, 9788.4% for AGIs $75k-100k, 18324.0% for AGIs $100k-200k, 65247.5% for AGIs over 200k)
Taxable interest for individuals: $1,513 (reported on 38.0% of returns)
This zip code:
$1,513
Louisiana:
$1,576
(% of AGI for various income ranges: 18.3% for AGIs below $25k, 33.8% for AGIs $25k-50k, 59.8% for AGIs $50k-75k, 94.0% for AGIs $75k-100k, 129.9% for AGIs $100k-200k, 695.6% for AGIs over 200k)
Ordinary dividends: $5,644 (reported on 27.7% of returns)
Here:
$5,644
State:
$7,743
(% of AGI for various income ranges: 32.8% for AGIs below $25k, 65.3% for AGIs $25k-50k, 120.9% for AGIs $50k-75k, 212.7% for AGIs $75k-100k, 347.9% for AGIs $100k-200k, 2334.4% for AGIs over 200k)
Net capital gain/loss in AGI: +$13,159 (reported on 25.4% of returns)
Here:
+$13,159
State:
+$16,917
(% of AGI for various income ranges: 8.9% for AGIs below $25k, 35.5% for AGIs $25k-50k, 106.1% for AGIs $50k-75k, 307.4% for AGIs $75k-100k, 549.2% for AGIs $100k-200k, 7355.3% for AGIs over 200k)
Profit/loss from business: +$14,761 (reported on 20.9% of returns)
Here:
+$14,761
State:
+$7,679
(% of AGI for various income ranges: 139.4% for AGIs below $25k, 161.1% for AGIs $25k-50k, 318.2% for AGIs $50k-75k, 260.8% for AGIs $75k-100k, 670.3% for AGIs $100k-200k, 4137.8% for AGIs over 200k)
Taxable individual retirement arrangement distribution: $22,818 (reported on 11.0% of returns)
70448:
$22,818
Louisiana:
$20,716
(% of AGI for various income ranges: 55.3% for AGIs below $25k, 147.3% for AGIs $25k-50k, 315.5% for AGIs $50k-75k, 513.3% for AGIs $75k-100k, 762.4% for AGIs $100k-200k, 2038.9% for AGIs over 200k)
Self-employed (Keogh) retirement plans: $20,483 (reported on 1.0% of returns)
70448:
$20,483
Louisiana:
$27,459
(% of AGI for various income ranges: 38.8% for AGIs $100k-200k, 527.5% for AGIs over 200k)
Total itemized deductions: $32,408 (reported on 9.1% of returns)
Here:
$32,408
State:
$36,265
(% of AGI for various income ranges: 37.7% for AGIs below $25k, 122.0% for AGIs $25k-50k, 272.3% for AGIs $50k-75k, 487.5% for AGIs $75k-100k, 706.3% for AGIs $100k-200k, 4126.1% for AGIs over 200k)
Charity contributions: $9,548 (reported on 7.5% of returns)
Here:
$9,548
State:
$13,106
(% of AGI for various income ranges: 1.2% for AGIs below $25k, 14.6% for AGIs $25k-50k, 34.1% for AGIs $50k-75k, 87.1% for AGIs $75k-100k, 156.1% for AGIs $100k-200k, 1316.7% for AGIs over 200k)
Taxes paid: $7,772 (reported on 9.0% of returns)
70448:
$7,772
State:
$6,643
(% of AGI for various income ranges: 5.0% for AGIs below $25k, 17.8% for AGIs $25k-50k, 56.1% for AGIs $50k-75k, 110.0% for AGIs $75k-100k, 191.7% for AGIs $100k-200k, 972.5% for AGIs over 200k)
Earned income credit: $2,173 (reported on 11.5% of returns)
Here:
$2,173
State:
$2,671
(% of AGI for various income ranges: 74.4% for AGIs below $25k, 67.6% for AGIs $25k-50k)
Percentage of individuals using paid preparers for their 2020 taxes: 91.2%
Here:
91%
State:
92%
(% for various income ranges: 90.4% for AGIs below $25k, 92.1% for AGIs $25k-50k, 90.7% for AGIs $50k-75k, 91.1% for AGIs $75k-100k, 91.9% for AGIs $100k-200k, 91.3% for AGIs over 200k)
Averages for the 2012 tax year for zip code 70448, filed in 2013:
Average Adjusted Gross Income (AGI) in 2012: $82,919 (Individual Income Tax Returns)
Here:
$82,919
State:
$56,730
Salary/wage: $70,664 (reported on 83.8% of returns)
Here:
$70,664
State:
$45,545
(% of AGI for various income ranges: 73.6% for AGIs below $25k, 74.4% for AGIs $25k-50k, 76.4% for AGIs $50k-75k, 76.2% for AGIs $75k-100k, 80.8% for AGIs $100k-200k, 58.2% for AGIs over 200k)
Taxable interest for individuals: $1,540 (reported on 41.2% of returns)
This zip code:
$1,540
Louisiana:
$1,804
(% of AGI for various income ranges: 1.7% for AGIs below $25k, 0.9% for AGIs $25k-50k, 0.7% for AGIs $50k-75k, 0.7% for AGIs $75k-100k, 0.6% for AGIs $100k-200k, 0.9% for AGIs over 200k)
Ordinary dividends: $4,476 (reported on 27.8% of returns)
Here:
$4,476
State:
$7,610
(% of AGI for various income ranges: 2.4% for AGIs below $25k, 1.4% for AGIs $25k-50k, 1.6% for AGIs $50k-75k, 1.1% for AGIs $75k-100k, 1.1% for AGIs $100k-200k, 1.9% for AGIs over 200k)
Net capital gain/loss in AGI: +$6,986 (reported on 22.4% of returns)
Here:
+$6,986
State:
+$17,096
(% of AGI for various income ranges: 0.1% for AGIs $25k-50k, 0.5% for AGIs $50k-75k, 0.7% for AGIs $75k-100k, 1.0% for AGIs $100k-200k, 4.2% for AGIs over 200k)
Profit/loss from business: +$20,878 (reported on 21.4% of returns)
Here:
+$20,878
State:
+$12,088
(% of AGI for various income ranges: 11.2% for AGIs below $25k, 6.2% for AGIs $25k-50k, 4.1% for AGIs $50k-75k, 4.2% for AGIs $75k-100k, 4.4% for AGIs $100k-200k, 6.2% for AGIs over 200k)
Taxable individual retirement arrangement distribution: $20,565 (reported on 10.3% of returns)
70448:
$20,565
Louisiana:
$16,085
(% of AGI for various income ranges: 3.3% for AGIs below $25k, 3.0% for AGIs $25k-50k, 2.9% for AGIs $50k-75k, 3.1% for AGIs $75k-100k, 2.3% for AGIs $100k-200k, 2.3% for AGIs over 200k)
Self-employment retirement plans: $22,240 (reported on 1.3% of returns)
70448:
$22,240
Louisiana:
$25,119
(% of AGI for various income ranges: 0.4% for AGIs $50k-75k, 0.2% for AGIs $100k-200k, 0.7% for AGIs over 200k)
Total itemized deductions: $23,929 (17% of AGI, reported on 44.9% of returns)
Here:
$23,929
State:
$23,585
Here:
17.1% of AGI
State:
18.1% of AGI
(% of AGI for various income ranges: 12.5% for AGIs below $25k, 13.2% for AGIs $25k-50k, 14.1% for AGIs $50k-75k, 14.1% for AGIs $75k-100k, 14.1% for AGIs $100k-200k, 11.1% for AGIs over 200k)
Charity contributions: $3,961 (reported on 37.0% of returns)
Here:
$3,961
State:
$5,533
(% of AGI for various income ranges: 0.8% for AGIs below $25k, 1.2% for AGIs $25k-50k, 1.4% for AGIs $50k-75k, 1.6% for AGIs $75k-100k, 1.8% for AGIs $100k-200k, 2.1% for AGIs over 200k)
Taxes paid: $7,733 (reported on 44.7% of returns)
70448:
$7,733
State:
$6,282
(% of AGI for various income ranges: 2.1% for AGIs below $25k, 2.4% for AGIs $25k-50k, 3.0% for AGIs $50k-75k, 3.6% for AGIs $75k-100k, 4.6% for AGIs $100k-200k, 4.9% for AGIs over 200k)
Earned income credit: $2,013 (reported on 12.1% of returns)
Here:
$2,013
State:
$2,633
(% of AGI for various income ranges: 5.4% for AGIs below $25k, 0.9% for AGIs $25k-50k)
Percentage of individuals using paid preparers for their 2012 taxes: 54.3%
Here:
54%
State:
57%
(% for various income ranges: 47.0% for AGIs below $25k, 52.9% for AGIs $25k-50k, 56.2% for AGIs $50k-75k, 53.8% for AGIs $75k-100k, 58.5% for AGIs $100k-200k, 74.7% for AGIs over 200k)
Averages for the 2004 tax year for zip code 70448, filed in 2005:
Average Adjusted Gross Income (AGI) in 2004: $65,873 (Individual Income Tax Returns)
Here:
$65,873
State:
$39,411
Salary/wage: $58,886 (reported on 85.8% of returns)
Here:
$58,886
State:
$34,434
(% of AGI for various income ranges: 132.5% for AGIs below $10k, 72.9% for AGIs $10k-25k, 79.5% for AGIs $25k-50k, 82.9% for AGIs $50k-75k, 84.8% for AGIs $75k-100k, 71.4% for AGIs over 100k)
Taxable interest for individuals: $1,342 (reported on 52.7% of returns)
This zip code:
$1,342
Louisiana:
$1,606
(% of AGI for various income ranges: 8.2% for AGIs below $10k, 2.9% for AGIs $10k-25k, 1.9% for AGIs $25k-50k, 0.9% for AGIs $50k-75k, 0.8% for AGIs $75k-100k, 0.8% for AGIs over 100k)
Taxable dividends: $2,382 (reported on 32.2% of returns)
Here:
$2,382
State:
$3,235
(% of AGI for various income ranges: 5.7% for AGIs below $10k, 1.5% for AGIs $10k-25k, 1.1% for AGIs $25k-50k, 1.0% for AGIs $50k-75k, 0.9% for AGIs $75k-100k, 1.2% for AGIs over 100k)
Net capital gain/loss: +$10,930 (reported on 26.4% of returns)
Here:
+$10,930
State:
+$8,531
(% of AGI for various income ranges: -2.6% for AGIs below $10k, 0.5% for AGIs $10k-25k, 0.7% for AGIs $25k-50k, 0.6% for AGIs $50k-75k, 1.2% for AGIs $75k-100k, 7.5% for AGIs over 100k)
Profit/loss from business: +$13,681 (reported on 20.2% of returns)
Here:
+$13,681
State:
+$9,128
(% of AGI for various income ranges: 2.0% for AGIs below $10k, 7.5% for AGIs $10k-25k, 5.2% for AGIs $25k-50k, 3.6% for AGIs $50k-75k, 2.1% for AGIs $75k-100k, 4.6% for AGIs over 100k)
IRA payment deduction: $3,332 (reported on 3.9% of returns)
70448:
$3,332
Louisiana:
$3,055
(% of AGI for various income ranges: 0.4% for AGIs $10k-25k, 0.3% for AGIs $25k-50k, 0.3% for AGIs $50k-75k, 0.2% for AGIs $75k-100k, 0.1% for AGIs over 100k)
Self-employed pension: $14,641 (reported on 1.5% of returns)
Here:
$14,641
Louisiana:
$17,274
(% of AGI for various income ranges: 0.2% for AGIs $25k-50k, 0.1% for AGIs $50k-75k, 0.1% for AGIs $75k-100k, 0.5% for AGIs over 100k)
Total itemized deductions: $19,418 (18% of AGI, reported on 48.7% of returns)
Here:
$19,418
State:
$18,222
Here:
18.1% of AGI
State:
20.3% of AGI
(% of AGI for various income ranges: 18.6% for AGIs below $10k, 11.9% for AGIs $10k-25k, 15.3% for AGIs $25k-50k, 17.2% for AGIs $50k-75k, 16.7% for AGIs $75k-100k, 12.8% for AGIs over 100k)
Charity contributions deductions: $3,063 (3% of AGI, reported on 44.2% of returns)
Here:
$3,063
State:
$4,190
Here:
2.8% of AGI
State:
4.4% of AGI
(% of AGI for various income ranges: 1.0% for AGIs below $10k, 1.1% for AGIs $10k-25k, 1.8% for AGIs $25k-50k, 1.9% for AGIs $50k-75k, 2.1% for AGIs $75k-100k, 2.2% for AGIs over 100k)
Total tax: $11,157 (reported on 80.7% of returns)
70448:
$11,157
State:
$6,529
(% of AGI for various income ranges: 5.2% for AGIs below $10k, 4.5% for AGIs $10k-25k, 7.1% for AGIs $25k-50k, 8.4% for AGIs $50k-75k, 9.9% for AGIs $75k-100k, 18.3% for AGIs over 100k)
Earned income credit: $1,756 (reported on 10.6% of returns)
Here:
$1,756
State:
$2,103
Percentage of individuals using paid preparers for their 2004 taxes: 52.9%
Here:
53%
State:
61%
(% for various income ranges: 46.9% for AGIs below $10k, 53.1% for AGIs $10k-25k, 51.8% for AGIs $25k-50k, 54.2% for AGIs $50k-75k, 50.3% for AGIs $75k-100k, 60.6% for AGIs over 100k)
Likely homosexual households (counted as self-reported same-sex unmarried-partner households)
Lesbian couples: 0.1% of all households
Gay men: 0.0% of all households
Household received Food Stamps/SNAP in the past 12 months: 342 Household did not receive Food Stamps/SNAP in the past 12 months: 9,538
Women who had a birth in the past 12 months: 269 (165 now married, 102 unmarried) Women who did not have a birth in the past 12 months: 5,667 (2,790 now married, 2,852 unmarried)
Housing units in zip code 70448 with a mortgage: 5,681 (861 second mortgage, 709 both second mortgage and home equity loan) Houses without a mortgage: 104
Median monthly owner costs for units with a mortgage: $1,856 Median monthly owner costs for units without a mortgage: $647
Residents with income below the poverty level in 2022:
This zip code:
9.5%
Whole state:
18.6%
Residents with income below 50% of the poverty level in 2022:
This zip code:
6.0%
Whole state:
10.1%
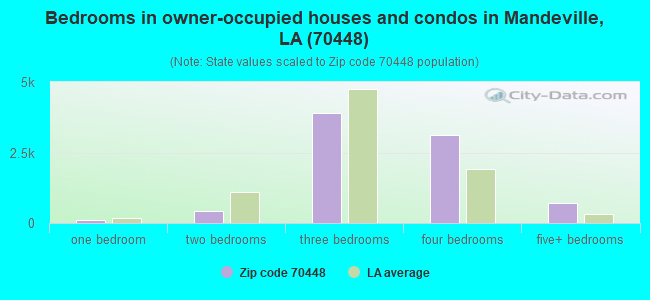
Median number of rooms in houses and condos:
Here:
6.6
State:
6.2
Median number of rooms in apartments:
Here:
4.9
State:
4.4
Notable locations in this zip code not listed on our city pages
Notable locations in zip code 70448: Castine Regional Sewage Treatment Plant (A), Mandeville Police Department (B), Southeast Louisiana Hospital Fontainebleau Treatment Center (C), Mandeville Cultural Interpretive Center (D), Saint Tammany Parish Library Mandeville Branch (E), Mandeville Fire Department (F), Saint Tammany Parish Fire District 4 Station 41 (G), Pontchartrain Health Care Center (H), Saint Tammany Parish Fire District 4 Station 44 (I), Ochsner Health Center Mandeville (J). Display/hide their locations on the map
Churches in zip code 70448 include: Morning Star Baptist Church (A), Mandeville Christian Fellowship Church (B), Mandeville Bible Church (C), Goodwill Baptist Church (D), First Free Mission Baptist Church (E), First Baptist Church of Mandeville (F), Deliverance Tabernacle (G), Cornerstone Assembly of God (H), Our Lady of the Lake Catholic Church (I). Display/hide their locations on the map
In group quarters: 195 (-1 institutionalized population)
Size of family households: 3,321 2-persons, 2,042 3-persons, 1,343 4-persons, 474 5-persons, 193 6-persons, 122 7-or-more-persons
Size of nonfamily households: 2,131 1-person, 356 2-persons, 61 3-persons
3,966 married couples with children.
1,651 single-parent households (508 men, 1,143 women).
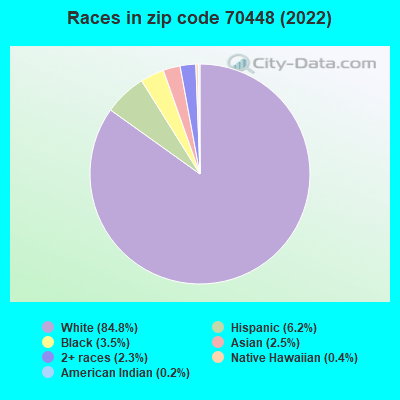
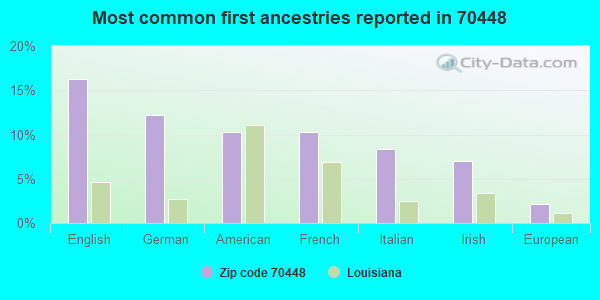
92.8% of residents of 70448 zip code speak English at home.
2.9% of residents speak Spanish at home (76% very well, 16% well, 9% not well).
2.4% of residents speak other Indo-European language at home (83% very well, 17% well).
2.2% of residents speak Asian or Pacific Island language at home (46% very well, 11% well, 44% not well).
0.1% of residents speak other language at home (100% very well).
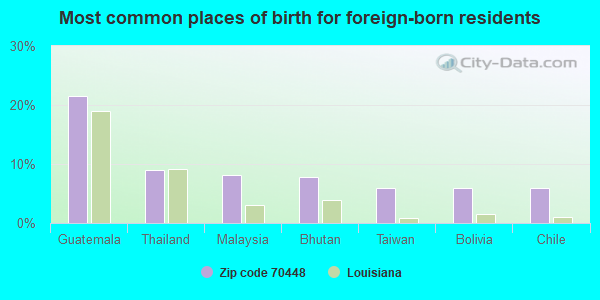
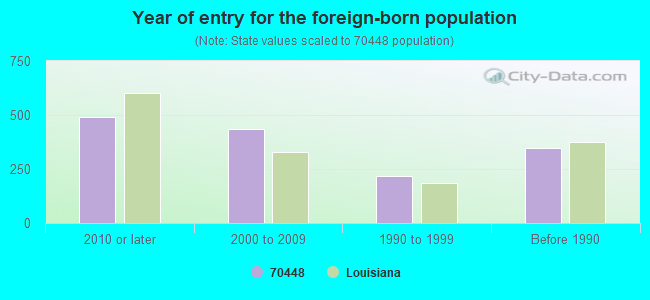
Foreign born population: 1,247 (4.8%) (42.3% of them are naturalized citizens)
Major facilities with environmental interests located in this zip code:
NEW ECONO CLNRS INC (2201 11TH ST STE 4 in MANDEVILLE, LA)
(Resource Conservation and Recovery Act (tracking hazardous waste)) Conditionally Exempt Small Quantity Generators, less than 100 kg/month of hazardous waste (Resource Conservation and Recovery Act (tracking hazardous waste)) - notification Organizations: CHARLES F SCHROEDER (CONTACT/OPERATOR)
, LAMICH CORP (CONTACT/OWNER)
, PETER MILLER (CONTACT/OWNER)
, TOWNVIEW ASSOC INC (CONTACT/OWNER)
, HIBALL INC (CONTACT/OWNER)
Alternative names: TOWN VIEW ASSOC INC DBA ECONO CLEANERS
OPERATION JUMPSTART ALTERNATIVE SCHOOL (23515 HIGHWAY 190 in MANDEVILLE, LA)
(National Center for Education Statistics) - STATE ID-052054 Organizations: SAINT TAMMANY PARISH SCHOOL BOARD (SCHOOL DISTRICT)
GREENLEAVE UTILITY COMPANY (845 GALVEZ STREET in MANDEVILLE, LA)
(Integrated Compliance Information System) - ICIS-06-2000-0100, FORMAL ENFORCEMENT ACTION, ICIS-06-2001-0095, ICIS-06-2000-0100, National Pollutant Discharge Elimination System MAJOR (Tracking pollutant discharge elimination systems) - permit Business SIC classification: SEWERAGE SYSTEMS Alternative names: GREENLEAVES UTILITY CO
FOUNTBLEAU STATE PARK (1 MI E OF MANDEVILLE ON HWY 190 in MANDEVILLE, LA)
(Integrated Compliance Information System) - ICIS-06-1993-0070, FORMAL ENFORCEMENT ACTION Business SIC classification: WATER SUPPLY
MONEY HILLS ESTATES WATER SYS (845 GALVEZ ST in MANDEVILLE, LA)
(Integrated Compliance Information System) - ICIS-06-2000-0773, FORMAL ENFORCEMENT ACTION Business SIC classification: WATER SUPPLY
RAPID OIL CHANGE #3 (3849 HWY 22 in MANDEVILLE, LA)
National Pollutant Discharge Elimination System NON-MAJOR (Tracking pollutant discharge elimination systems) - permit Conditionally Exempt Small Quantity Generators, less than 100 kg/month of hazardous waste (Resource Conservation and Recovery Act (tracking hazardous waste)) - notification Business SIC classification: AUTOMOTIVE REPAIR SHOPS Business NAICS classification: OTHER AUTOMOTIVE MECHANICAL AND ELECTRICAL REPAIR AND MAINTENANCE. Organizations: OJALA LTD (CONTACT/OWNER)
Alternative names: RAPID OIL CHG #3
EUROPEAN MTR CARS (904 LAMARQUE ST in MANDEVILLE, LA)
Large Quantity Generators, more that 1000 kg of hazardous waste/month (Resource Conservation and Recovery Act (tracking hazardous waste)) - notification Organizations: LOU ESTINGOY ON CLEVELAND (CONTACT/OWNER)
CHAHTA MOBILE HOME- (1101 COLBERT STREET in MANDEVILLE, LA)
National Pollutant Discharge Elimination System NON-MAJOR (Tracking pollutant discharge elimination systems) - permit COMMUNITY WATER SYSTEM (SDWIS) Business SIC classification: SEWERAGE SYSTEMS Alternative names: CHAHTA MOBILE HOME PARK
OCHSNER CLINIC ST TAMMANY (2810 FLORIDA AVE in MANDEVILLE, LA)
Large Quantity Generators, more that 1000 kg of hazardous waste/month (Resource Conservation and Recovery Act (tracking hazardous waste)) - notification Organizations: A OCHSNER MEDICAL FND (CONTACT/OWNER)
NORTH STAR MOTORS LLC (2123 FLORIDA ST in MANDEVILLE, LA)
HCA NORTHSHORE CARE CNTR (800 HEAVENS DR in MANDEVILLE, LA)
Large Quantity Generators, more that 1000 kg of hazardous waste/month (Resource Conservation and Recovery Act (tracking hazardous waste)) - notification Organizations: HOSPITAL CORP. OF AMERICA (CONTACT/OWNER)
159 COMMERCIAL AND MOBILE (HOME PARK in SLIDELL, LA)
National Pollutant Discharge Elimination System NON-MAJOR (Tracking pollutant discharge elimination systems) - permit Business SIC classification: SEWERAGE SYSTEMS Alternative names: NORTHLAKE ENVIRONMENTAL
1701 FLORIDA ST. BUILDING (1701 FLORIDA ST. in MANDEVILLE, LA)
National Pollutant Discharge Elimination System NON-MAJOR (Tracking pollutant discharge elimination systems) - permit Business SIC classification: OPERATORS OF NONRESIDENTIAL BUILDINGS
Housing units lacking complete plumbing facilities: 1.2% Housing units lacking complete kitchen facilities: 1.4%
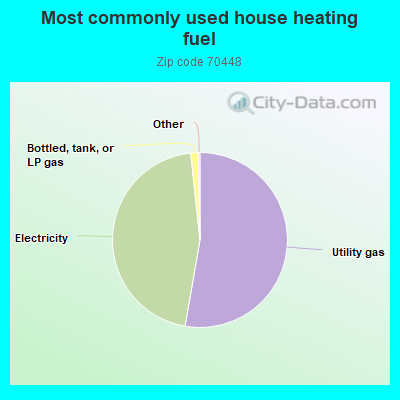
52.8%Utility gas
45.6%Electricity
1.4%Bottled, tank, or LP gas
Population in 1990: 22,492.
Place of birth for U.S.-born residents:
This state: 17,482
Northeast: 1,048
Midwest: 1,117
South: 3,877
West: 1,090
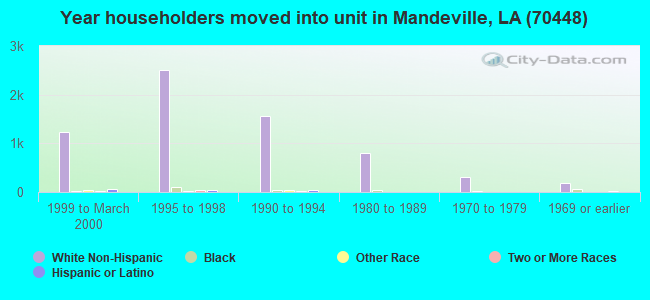
49% of the 70448 zip code residents lived in the same house 5 years ago. Out of people who lived in different houses, 34% lived in this county. Out of people who lived in different counties, 50% lived in Louisiana.
89% of the 70448 zip code residents lived in the same house 1 year ago. Out of people who lived in different houses, 49% moved from this county. Out of people who lived in different houses, 37% moved from different county within same state. Out of people who lived in different houses, 13% moved from different state.
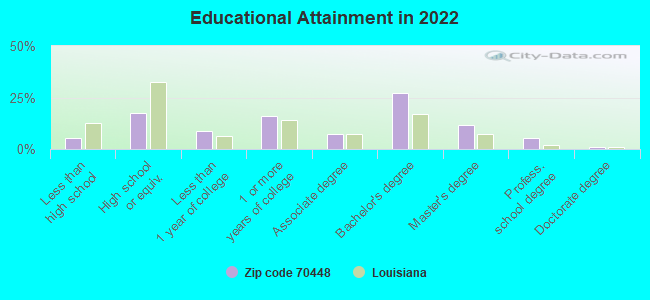
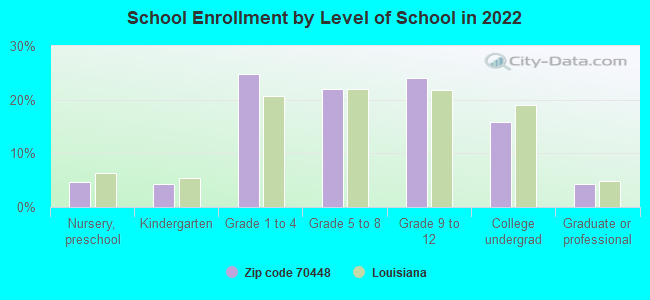
Private vs. public school enrollment:
Students in private schools in grades 1 to 8 (elementary and middle school): 892
Here:
29.1%
Louisiana:
19.6%
Students in private schools in grades 9 to 12 (high school): 370
Here:
23.7%
Louisiana:
18.3%
Students in private undergraduate colleges: 233
Here:
22.3%
Louisiana:
17.4%
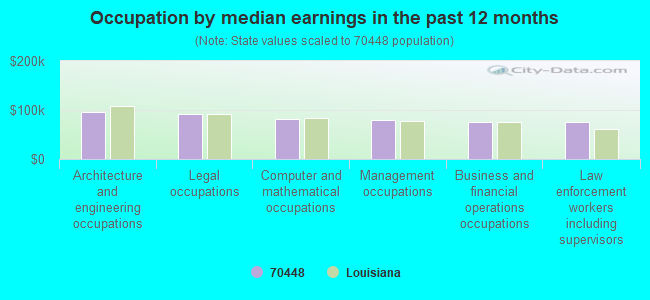
Occupation by median earnings in the past 12 months ($)
95,970Architecture and engineering occupations
92,597Legal occupations
81,865Computer and mathematical occupations
79,161Management occupations
75,024Business and financial operations occupations
75,014Law enforcement workers including supervisors
Companies with federal contracts located in this zip code (MANDEVILLE, LA):
B & K CONSTRUCTION CO INC (1905 HIGHWAY 59; small business) : $74,693,037 in 155 contractsfrom 1999 to 2006
Contracts for Construction of Structures and Facilities -- Other Non-Building Facilities, Lease or Rental of Equipment -- Tractors by Army, U.S. Army Corps of Engineers - civil program financing only Signed by year:2000: $6,756,538; 2001: $8,534,286; 2002: $5,396,780; 2003: $5,934,285; 2004: $3,750,641; 2005: $23,602,017; 2006: $15,218,490.
Biggest contracts:
$7,968,100 with Army for Construction of Structures and Facilities -- Other Non-Building Facilities. Signed on 2005-11-11. Completion date: 2005-12-12.
$6,280,425, same as above.Signed on 2006-03-03. Completion date: 2006-06-01.
$4,500,000 with U.S. Army Corps of Engineers - civil program financing only for Construction of Structures and Facilities -- Other Non-Building Facilities. Signed on 1999-11-05. Completion date: 1999-09-15.
$2,192,180 with Army for Construction of Structures and Facilities -- Other Non-Building Facilities. Signed on 2006-04-05. Completion date: 2005-12-12.
SHAVERS-WHITTLE CONSTRUCTION, (100 MARINERS BLVD , SUITE; small business) : $18,828,229 in 84 contractsfrom 2000 to 2006
Contracts for Construction of Structures and Facilities -- Other Non-Building Facilities, Food, Oils and Fats, Maintenance, Repair or Alteration of Real Property -- Restoration of real property by U.S. Army Corps of Engineers - civil program financing only, Army, Bureau of Prisoners/Federal Prison System, Natural Resources Conservation Service, and others Signed by year:2000: $830,000; 2001: $9,885,408; 2002: $4,110,528; 2003: $2,954,969; 2004: -$11,564; 2005: $0; 2006: $1,058,888.
Biggest contracts:
$1,779,000 with U.S. Army Corps of Engineers - civil program financing only for Construction of Structures and Facilities -- Other Non-Building Facilities. Signed on 2001-12-12. Completion date: 2003-02-09.
$1,714,000, same as above.Signed on 2001-12-12. Completion date: 2002-11-14.
$1,045,000, same as above.Signed on 2001-09-10. Completion date: 2002-09-11.
$851,000, same as above.Signed on 2002-05-28. Completion date: 2002-11-14.
SCOBY ENTERPRISES LLC (395 LAURA DR. S.; small business)
$42,500 with Air Force for Specialized Shipping and Storage Containers. Signed on 2000-05-19. Completion date: 2000-07-31.
DAMEWARE DEVELOPMENT, L L C (241 MORNINGSIDE DRIVE; small business) : $29,670 in 12 contractsfrom 2004 to 2006
Contracts for ADP Input/Output and Storage Devices, ADP Software, ADP Components, ADP Supplies, and moreby Navy, Army, Department of Veterans Affairs, Bureau of Labor Statistics, and others Signed by year:2000: $0; 2001: $0; 2002: $0; 2003: $0; 2004: $10,681; 2005: $13,749; 2006: $5,240.
Biggest contracts:
$6,523 with Navy for ADP Input/Output and Storage Devices. Taking place in VA. Signed on 2005-01-20. Completion date: 2005-02-25.
$4,446 with Army for ADP Software. Signed on 2005-07-12. Completion date: 2006-02-04.
$4,247 with Department of Veterans Affairs for ADP Components. Signed on 2006-03-30. Completion date: 2006-04-29.
$3,048 with Army for ADP Supplies. Signed on 2004-03-18. Completion date: 2004-03-31.
AUTOMATIC DOOR SYSTEMS INC (1925 HARRY LEMONS ROAD SUI; small business) : $26,936 in 10 contractsfrom 2005 to 2006
Contracts for Maintenance, Repair and Rebuilding of Equipment -- Miscellaneous, Electrical Hardware and Supplies, Maintenance, Repair and Rebuilding of Equipment -- Prefabricated Structures and Scaffolding, Maintenance, Repair or Alteration of Real Property -- Hospitals and Infirmaries, and moreby Department of Veterans Affairs, Defense Commissary Agency Signed by year:2000: $0; 2001: $0; 2002: $0; 2003: $0; 2004: $0; 2005: $6,219; 2006: $20,717.
Biggest contracts:
$9,347 with Department of Veterans Affairs for Maintenance, Repair and Rebuilding of Equipment -- Miscellaneous. Signed on 2006-03-31. Completion date: 2006-04-13.
$7,488 with Department of Veterans Affairs for Electrical Hardware and Supplies. Signed on 2006-07-13. Completion date: 2006-08-11.
$5,030 with Defense Commissary Agency for Maintenance, Repair and Rebuilding of Equipment -- Prefabricated Structures and Scaffolding. Taking place in MS. Signed on 2005-03-21. Completion date: 2006-04-30.
$1,638 with Department of Veterans Affairs for Maintenance, Repair or Alteration of Real Property -- Hospitals and Infirmaries. Signed on 2006-07-18. Completion date: 2006-07-28.
FISCHER ENVIRONMENTAL SERVICES (1980 SURGI DR; small business) : $10,500 in 2 contractsfrom 2005 to 2006
$5,700 with Army for Insect and Rodent Control Services. Signed on 2006-01-17. Completion date: 2006-12-31.
$4,800 with Air Force for Insect and Rodent Control Services. Taking place in MS. Signed on 2005-10-06. Completion date: 2006-09-30.
ST TAMMANY LINEN INC (3910 FLORIDA ST; small business) : $3,806 in 2 contractsfrom 2005 to 2006
$3,127 with Army for Laundry and DryCleaning Services. Signed on 2005-10-21. Completion date: 2006-03-16.
$679, same as above.Signed on 2006-05-27. Completion date: 2006-03-16.
ACTION INDUSTRIAL & MARINE SAL (662 PLANTATION BLVD; small business) : $0 in 4 contractsin 2005
$6,300 with Army for Miscellaneous Items. Signed on 2005-05-23. Completion date: 2005-07-01.
$6,300 with U.S. Army Corps of Engineers - civil program financing only for Miscellaneous Items. Signed on 2005-05-23. Completion date: 2005-07-01.
-$6,300, same as above.Signed on 2005-05-24. Completion date: 2005-07-01.
-$6,300 with Army for Miscellaneous Items. Signed on 2005-05-24. Completion date: 2005-07-01.
Top industries in this zip code by the number of employees in 2005:
Health Care and Social Assistance: Psychiatric and Substance Abuse Hospitals (500-999 employees: 1 establishment)
2002 - 2018 National Fire Incident Reporting System (NFIRS) incidents
Based on the data from the years 2002 - 2018 the average number of fires per year is 103. The highest number of reported fire incidents - 368 took place in 2005, and the least - 0 in 2006. The data has a declining trend.
When looking into fire subcategories, the most reports belonged to: Outside Fires (67.3%), and Structure Fires (19.0%).
Fire incident types reported to NFIRS in Zip Code 70448


 Nearest zip codes: 70471, 70445, 70420, 70433, 70447, 70460.
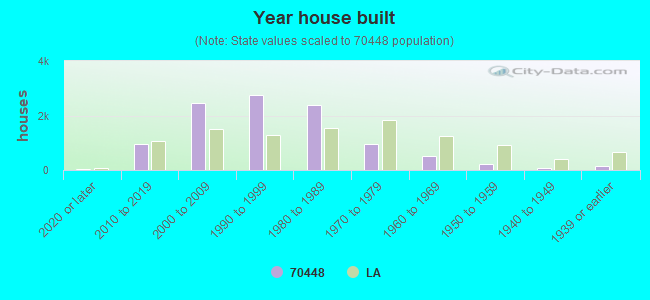


 Based on the data from the years 2002 - 2018 the average number of fires per year is 103. The highest number of reported fire incidents - 368 took place in 2005, and the least - 0 in 2006. The data has a declining trend.
 When looking into fire subcategories, the most reports belonged to: Outside Fires (67.3%), and Structure Fires (19.0%).