Averages for the 2020 tax year for zip code 70529, filed in 2021:
Average Adjusted Gross Income (AGI) in 2020: $51,012 (Individual Income Tax Returns)
Here:
$51,012
State:
$60,757
Salary/wage: $44,294 (reported on 84.8% of returns)
Here:
$44,294
State:
$50,882
(% of AGI for various income ranges: 1111.3% for AGIs below $25k, 3621.8% for AGIs $25k-50k, 6830.9% for AGIs $50k-75k, 9539.3% for AGIs $75k-100k, 16873.0% for AGIs $100k-200k, 43782.5% for AGIs over 200k)
Taxable interest for individuals: $1,113 (reported on 19.1% of returns)
This zip code:
$1,113
Louisiana:
$1,576
(% of AGI for various income ranges: 4.7% for AGIs below $25k, 10.8% for AGIs $25k-50k, 21.5% for AGIs $50k-75k, 65.3% for AGIs $75k-100k, 84.2% for AGIs $100k-200k, 802.5% for AGIs over 200k)
Ordinary dividends: $3,680 (reported on 9.4% of returns)
Here:
$3,680
State:
$7,743
(% of AGI for various income ranges: 9.9% for AGIs below $25k, 23.1% for AGIs $25k-50k, 38.5% for AGIs $50k-75k, 64.0% for AGIs $75k-100k, 82.7% for AGIs $100k-200k, 1802.5% for AGIs over 200k)
Net capital gain/loss in AGI: +$5,313 (reported on 9.1% of returns)
Here:
+$5,313
State:
+$16,917
(% of AGI for various income ranges: 3.7% for AGIs below $25k, 23.0% for AGIs $25k-50k, 43.9% for AGIs $50k-75k, 94.0% for AGIs $75k-100k, 255.5% for AGIs $100k-200k, 2085.0% for AGIs over 200k)
Profit/loss from business: +$6,929 (reported on 20.4% of returns)
Here:
+$6,929
State:
+$7,679
(% of AGI for various income ranges: 181.0% for AGIs below $25k, 121.5% for AGIs $25k-50k, 122.0% for AGIs $50k-75k, 259.3% for AGIs $75k-100k, 465.8% for AGIs $100k-200k)
Taxable individual retirement arrangement distribution: $22,244 (reported on 5.2% of returns)
70529:
$22,244
Louisiana:
$20,716
(% of AGI for various income ranges: 22.4% for AGIs below $25k, 47.0% for AGIs $25k-50k, 191.7% for AGIs $50k-75k, 320.7% for AGIs $75k-100k, 978.5% for AGIs $100k-200k)
Total itemized deductions: $36,140 (reported on 3.9% of returns)
Here:
$36,140
State:
$36,265
(% of AGI for various income ranges: 111.0% for AGIs $25k-50k, 269.3% for AGIs $50k-75k, 365.3% for AGIs $75k-100k, 590.6% for AGIs $100k-200k, 4057.5% for AGIs over 200k)
Charity contributions: $9,817 (reported on 2.3% of returns)
Here:
$9,817
State:
$13,106
(% of AGI for various income ranges: 17.6% for AGIs $25k-50k, 59.1% for AGIs $50k-75k, 211.2% for AGIs $100k-200k)
Taxes paid: $5,640 (reported on 2.9% of returns)
70529:
$5,640
State:
$6,643
(% of AGI for various income ranges: 9.7% for AGIs $25k-50k, 19.3% for AGIs $50k-75k, 37.0% for AGIs $75k-100k, 103.6% for AGIs $100k-200k, 472.5% for AGIs over 200k)
Earned income credit: $2,689 (reported on 26.8% of returns)
Here:
$2,689
State:
$2,671
(% of AGI for various income ranges: 159.9% for AGIs below $25k, 89.7% for AGIs $25k-50k)
Percentage of individuals using paid preparers for their 2020 taxes: 94.0%
Here:
94%
State:
92%
(% for various income ranges: 93.8% for AGIs below $25k, 93.8% for AGIs $25k-50k, 93.4% for AGIs $50k-75k, 97.6% for AGIs $75k-100k, 94.2% for AGIs $100k-200k, 90.9% for AGIs over 200k)
Averages for the 2012 tax year for zip code 70529, filed in 2013:
Average Adjusted Gross Income (AGI) in 2012: $49,162 (Individual Income Tax Returns)
Here:
$49,162
State:
$56,730
Salary/wage: $44,330 (reported on 88.1% of returns)
Here:
$44,330
State:
$45,545
(% of AGI for various income ranges: 81.6% for AGIs below $25k, 85.6% for AGIs $25k-50k, 88.0% for AGIs $50k-75k, 84.4% for AGIs $75k-100k, 85.7% for AGIs $100k-200k, 48.4% for AGIs over 200k)
Taxable interest for individuals: $1,206 (reported on 22.2% of returns)
This zip code:
$1,206
Louisiana:
$1,804
(% of AGI for various income ranges: 0.5% for AGIs below $25k, 0.3% for AGIs $25k-50k, 0.4% for AGIs $50k-75k, 0.5% for AGIs $75k-100k, 0.2% for AGIs $100k-200k, 1.4% for AGIs over 200k)
Ordinary dividends: $3,131 (reported on 9.2% of returns)
Here:
$3,131
State:
$7,610
(% of AGI for various income ranges: 0.4% for AGIs below $25k, 0.6% for AGIs $25k-50k, 0.3% for AGIs $50k-75k, 0.3% for AGIs $75k-100k, 0.3% for AGIs $100k-200k, 1.7% for AGIs over 200k)
Net capital gain/loss in AGI: +$6,606 (reported on 6.8% of returns)
Here:
+$6,606
State:
+$17,096
(% of AGI for various income ranges: 0.2% for AGIs $25k-50k, 0.2% for AGIs $50k-75k, 1.2% for AGIs $75k-100k, 0.3% for AGIs $100k-200k, 3.7% for AGIs over 200k)
Profit/loss from business: +$9,848 (reported on 20.3% of returns)
Here:
+$9,848
State:
+$12,088
(% of AGI for various income ranges: 11.1% for AGIs below $25k, 4.3% for AGIs $25k-50k, 2.2% for AGIs $50k-75k, 4.6% for AGIs $75k-100k, 2.1% for AGIs $100k-200k, 3.1% for AGIs over 200k)
Taxable individual retirement arrangement distribution: $13,464 (reported on 4.5% of returns)
70529:
$13,464
Louisiana:
$16,085
(% of AGI for various income ranges: 0.7% for AGIs below $25k, 1.5% for AGIs $25k-50k, 1.3% for AGIs $50k-75k, 1.2% for AGIs $75k-100k, 2.1% for AGIs $100k-200k)
Total itemized deductions: $20,139 (17% of AGI, reported on 17.5% of returns)
Here:
$20,139
State:
$23,585
Here:
17.2% of AGI
State:
18.1% of AGI
(% of AGI for various income ranges: 3.2% for AGIs below $25k, 5.2% for AGIs $25k-50k, 7.0% for AGIs $50k-75k, 7.9% for AGIs $75k-100k, 8.9% for AGIs $100k-200k, 8.9% for AGIs over 200k)
Charity contributions: $4,022 (reported on 12.1% of returns)
Here:
$4,022
State:
$5,533
(% of AGI for various income ranges: 0.1% for AGIs below $25k, 0.6% for AGIs $25k-50k, 0.8% for AGIs $50k-75k, 1.1% for AGIs $75k-100k, 1.1% for AGIs $100k-200k, 2.0% for AGIs over 200k)
Taxes paid: $5,412 (reported on 17.0% of returns)
70529:
$5,412
State:
$6,282
(% of AGI for various income ranges: 0.2% for AGIs below $25k, 0.7% for AGIs $25k-50k, 1.2% for AGIs $50k-75k, 1.8% for AGIs $75k-100k, 2.7% for AGIs $100k-200k, 3.8% for AGIs over 200k)
Earned income credit: $2,627 (reported on 27.1% of returns)
Here:
$2,627
State:
$2,633
(% of AGI for various income ranges: 10.6% for AGIs below $25k, 1.4% for AGIs $25k-50k)
Percentage of individuals using paid preparers for their 2012 taxes: 56.5%
Here:
56%
State:
57%
(% for various income ranges: 54.2% for AGIs below $25k, 52.6% for AGIs $25k-50k, 54.8% for AGIs $50k-75k, 63.4% for AGIs $75k-100k, 66.7% for AGIs $100k-200k, 88.9% for AGIs over 200k)
Averages for the 2004 tax year for zip code 70529, filed in 2005:
Average Adjusted Gross Income (AGI) in 2004: $32,903 (Individual Income Tax Returns)
Here:
$32,903
State:
$39,411
Salary/wage: $30,894 (reported on 88.8% of returns)
Here:
$30,894
State:
$34,434
(% of AGI for various income ranges: 90.8% for AGIs below $10k, 85.4% for AGIs $10k-25k, 89.4% for AGIs $25k-50k, 89.5% for AGIs $50k-75k, 86.8% for AGIs $75k-100k, 61.5% for AGIs over 100k)
Taxable interest for individuals: $1,289 (reported on 27.1% of returns)
This zip code:
$1,289
Louisiana:
$1,606
(% of AGI for various income ranges: 2.0% for AGIs below $10k, 1.3% for AGIs $10k-25k, 0.7% for AGIs $25k-50k, 0.7% for AGIs $50k-75k, 0.6% for AGIs $75k-100k, 2.1% for AGIs over 100k)
Taxable dividends: $2,030 (reported on 10.5% of returns)
Here:
$2,030
State:
$3,235
(% of AGI for various income ranges: 0.4% for AGIs below $10k, 0.4% for AGIs $10k-25k, 0.3% for AGIs $25k-50k, 0.3% for AGIs $50k-75k, 0.5% for AGIs $75k-100k, 2.0% for AGIs over 100k)
Net capital gain/loss: +$3,437 (reported on 7.8% of returns)
Here:
+$3,437
State:
+$8,531
(% of AGI for various income ranges: -0.0% for AGIs below $10k, 0.1% for AGIs $10k-25k, 0.3% for AGIs $25k-50k, 0.0% for AGIs $50k-75k, 1.1% for AGIs $75k-100k, 3.2% for AGIs over 100k)
Profit/loss from business: +$8,496 (reported on 16.7% of returns)
Here:
+$8,496
State:
+$9,128
(% of AGI for various income ranges: 12.3% for AGIs below $10k, 5.5% for AGIs $10k-25k, 3.0% for AGIs $25k-50k, 2.8% for AGIs $50k-75k, 2.1% for AGIs $75k-100k, 7.2% for AGIs over 100k)
IRA payment deduction: $3,118 (reported on 1.6% of returns)
70529:
$3,118
Louisiana:
$3,055
(% of AGI for various income ranges: 0.1% for AGIs $10k-25k, 0.2% for AGIs $25k-50k, 0.2% for AGIs $50k-75k, 0.2% for AGIs over 100k)
Total itemized deductions: $15,667 (21% of AGI, reported on 13.2% of returns)
Here:
$15,667
State:
$18,222
Here:
21.2% of AGI
State:
20.3% of AGI
(% of AGI for various income ranges: 3.8% for AGIs below $10k, 2.5% for AGIs $10k-25k, 5.9% for AGIs $25k-50k, 6.4% for AGIs $50k-75k, 7.8% for AGIs $75k-100k, 9.4% for AGIs over 100k)
Charity contributions deductions: $2,704 (3% of AGI, reported on 10.6% of returns)
Here:
$2,704
State:
$4,190
Here:
3.4% of AGI
State:
4.4% of AGI
(% of AGI for various income ranges: 0.3% for AGIs $10k-25k, 0.7% for AGIs $25k-50k, 0.7% for AGIs $50k-75k, 0.9% for AGIs $75k-100k, 1.9% for AGIs over 100k)
Total tax: $4,249 (reported on 67.0% of returns)
70529:
$4,249
State:
$6,529
(% of AGI for various income ranges: 3.1% for AGIs below $10k, 3.4% for AGIs $10k-25k, 5.8% for AGIs $25k-50k, 8.1% for AGIs $50k-75k, 10.5% for AGIs $75k-100k, 17.7% for AGIs over 100k)
Earned income credit: $1,904 (reported on 29.7% of returns)
Here:
$1,904
State:
$2,103
Percentage of individuals using paid preparers for their 2004 taxes: 60.6%
Here:
61%
State:
61%
(% for various income ranges: 57.8% for AGIs below $10k, 61.0% for AGIs $10k-25k, 60.2% for AGIs $25k-50k, 63.4% for AGIs $50k-75k, 59.9% for AGIs $75k-100k, 69.2% for AGIs over 100k)
Likely homosexual households (counted as self-reported same-sex unmarried-partner households)
Lesbian couples: 0.3% of all households
Gay men: 0.3% of all households
Household received Food Stamps/SNAP in the past 12 months: 1,039 Household did not receive Food Stamps/SNAP in the past 12 months: 4,825
Women who had a birth in the past 12 months: 100 (56 now married, 43 unmarried) Women who did not have a birth in the past 12 months: 3,202 (1,316 now married, 1,881 unmarried)
Housing units in zip code 70529 with a mortgage: 2,360 (80 second mortgage, 74 both second mortgage and home equity loan) Houses without a mortgage: 14
Median monthly owner costs for units with a mortgage: $1,468 Median monthly owner costs for units without a mortgage: $330
Residents with income below the poverty level in 2022:
This zip code:
22.4%
Whole state:
18.6%
Residents with income below 50% of the poverty level in 2022:
This zip code:
12.8%
Whole state:
10.1%
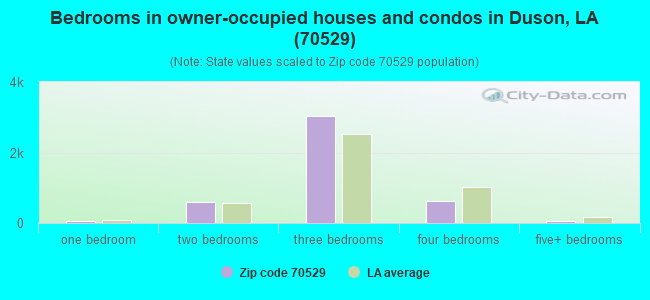
Median number of rooms in houses and condos:
Here:
5.5
State:
6.2
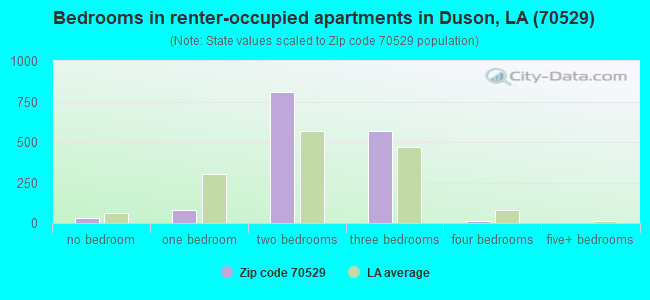
Median number of rooms in apartments:
Here:
4.5
State:
4.4
Notable locations in this zip code not listed on our city pages
Notable locations in zip code 70529: Duson Wastewater Treatment Facility (A), Country Aire Mobile Estates Wastewater Treatment Facility (B), Lafayette Parish Library Duson Branch (C), Duson Police Department (D), Duson Volunteer Fire Department Station 1 (E), Judice Volunteer Fire Department (F), Duson Volunteer Fire Department Station 2 (G). Display/hide their locations on the map
Churches in zip code 70529 include: Kingdom Hall of Jehovahs Witnesses (A), Church in the City Ministries (B), Christian Center Church (C), Kimball Chapel Methodist Church (D), Morning Star Church (E), Saint Theresas Church (F), Saint Benedict the Moor Church (G), Saint Basil Catholic Church (H). Display/hide their locations on the map
1,315 married couples with children.
1,273 single-parent households (253 men, 1,020 women).
89.2% of residents of 70529 zip code speak English at home.
4.1% of residents speak Spanish at home (25% very well, 17% well, 20% not well, 39% not at all).
5.8% of residents speak other Indo-European language at home (92% very well, 4% well, 4% not well).
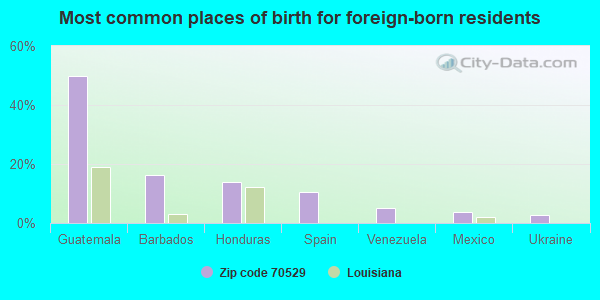
Foreign born population: 607 (4.6%) (25.1% of them are naturalized citizens)
This zip code:
4.6%
Whole state:
4.2%
50%Guatemala
16%Barbados
14%Honduras
11%Spain
5%Venezuela
4%Mexico
3%Ukraine
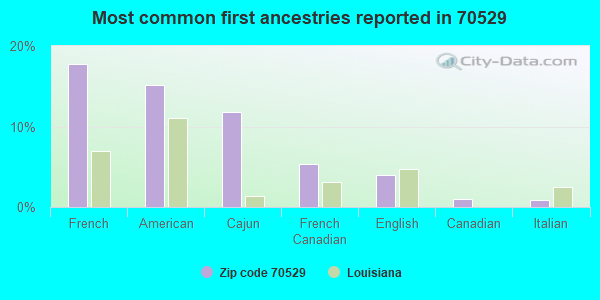
18%French
15%American
12%Cajun
5%French Canadian
4%English
1%Canadian
1%Italian
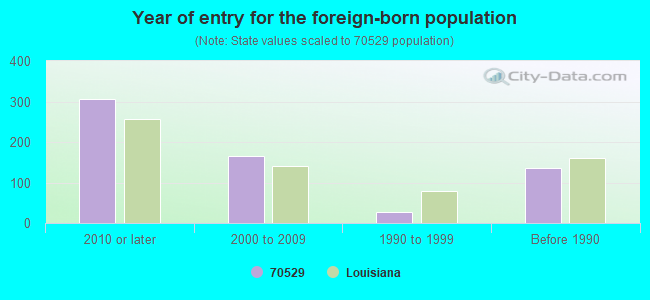
Year of entry for the foreign-born population
3062010 or later
1662000 to 2009
281990 to 1999
135Before 1990
Major facilities with environmental interests located in this zip code:
AMERICAN WASTEWATER SYSTEMS, INC. (1307 S. FIELDSPAN in DUSON, LA)
(Integrated Compliance Information System) - ICIS-06-2005-2055, FORMAL ENFORCEMENT ACTION, ENFORCEMENT/COMPLIANCE ACTIVITY National Pollutant Discharge Elimination System NON-MAJOR (Tracking pollutant discharge elimination systems) - permit Business SIC classification: SEWERAGE SYSTEMS Alternative names: ACADIANA WATER & SEWAGE
DUSON ELEMENTARY SCHOOL (301 FOURTH STREET in DUSON, LA)
(Geographic Names Information System) (National Center for Education Statistics) - STATE ID-028013 Organizations: LAFAYETTE PARISH SCHOOL BOARD (SCHOOL DISTRICT)
RIDGE ELEMENTARY SCHOOL (2901 SOUTH FIELDSPAN ROAD in DUSON, LA)
(National Center for Education Statistics) - STATE ID-028039 Organizations: LAFAYETTE PARISH SCHOOL BOARD (SCHOOL DISTRICT)
CHARLES M. BURKE ELEMENTARY SCHOOL (2845 RIDGE ROAD in DUSON, LA)
(National Center for Education Statistics) - STATE ID-028047 Organizations: LAFAYETTE PARISH SCHOOL BOARD (SCHOOL DISTRICT)
NORTH DUSON 4" LATERAL (PIPELINE RETIREMENT in DUSON, LA)
National Pollutant Discharge Elimination System NON-MAJOR (Tracking pollutant discharge elimination systems) - permit National Pollutant Discharge Elimination System NON-MAJOR (Tracking pollutant discharge elimination systems) - permit Alternative names: JUDICE 6" LATERAL, TRANSCONTINENTAL GAS
GOING WEST TRAILER PARK (900 JOHN LEBLANC RD in DUSON, LA)
National Pollutant Discharge Elimination System NON-MAJOR (Tracking pollutant discharge elimination systems) - permit National Pollutant Discharge Elimination System NON-MAJOR (Tracking pollutant discharge elimination systems) - permit Business SIC classification: OPERATORS OF RESIDENTIAL MOBILE HOME SITES Alternative names: GOING WEST MOBILE HOME PARK
GUARANTY SEED CO (102 1ST ST in DUSON, LA)
AIR MINOR (AIRS/AFS) (Resource Conservation and Recovery Act (tracking hazardous waste)) Business SIC classification: NITROGENOUS FERTILIZERS Alternative names: D J SLAGLE, GUARANTEE SEED CO
PAL-MIX DRUM SITE (8030 W CONGRESS ST in DUSON, LA)
SUPERFUND (Superfund database) (Resource Conservation and Recovery Act (tracking hazardous waste)) Alternative names: PAL MIX INTL LTD
GENES EXTERMINATING CO (111 3RD ST in DUSON, LA)
(Resource Conservation and Recovery Act (tracking hazardous waste)) Business NAICS classification: ALL OTHER MISCELLANEOUS STORE RETAILERS (EXCEPT TOBACCO STORES). Organizations: EUGENE CAHANIN (CONTACT/OWNER)
CHEM SPRAY INC (HWY 90 WEST in DUSON, LA)
(Resource Conservation and Recovery Act (tracking hazardous waste))
ACADIANA TREATMENT-ABADIE OAKS (4 MI W OF HWY 167-SOUTHWOOD DR in DUSON, LA)
National Pollutant Discharge Elimination System NON-MAJOR (Tracking pollutant discharge elimination systems) - permit Business SIC classification: SEWERAGE SYSTEMS Alternative names: ABADIE OAKS SUBDIVISION, TESI-ABADIE OAKS
ARCENEAUX # 1 FACILITY - SOUTH BOSCO FIE (2.5 MI NE OF in DUSON, LA)
AIR MINOR (AIRS/AFS) Business SIC classification: CRUDE PETROLEUM AND NATURAL GAS Alternative names: CHARLES W LOCK, KAISER-FRANCIS/SBF-
MUD SERVICES CORP (1ST STREET in DUSON, LA)
AIR MINOR (AIRS/AFS) Business SIC classification: OIL AND GAS FIELD SERVICES
Housing units lacking complete plumbing facilities: 0.4% Housing units lacking complete kitchen facilities: 1.7%
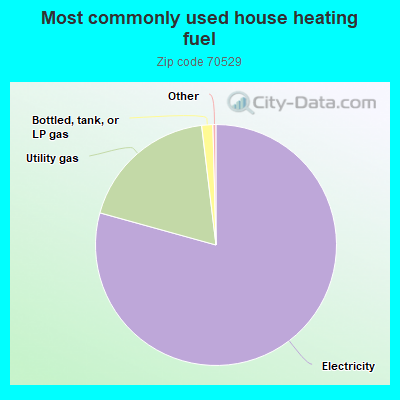
79.3%Electricity
18.8%Utility gas
1.5%Bottled, tank, or LP gas
Population in 1990: 7,160. Population change in the 1990s: +2,270 (+31.7%).
Place of birth for U.S.-born residents:
This state: 10,673
Northeast: 241
Midwest: 488
South: 1,039
West: 112
58% of the 70529 zip code residents lived in the same house 5 years ago. Out of people who lived in different houses, 64% lived in this county. Out of people who lived in different counties, 50% lived in Louisiana.
91% of the 70529 zip code residents lived in the same house 1 year ago. Out of people who lived in different houses, 69% moved from this county. Out of people who lived in different houses, 29% moved from different county within same state.
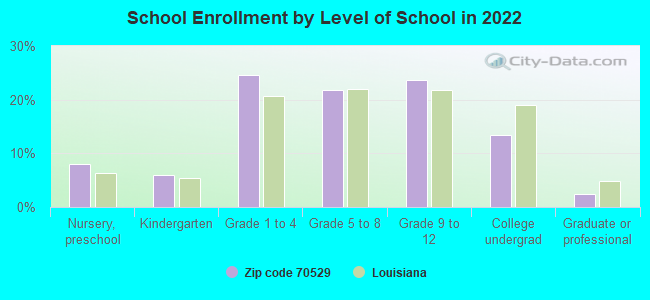
Private vs. public school enrollment:
Students in private schools in grades 1 to 8 (elementary and middle school): 324
Here:
23.8%
Louisiana:
19.6%
Students in private schools in grades 9 to 12 (high school): 116
Here:
16.8%
Louisiana:
18.3%
Students in private undergraduate colleges: 1
Here:
0.4%
Louisiana:
17.4%
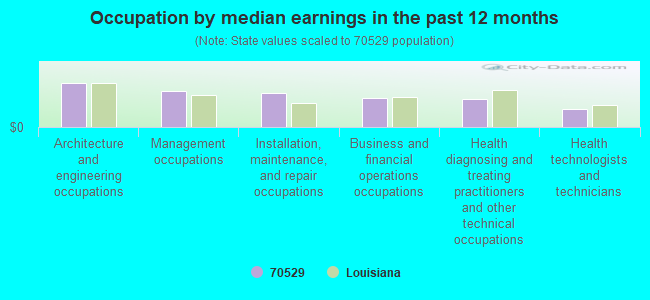
Occupation by median earnings in the past 12 months ($)
104,965Architecture and engineering occupations
84,766Management occupations
81,244Installation, maintenance, and repair occupations
69,968Business and financial operations occupations
66,493Health diagnosing and treating practitioners and other technical occupations
43,741Health technologists and technicians
Companies with federal contracts located in this zip code:
DOVE ENVIRONMENTALINC (103 CHARBONNET RD in DUSON, LA; small business) : $107,025 in 2 contractsfrom 2001 to 2003
$69,500 with Army for Sewage Treatment Equipment. Signed on 2003-08-20. Completion date: 2003-09-30.
$37,525 with Army for Motors, Electrical. Signed on 2001-09-05. Completion date: 2001-10-31.
VEGETATION MANAGEMENT SPECIALI (9031 CAMERON ST in DUSON, LA; small business) 33 employees, $2946789 revenue. : $23,750 in 3 contractsfrom 2000 to 2003
$89,000 with Air Force for Pesticides Support Services. Signed on 2000-01-26. Completion date: 2000-03-31.
$23,750 with Natural Resources Conservation Service for Maintenance, Repair or Alteration of Real Property -- Restoration of real property. Signed on 2003-03-15. Completion date: 2003-03-15.
-$89,000 with Air Force for Pesticides Support Services. Signed on 2000-05-30. Completion date: 2000-05-30.
Top industries in this zip code by the number of employees in 2005:
Mining: Support Activities for Oil and Gas Operations (100-249 employees: 1 establishment, 10-19 employees: 2 establishments, 5-9 employees: 1 establishment, 1-4 employees: 1 establishment)
Accommodation and Food Services: Full-Service Restaurants (20-49: 2)
Real Estate and Rental and Leasing: Construction, Mining, and Forestry Machinery and Equipment Rental and Leasing (20-49: 1, 10-19: 1, 1-4: 2)
Other Services (except Public Administration): Commercial and Industrial Machinery and Equipment (except Automotive and Electronic) Repair and Maintenance (20-49: 1, 10-19: 1, 1-4: 1)
People in group quarters in 2010:
10 people in group homes intended for adults
People in group quarters in 2000:
4 people in homes for the mentally retarded
4 people in homes for the physically handicapped
2 people in religious group quarters
Fatal accident statistics in 2014:
Fatal accident count: 2
Vehicles involved in fatal accidents: 5
Fatal accidents caused by drunken drivers: 1
Fatalities: 2
Persons involved in fatal accidents: 6
Pedestrians involved in fatal accidents: 0
Fatal accident statistics in 2013:
Fatal accident count: 3
Vehicles involved in fatal accidents: 6
Fatal accidents caused by drunken drivers: 2
Fatalities: 5
Persons involved in fatal accidents: 15
Pedestrians involved in fatal accidents: 0
Home Mortgage Disclosure Act Aggregated Statistics For Year 2009 (Based on 10 partial tracts)
A) FHA, FSA/RHS & VA Home Purchase Loans
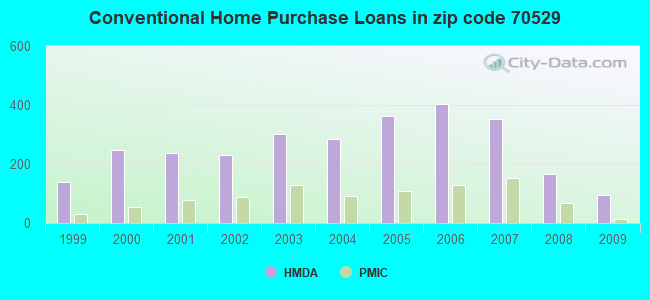
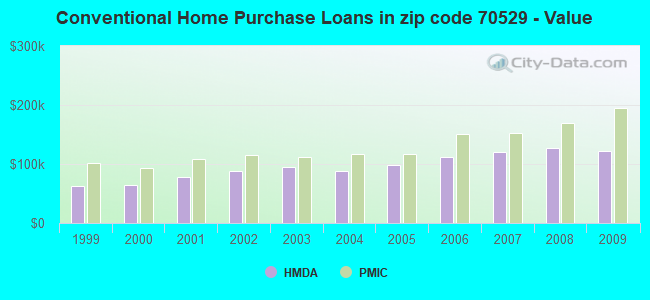
B) Conventional Home Purchase Loans
C) Refinancings
D) Home Improvement Loans
E) Loans on Dwellings For 5+ Families
F) Non-occupant Loans on < 5 Family Dwellings (A B C & D)
G) Loans On Manufactured Home Dwelling (A B C & D)
Number
Average Value
Number
Average Value
Number
Average Value
Number
Average Value
Number
Average Value
Number
Average Value
Number
Average Value
LOANS ORIGINATED
100
$146,073
96
$121,250
291
$133,582
45
$26,599
4
$64,243
45
$81,279
54
$45,076
APPLICATIONS APPROVED, NOT ACCEPTED
7
$114,469
12
$102,771
29
$120,451
6
$31,988
0
$0
4
$120,020
13
$60,824
APPLICATIONS DENIED
31
$169,718
46
$71,032
96
$128,995
41
$23,577
0
$0
9
$79,727
44
$63,121
APPLICATIONS WITHDRAWN
16
$147,986
16
$151,849
50
$150,235
3
$129,983
0
$0
4
$109,178
1
$13,150
FILES CLOSED FOR INCOMPLETENESS
7
$112,523
1
$89,420
31
$153,013
3
$158,183
0
$0
0
$0
1
$156,020
Aggregated Statistics For Year 2008 (Based on 10 partial tracts)
A) FHA, FSA/RHS & VA Home Purchase Loans
B) Conventional Home Purchase Loans
C) Refinancings
D) Home Improvement Loans
E) Loans on Dwellings For 5+ Families
F) Non-occupant Loans on < 5 Family Dwellings (A B C & D)
G) Loans On Manufactured Home Dwelling (A B C & D)
Number
Average Value
Number
Average Value
Number
Average Value
Number
Average Value
Number
Average Value
Number
Average Value
Number
Average Value
LOANS ORIGINATED
103
$146,415
167
$126,753
183
$132,753
52
$34,088
2
$209,160
44
$101,626
66
$52,512
APPLICATIONS APPROVED, NOT ACCEPTED
5
$133,438
32
$80,003
18
$103,580
10
$42,882
0
$0
6
$72,345
19
$50,114
APPLICATIONS DENIED
23
$135,112
84
$85,532
118
$123,667
55
$37,393
0
$0
12
$86,598
78
$52,805
APPLICATIONS WITHDRAWN
14
$133,319
31
$144,229
35
$144,025
6
$89,868
0
$0
3
$111,100
5
$53,192
FILES CLOSED FOR INCOMPLETENESS
11
$129,955
7
$133,980
20
$129,319
1
$41,200
0
$0
3
$81,650
3
$102,970
Aggregated Statistics For Year 2007 (Based on 10 partial tracts)
A) FHA, FSA/RHS & VA Home Purchase Loans
B) Conventional Home Purchase Loans
C) Refinancings
D) Home Improvement Loans
E) Loans on Dwellings For 5+ Families
F) Non-occupant Loans on < 5 Family Dwellings (A B C & D)
G) Loans On Manufactured Home Dwelling (A B C & D)
Number
Average Value
Number
Average Value
Number
Average Value
Number
Average Value
Number
Average Value
Number
Average Value
Number
Average Value
LOANS ORIGINATED
44
$135,732
353
$121,038
199
$123,071
77
$30,318
2
$3,343,380
77
$113,134
81
$49,496
APPLICATIONS APPROVED, NOT ACCEPTED
3
$95,517
88
$95,193
52
$120,098
14
$41,432
0
$0
23
$84,683
42
$52,649
APPLICATIONS DENIED
13
$103,055
115
$76,775
150
$126,591
56
$40,820
0
$0
15
$109,984
91
$48,726
APPLICATIONS WITHDRAWN
3
$132,313
45
$152,875
65
$135,097
8
$53,680
0
$0
10
$122,442
3
$70,047
FILES CLOSED FOR INCOMPLETENESS
1
$82,940
16
$144,909
22
$165,350
3
$157,163
0
$0
1
$213,230
0
$0
Aggregated Statistics For Year 2006 (Based on 10 partial tracts)
A) FHA, FSA/RHS & VA Home Purchase Loans
B) Conventional Home Purchase Loans
C) Refinancings
D) Home Improvement Loans
E) Loans on Dwellings For 5+ Families
F) Non-occupant Loans on < 5 Family Dwellings (A B C & D)
G) Loans On Manufactured Home Dwelling (A B C & D)
Number
Average Value
Number
Average Value
Number
Average Value
Number
Average Value
Number
Average Value
Number
Average Value
Number
Average Value
LOANS ORIGINATED
44
$118,618
402
$112,593
222
$108,212
86
$33,155
8
$357,365
95
$96,488
69
$49,508
APPLICATIONS APPROVED, NOT ACCEPTED
3
$47,470
66
$79,728
34
$113,774
12
$37,937
0
$0
9
$80,079
34
$38,744
APPLICATIONS DENIED
14
$62,660
111
$72,222
131
$99,319
53
$43,549
0
$0
16
$56,470
94
$42,168
APPLICATIONS WITHDRAWN
6
$96,807
39
$123,210
90
$127,504
5
$51,314
0
$0
10
$106,163
4
$75,528
FILES CLOSED FOR INCOMPLETENESS
3
$113,567
19
$129,591
37
$170,529
1
$199,410
0
$0
1
$185,990
0
$0
Aggregated Statistics For Year 2005 (Based on 10 partial tracts)
A) FHA, FSA/RHS & VA Home Purchase Loans
B) Conventional Home Purchase Loans
C) Refinancings
D) Home Improvement Loans
E) Loans on Dwellings For 5+ Families
F) Non-occupant Loans on < 5 Family Dwellings (A B C & D)
G) Loans On Manufactured Home Dwelling (A B C & D)
Number
Average Value
Number
Average Value
Number
Average Value
Number
Average Value
Number
Average Value
Number
Average Value
Number
Average Value
LOANS ORIGINATED
44
$100,359
364
$98,020
266
$100,726
71
$30,113
5
$73,624
103
$76,689
84
$50,684
APPLICATIONS APPROVED, NOT ACCEPTED
2
$98,400
68
$78,020
55
$90,176
12
$15,800
0
$0
7
$75,707
38
$49,685
APPLICATIONS DENIED
17
$80,385
122
$56,351
164
$106,260
51
$22,633
0
$0
14
$72,755
125
$41,168
APPLICATIONS WITHDRAWN
7
$100,064
42
$88,343
100
$104,064
9
$104,473
0
$0
12
$79,833
8
$58,789
FILES CLOSED FOR INCOMPLETENESS
1
$68,480
19
$117,291
49
$112,497
1
$181,280
0
$0
4
$65,812
1
$15,450
Aggregated Statistics For Year 2004 (Based on 10 partial tracts)
A) FHA, FSA/RHS & VA Home Purchase Loans
B) Conventional Home Purchase Loans
C) Refinancings
D) Home Improvement Loans
E) Loans on Dwellings For 5+ Families
F) Non-occupant Loans on < 5 Family Dwellings (A B C & D)
G) Loans On Manufactured Home Dwelling (A B C & D)
Number
Average Value
Number
Average Value
Number
Average Value
Number
Average Value
Number
Average Value
Number
Average Value
Number
Average Value
LOANS ORIGINATED
43
$111,271
285
$87,694
277
$92,010
69
$28,759
4
$220,515
62
$61,017
88
$44,632
APPLICATIONS APPROVED, NOT ACCEPTED
5
$67,700
49
$72,591
75
$93,123
8
$46,344
0
$0
5
$96,360
28
$44,731
APPLICATIONS DENIED
18
$77,943
120
$52,682
179
$91,446
53
$23,804
0
$0
18
$57,629
115
$39,823
APPLICATIONS WITHDRAWN
10
$97,754
22
$85,292
107
$95,129
6
$50,105
0
$0
6
$62,735
4
$76,130
FILES CLOSED FOR INCOMPLETENESS
4
$82,108
12
$91,311
62
$123,723
2
$37,185
0
$0
0
$0
1
$96,840
Aggregated Statistics For Year 2003 (Based on 10 partial tracts)
A) FHA, FSA/RHS & VA Home Purchase Loans
B) Conventional Home Purchase Loans
C) Refinancings
D) Home Improvement Loans
E) Loans on Dwellings For 5+ Families
F) Non-occupant Loans on < 5 Family Dwellings (A B C & D)
Number
Average Value
Number
Average Value
Number
Average Value
Number
Average Value
Number
Average Value
Number
Average Value
LOANS ORIGINATED
58
$97,057
302
$94,350
521
$90,867
72
$21,583
1
$2,016,420
68
$57,000
APPLICATIONS APPROVED, NOT ACCEPTED
2
$100,730
27
$63,879
73
$83,255
10
$21,166
0
$0
5
$45,412
APPLICATIONS DENIED
14
$75,551
82
$46,101
181
$78,071
57
$15,954
0
$0
15
$57,541
APPLICATIONS WITHDRAWN
0
$0
21
$81,493
102
$105,191
7
$19,704
0
$0
6
$54,638
FILES CLOSED FOR INCOMPLETENESS
5
$96,270
5
$116,422
14
$85,606
3
$34,777
0
$0
1
$79,580
Aggregated Statistics For Year 2002 (Based on 10 partial tracts)
A) FHA, FSA/RHS & VA Home Purchase Loans
B) Conventional Home Purchase Loans
C) Refinancings
D) Home Improvement Loans
E) Loans on Dwellings For 5+ Families
F) Non-occupant Loans on < 5 Family Dwellings (A B C & D)
Number
Average Value
Number
Average Value
Number
Average Value
Number
Average Value
Number
Average Value
Number
Average Value
LOANS ORIGINATED
49
$93,883
229
$87,712
360
$86,456
98
$21,986
1
$149,400
52
$49,028
APPLICATIONS APPROVED, NOT ACCEPTED
3
$65,030
59
$55,974
59
$77,911
11
$25,350
1
$258,160
6
$60,732
APPLICATIONS DENIED
7
$77,556
133
$47,238
128
$62,785
38
$9,237
0
$0
17
$34,018
APPLICATIONS WITHDRAWN
0
$0
25
$84,123
39
$81,452
5
$36,754
0
$0
4
$52,678
FILES CLOSED FOR INCOMPLETENESS
1
$109,560
4
$97,812
22
$89,482
0
$0
0
$0
1
$57,370
Aggregated Statistics For Year 2001 (Based on 10 partial tracts)
A) FHA, FSA/RHS & VA Home Purchase Loans
B) Conventional Home Purchase Loans
C) Refinancings
D) Home Improvement Loans
E) Loans on Dwellings For 5+ Families
F) Non-occupant Loans on < 5 Family Dwellings (A B C & D)
Number
Average Value
Number
Average Value
Number
Average Value
Number
Average Value
Number
Average Value
Number
Average Value
LOANS ORIGINATED
54
$90,241
236
$78,098
267
$84,799
77
$19,979
4
$162,845
26
$58,843
APPLICATIONS APPROVED, NOT ACCEPTED
2
$71,500
38
$44,632
56
$73,002
10
$19,619
0
$0
2
$106,345
APPLICATIONS DENIED
4
$81,112
164
$41,476
143
$67,200
56
$13,510
0
$0
15
$64,556
APPLICATIONS WITHDRAWN
2
$25,750
17
$73,441
96
$80,326
4
$19,128
0
$0
2
$107,630
FILES CLOSED FOR INCOMPLETENESS
2
$136,255
3
$57,400
15
$81,213
0
$0
0
$0
1
$28,610
Aggregated Statistics For Year 2000 (Based on 10 partial tracts)
A) FHA, FSA/RHS & VA Home Purchase Loans
B) Conventional Home Purchase Loans
C) Refinancings
D) Home Improvement Loans
F) Non-occupant Loans on < 5 Family Dwellings (A B C & D)
Number
Average Value
Number
Average Value
Number
Average Value
Number
Average Value
Number
Average Value
LOANS ORIGINATED
42
$78,940
247
$65,170
130
$56,014
87
$18,321
34
$52,896
APPLICATIONS APPROVED, NOT ACCEPTED
15
$47,768
70
$50,044
47
$51,600
14
$15,773
4
$62,505
APPLICATIONS DENIED
29
$51,679
211
$41,446
104
$52,200
45
$11,490
11
$73,669
APPLICATIONS WITHDRAWN
5
$52,920
24
$59,926
77
$59,677
6
$18,138
6
$62,528
FILES CLOSED FOR INCOMPLETENESS
0
$0
4
$73,890
14
$71,777
0
$0
1
$64,540
Aggregated Statistics For Year 1999 (Based on 5 partial tracts)
A) FHA, FSA/RHS & VA Home Purchase Loans
B) Conventional Home Purchase Loans
C) Refinancings
D) Home Improvement Loans
E) Loans on Dwellings For 5+ Families
F) Non-occupant Loans on < 5 Family Dwellings (A B C & D)
2002 - 2018 National Fire Incident Reporting System (NFIRS) incidents
Based on the data from the years 2002 - 2018 the average number of fires per year is 79. The highest number of reported fire incidents - 155 took place in 2011, and the least - 2 in 2005. The data has a rising trend.
When looking into fire subcategories, the most reports belonged to: Outside Fires (45.6%), and Structure Fires (40.2%).
Fire incident types reported to NFIRS in Zip Code 70529
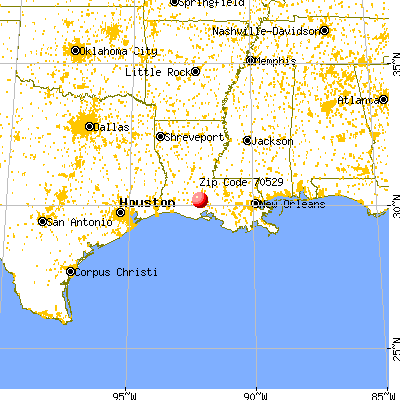


 Nearest zip codes: 70583, 70506, 70578, 70503, 70555, 70558.


 Based on the data from the years 2002 - 2018 the average number of fires per year is 79. The highest number of reported fire incidents - 155 took place in 2011, and the least - 2 in 2005. The data has a rising trend.
 When looking into fire subcategories, the most reports belonged to: Outside Fires (45.6%), and Structure Fires (40.2%).