Estimated zip code population in 2022: 26,394 Zip code population in 2010: 25,050 Zip code population in 2000: 19,397
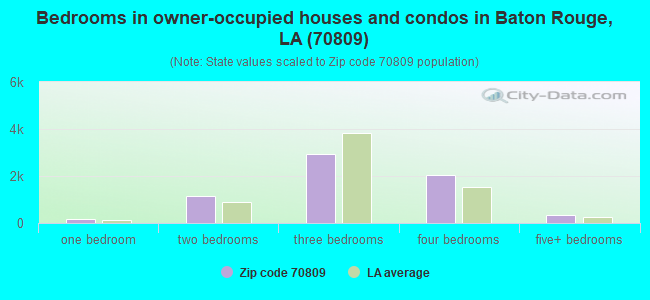
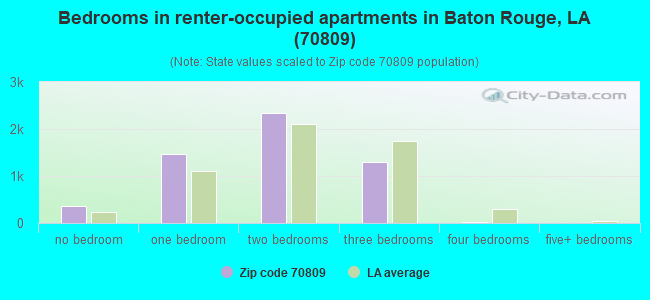
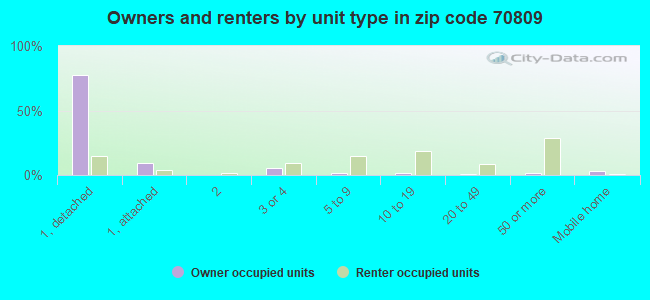
Houses and condos: 13,887 Renter-occupied apartments: 5,493
% of renters here:
45%
State:
32%
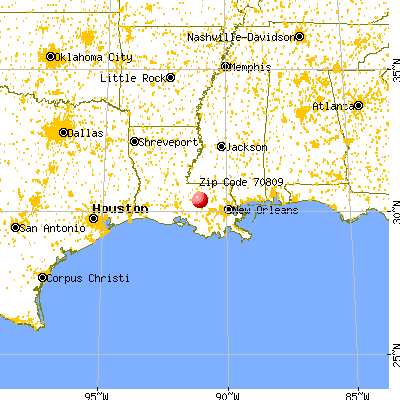
March 2022 cost of living index in zip code 70809: 91.0 (less than average, U.S. average is 100)
Land area: 14.8 sq. mi. Water area: 0.0 sq. mi.
Population density: 1,780 people per square mile
(low).
OSM Map
General Map
Google Map
MSN Map
OSM Map
General Map
Google Map
MSN Map
OSM Map
General Map
Google Map
MSN Map
OSM Map
General Map
Google Map
MSN Map
Please wait while loading the map...
Real estate property taxes paid for housing units in 2022:
This zip code:
0.7% ($2,100)
Louisiana:
0.5% ($1,127)
Median real estate property taxes paid for housing units with mortgages in 2022: $2,254 (0.7%) Median real estate property taxes paid for housing units with no mortgage in 2022: $1,889 (0.7%)
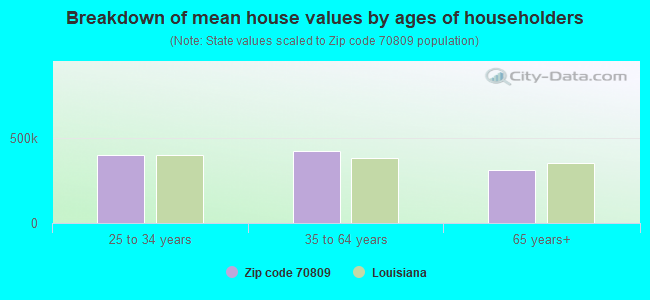
Estimated median house/condo value in 2022: $310,371
70809:
$310,371
Louisiana:
$209,200
According to our research of Louisiana and other state lists, there were 16 registered sex offenders living in 70809 zip code as of April 23, 2024. The ratio of all residents to sex offenders in zip code 70809 is 1,567 to 1. The ratio of registered sex offenders to all residents in this zip code is much lower than the state average.
Median resident age:
This zip code:
38.2 years
Louisiana median age:
38.2 years
Average household size:
This zip code:
2.1 people
Louisiana:
2.5 people
Averages for the 2020 tax year for zip code 70809, filed in 2021:
Average Adjusted Gross Income (AGI) in 2020: $111,476 (Individual Income Tax Returns)
Here:
$111,476
State:
$60,757
Salary/wage: $76,309 (reported on 79.4% of returns)
Here:
$76,309
State:
$50,882
(% of AGI for various income ranges: 1247.2% for AGIs below $25k, 3739.0% for AGIs $25k-50k, 6669.0% for AGIs $50k-75k, 9206.0% for AGIs $75k-100k, 18384.4% for AGIs $100k-200k, 90079.7% for AGIs over 200k)
Taxable interest for individuals: $2,611 (reported on 38.2% of returns)
This zip code:
$2,611
Louisiana:
$1,576
(% of AGI for various income ranges: 17.7% for AGIs below $25k, 23.7% for AGIs $25k-50k, 69.2% for AGIs $50k-75k, 128.5% for AGIs $75k-100k, 255.3% for AGIs $100k-200k, 2040.6% for AGIs over 200k)
Ordinary dividends: $11,508 (reported on 29.7% of returns)
Here:
$11,508
State:
$7,743
(% of AGI for various income ranges: 40.3% for AGIs below $25k, 64.7% for AGIs $25k-50k, 190.3% for AGIs $50k-75k, 377.3% for AGIs $75k-100k, 882.3% for AGIs $100k-200k, 7491.2% for AGIs over 200k)
Net capital gain/loss in AGI: +$30,283 (reported on 27.3% of returns)
Here:
+$30,283
State:
+$16,917
(% of AGI for various income ranges: 23.8% for AGIs below $25k, 46.1% for AGIs $25k-50k, 119.1% for AGIs $50k-75k, 385.8% for AGIs $75k-100k, 820.3% for AGIs $100k-200k, 25093.0% for AGIs over 200k)
Profit/loss from business: +$22,860 (reported on 19.4% of returns)
Here:
+$22,860
State:
+$7,679
(% of AGI for various income ranges: 97.1% for AGIs below $25k, 80.1% for AGIs $25k-50k, 152.2% for AGIs $50k-75k, 345.3% for AGIs $75k-100k, 1115.9% for AGIs $100k-200k, 10137.9% for AGIs over 200k)
Taxable individual retirement arrangement distribution: $26,549 (reported on 11.6% of returns)
70809:
$26,549
Louisiana:
$20,716
(% of AGI for various income ranges: 52.5% for AGIs below $25k, 131.7% for AGIs $25k-50k, 250.4% for AGIs $50k-75k, 620.6% for AGIs $75k-100k, 1266.3% for AGIs $100k-200k, 4137.0% for AGIs over 200k)
Self-employed (Keogh) retirement plans: $31,580 (reported on 1.3% of returns)
70809:
$31,580
Louisiana:
$27,459
(% of AGI for various income ranges: 79.1% for AGIs $100k-200k, 1219.7% for AGIs over 200k)
Total itemized deductions: $42,732 (reported on 12.3% of returns)
Here:
$42,732
State:
$36,265
(% of AGI for various income ranges: 89.2% for AGIs below $25k, 141.4% for AGIs $25k-50k, 368.8% for AGIs $50k-75k, 616.5% for AGIs $75k-100k, 1285.6% for AGIs $100k-200k, 10987.0% for AGIs over 200k)
Charity contributions: $19,496 (reported on 10.4% of returns)
Here:
$19,496
State:
$13,106
(% of AGI for various income ranges: 6.8% for AGIs below $25k, 22.2% for AGIs $25k-50k, 63.8% for AGIs $50k-75k, 146.9% for AGIs $75k-100k, 337.9% for AGIs $100k-200k, 5493.0% for AGIs over 200k)
Taxes paid: $7,712 (reported on 12.1% of returns)
70809:
$7,712
State:
$6,643
(% of AGI for various income ranges: 8.3% for AGIs below $25k, 17.7% for AGIs $25k-50k, 58.1% for AGIs $50k-75k, 131.5% for AGIs $75k-100k, 338.2% for AGIs $100k-200k, 1717.0% for AGIs over 200k)
Earned income credit: $2,283 (reported on 12.4% of returns)
Here:
$2,283
State:
$2,671
(% of AGI for various income ranges: 94.5% for AGIs below $25k, 52.5% for AGIs $25k-50k)
Percentage of individuals using paid preparers for their 2020 taxes: 91.9%
Here:
92%
State:
92%
(% for various income ranges: 90.9% for AGIs below $25k, 92.5% for AGIs $25k-50k, 92.5% for AGIs $50k-75k, 92.2% for AGIs $75k-100k, 91.6% for AGIs $100k-200k, 92.7% for AGIs over 200k)
Averages for the 2012 tax year for zip code 70809, filed in 2013:
Average Adjusted Gross Income (AGI) in 2012: $100,127 (Individual Income Tax Returns)
Here:
$100,127
State:
$56,730
Salary/wage: $71,495 (reported on 82.1% of returns)
Here:
$71,495
State:
$45,545
(% of AGI for various income ranges: 77.3% for AGIs below $25k, 80.6% for AGIs $25k-50k, 75.8% for AGIs $50k-75k, 70.5% for AGIs $75k-100k, 70.5% for AGIs $100k-200k, 44.2% for AGIs over 200k)
Taxable interest for individuals: $2,743 (reported on 41.7% of returns)
This zip code:
$2,743
Louisiana:
$1,804
(% of AGI for various income ranges: 1.3% for AGIs below $25k, 0.7% for AGIs $25k-50k, 0.9% for AGIs $50k-75k, 1.0% for AGIs $75k-100k, 1.1% for AGIs $100k-200k, 1.3% for AGIs over 200k)
Ordinary dividends: $9,952 (reported on 29.1% of returns)
Here:
$9,952
State:
$7,610
(% of AGI for various income ranges: 2.4% for AGIs below $25k, 1.7% for AGIs $25k-50k, 1.9% for AGIs $50k-75k, 2.0% for AGIs $75k-100k, 2.6% for AGIs $100k-200k, 3.5% for AGIs over 200k)
Net capital gain/loss in AGI: +$19,150 (reported on 24.4% of returns)
Here:
+$19,150
State:
+$17,096
(% of AGI for various income ranges: 0.4% for AGIs $25k-50k, 0.6% for AGIs $50k-75k, 0.9% for AGIs $75k-100k, 2.0% for AGIs $100k-200k, 8.0% for AGIs over 200k)
Profit/loss from business: +$24,622 (reported on 18.6% of returns)
Here:
+$24,622
State:
+$12,088
(% of AGI for various income ranges: 5.5% for AGIs below $25k, 3.7% for AGIs $25k-50k, 4.0% for AGIs $50k-75k, 4.0% for AGIs $75k-100k, 4.7% for AGIs $100k-200k, 4.8% for AGIs over 200k)
Taxable individual retirement arrangement distribution: $22,536 (reported on 12.0% of returns)
70809:
$22,536
Louisiana:
$16,085
(% of AGI for various income ranges: 3.4% for AGIs below $25k, 2.1% for AGIs $25k-50k, 2.9% for AGIs $50k-75k, 4.5% for AGIs $75k-100k, 4.0% for AGIs $100k-200k, 1.9% for AGIs over 200k)
Self-employment retirement plans: $27,955 (reported on 1.6% of returns)
70809:
$27,955
Louisiana:
$25,119
(% of AGI for various income ranges: 0.3% for AGIs $25k-50k, 0.3% for AGIs $100k-200k, 0.7% for AGIs over 200k)
Total itemized deductions: $30,128 (15% of AGI, reported on 37.8% of returns)
Here:
$30,128
State:
$23,585
Here:
15.1% of AGI
State:
18.1% of AGI
(% of AGI for various income ranges: 10.4% for AGIs below $25k, 8.6% for AGIs $25k-50k, 11.7% for AGIs $50k-75k, 12.6% for AGIs $75k-100k, 13.3% for AGIs $100k-200k, 10.9% for AGIs over 200k)
Charity contributions: $7,334 (reported on 31.6% of returns)
Here:
$7,334
State:
$5,533
(% of AGI for various income ranges: 1.0% for AGIs below $25k, 1.1% for AGIs $25k-50k, 1.6% for AGIs $50k-75k, 2.1% for AGIs $75k-100k, 2.5% for AGIs $100k-200k, 2.7% for AGIs over 200k)
Taxes paid: $9,483 (reported on 37.6% of returns)
70809:
$9,483
State:
$6,282
(% of AGI for various income ranges: 1.7% for AGIs below $25k, 1.5% for AGIs $25k-50k, 2.4% for AGIs $50k-75k, 3.0% for AGIs $75k-100k, 4.1% for AGIs $100k-200k, 4.1% for AGIs over 200k)
Earned income credit: $2,063 (reported on 11.7% of returns)
Here:
$2,063
State:
$2,633
(% of AGI for various income ranges: 5.2% for AGIs below $25k, 0.5% for AGIs $25k-50k)
Percentage of individuals using paid preparers for their 2012 taxes: 51.4%
Here:
51%
State:
57%
(% for various income ranges: 45.8% for AGIs below $25k, 43.3% for AGIs $25k-50k, 48.3% for AGIs $50k-75k, 54.4% for AGIs $75k-100k, 59.2% for AGIs $100k-200k, 80.7% for AGIs over 200k)
Averages for the 2004 tax year for zip code 70809, filed in 2005:
Average Adjusted Gross Income (AGI) in 2004: $65,953 (Individual Income Tax Returns)
Here:
$65,953
State:
$39,411
Salary/wage: $51,850 (reported on 82.6% of returns)
Here:
$51,850
State:
$34,434
(% of AGI for various income ranges: 179.4% for AGIs below $10k, 74.4% for AGIs $10k-25k, 80.2% for AGIs $25k-50k, 75.6% for AGIs $50k-75k, 77.4% for AGIs $75k-100k, 54.6% for AGIs over 100k)
Taxable interest for individuals: $2,514 (reported on 51.2% of returns)
This zip code:
$2,514
Louisiana:
$1,606
(% of AGI for various income ranges: 11.9% for AGIs below $10k, 2.6% for AGIs $10k-25k, 1.8% for AGIs $25k-50k, 1.7% for AGIs $50k-75k, 1.8% for AGIs $75k-100k, 1.9% for AGIs over 100k)
Taxable dividends: $5,543 (reported on 34.1% of returns)
Here:
$5,543
State:
$3,235
(% of AGI for various income ranges: 12.0% for AGIs below $10k, 2.3% for AGIs $10k-25k, 1.6% for AGIs $25k-50k, 2.0% for AGIs $50k-75k, 2.1% for AGIs $75k-100k, 3.4% for AGIs over 100k)
Net capital gain/loss: +$14,462 (reported on 28.2% of returns)
Here:
+$14,462
State:
+$8,531
(% of AGI for various income ranges: -0.0% for AGIs below $10k, 0.3% for AGIs $10k-25k, 0.4% for AGIs $25k-50k, 0.9% for AGIs $50k-75k, 1.9% for AGIs $75k-100k, 10.0% for AGIs over 100k)
Profit/loss from business: +$20,916 (reported on 15.5% of returns)
Here:
+$20,916
State:
+$9,128
(% of AGI for various income ranges: 9.5% for AGIs below $10k, 4.8% for AGIs $10k-25k, 2.5% for AGIs $25k-50k, 2.9% for AGIs $50k-75k, 3.5% for AGIs $75k-100k, 6.2% for AGIs over 100k)
IRA payment deduction: $3,413 (reported on 3.0% of returns)
70809:
$3,413
Louisiana:
$3,055
(% of AGI for various income ranges: 0.3% for AGIs $10k-25k, 0.2% for AGIs $25k-50k, 0.2% for AGIs $50k-75k, 0.2% for AGIs $75k-100k, 0.1% for AGIs over 100k)
Self-employed pension: $22,184 (reported on 1.7% of returns)
Here:
$22,184
Louisiana:
$17,274
Total itemized deductions: $22,579 (17% of AGI, reported on 36.0% of returns)
Here:
$22,579
State:
$18,222
Here:
17.4% of AGI
State:
20.3% of AGI
(% of AGI for various income ranges: 15.0% for AGIs below $10k, 9.1% for AGIs $10k-25k, 9.9% for AGIs $25k-50k, 12.5% for AGIs $50k-75k, 13.7% for AGIs $75k-100k, 12.9% for AGIs over 100k)
Charity contributions deductions: $5,962 (4% of AGI, reported on 31.6% of returns)
Here:
$5,962
State:
$4,190
Here:
4.3% of AGI
State:
4.4% of AGI
(% of AGI for various income ranges: 1.1% for AGIs below $10k, 1.0% for AGIs $10k-25k, 1.3% for AGIs $25k-50k, 2.1% for AGIs $50k-75k, 2.4% for AGIs $75k-100k, 3.7% for AGIs over 100k)
Total tax: $12,829 (reported on 81.3% of returns)
70809:
$12,829
State:
$6,529
(% of AGI for various income ranges: 5.8% for AGIs below $10k, 4.5% for AGIs $10k-25k, 8.4% for AGIs $25k-50k, 10.5% for AGIs $50k-75k, 11.6% for AGIs $75k-100k, 20.6% for AGIs over 100k)
Earned income credit: $1,742 (reported on 9.5% of returns)
Here:
$1,742
State:
$2,103
Percentage of individuals using paid preparers for their 2004 taxes: 52.2%
Here:
52%
State:
61%
(% for various income ranges: 46.9% for AGIs below $10k, 52.5% for AGIs $10k-25k, 46.4% for AGIs $25k-50k, 51.8% for AGIs $50k-75k, 52.3% for AGIs $75k-100k, 66.4% for AGIs over 100k)
Likely homosexual households (counted as self-reported same-sex unmarried-partner households)
Lesbian couples: 0.2% of all households
Gay men: 0.5% of all households
Household received Food Stamps/SNAP in the past 12 months: 397 Household did not receive Food Stamps/SNAP in the past 12 months: 11,471
Women who had a birth in the past 12 months: 347 (290 now married, 48 unmarried) Women who did not have a birth in the past 12 months: 6,765 (2,462 now married, 4,305 unmarried)
Housing units in zip code 70809 with a mortgage: 3,932 (285 second mortgage, 217 both second mortgage and home equity loan) Houses without a mortgage: 178
Median monthly owner costs for units with a mortgage: $1,711 Median monthly owner costs for units without a mortgage: $605
Residents with income below the poverty level in 2022:
This zip code:
8.0%
Whole state:
18.6%
Residents with income below 50% of the poverty level in 2022:
This zip code:
3.1%
Whole state:
10.1%
Median number of rooms in houses and condos:
Here:
6.3
State:
6.2
Median number of rooms in apartments:
Here:
4.0
State:
4.4
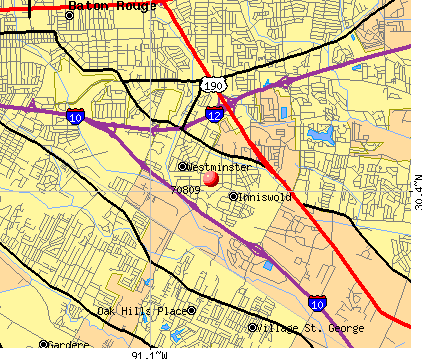
Notable locations in this zip code not listed on our city pages
Notable locations in zip code 70809: Baton Rouge Industiplex (A), Baton Rouge Country Club (B), Towne Center at Cedar Lodge (C), Mall of Louisiana (D), Louisiana State University Burden Center (E), Saint Marie Golf Course (F), Sage Rehabilitation Hospital (G), Jefferson Manor Nursing and Rehabilitation Center (H), Lesco Service Center (I), Lakewood Quarters Assisted Living Facility (J), Saint George Fire Department Station 67 (K), Saint George Fire Department Station 62 (L), Lakewood Quarters Rehabilitation and Nursing Center (M), Landmark of Baton Rouge (N), Ollie Steele Burden Manor (O), Ochsner Health Center Jefferson Place (P), Sunrise Assisted Living of Baton Rouge (Q), Louisiana State University Rural Life Museum (R), Louisiana State Archives (S). Display/hide their locations on the map
Shopping Centers: Interstate Shopping Center (1), Cedar Crest Shopping Center (2), Siegen Village Shopping Center (3), Tara Place Shopping Center (4), Universal Plaza Shopping Center (5), Drusilla Shopping Center (6), Bocage Village Shopping Center (7). Display/hide their locations on the map
Churches in zip code 70809 include: Jefferson Baptist Church (A), Datta Temple and Hall of Trinity (B), Cathedral World Worship Center (C), Bethany World Prayer Center (D), Community Bible Church (E), Beth Shalom Synagogue (F), Jefferson Baptist Church (G), Bethel Temple Assembly of God Church (H), Trinity Fellowship Baptist Church (I). Display/hide their locations on the map
In group quarters: 394 (-1 institutionalized population)
Size of family households: 3,007 2-persons, 1,971 3-persons, 844 4-persons, 424 5-persons, 102 6-persons, 58 7-or-more-persons
Size of nonfamily households: 5,029 1-person, 641 2-persons, 133 3-persons
2,329 married couples with children.
1,758 single-parent households (227 men, 1,531 women).
88.2% of residents of 70809 zip code speak English at home.
3.4% of residents speak Spanish at home (45% very well, 11% well, 15% not well, 28% not at all).
3.4% of residents speak other Indo-European language at home (65% very well, 27% well, 8% not well).
3.0% of residents speak Asian or Pacific Island language at home (57% very well, 35% well, 8% not well).
2.1% of residents speak other language at home (72% very well, 11% well, 17% not well).
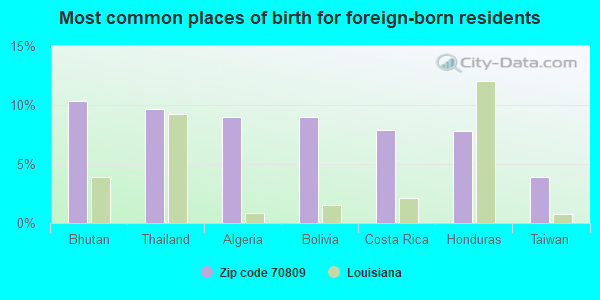
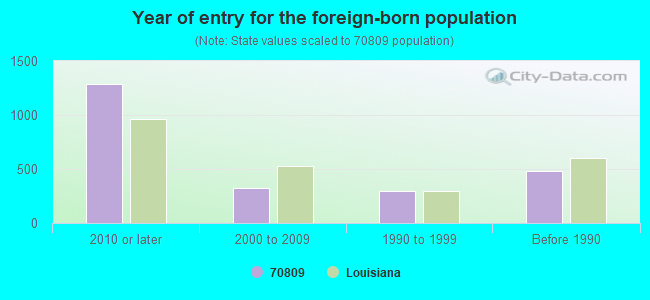
Foreign born population: 2,173 (8.2%) (35.2% of them are naturalized citizens)
Major facilities with environmental interests located in this zip code:
BATON ROUGE COCA COLA BOTTLING COMPANY (10000 DAWNADELE AVE. in BATON ROUGE, LA)
National Pollutant Discharge Elimination System NON-MAJOR (Tracking pollutant discharge elimination systems) - permit National Pollutant Discharge Elimination System NON-MAJOR (Tracking pollutant discharge elimination systems) - permit National Pollutant Discharge Elimination System NON-MAJOR (Tracking pollutant discharge elimination systems) - permit Conditionally Exempt Small Quantity Generators, less than 100 kg/month of hazardous waste (Resource Conservation and Recovery Act (tracking hazardous waste)) - notification TRI REPORTER (Tracking of toxic chemicals releasing facilities) Business SIC classification: BOTTLED AND CANNED SOFT DRINKS AND CARBONATED WATERS Organizations: COCA-COLA BOTTLING CO. UNITED, INC. (CONTACT/OWNER)
Alternative names: BATON ROUGE COCO COLA BOTTLING CO
AVERITT EXPRESS (11601 REIGER RD in BATON ROUGE, LA)
National Pollutant Discharge Elimination System NON-MAJOR (Tracking pollutant discharge elimination systems) - permit National Pollutant Discharge Elimination System NON-MAJOR (Tracking pollutant discharge elimination systems) - permit Conditionally Exempt Small Quantity Generators, less than 100 kg/month of hazardous waste (Resource Conservation and Recovery Act (tracking hazardous waste))
BATON ROUGE HELICOPTERS, INC. (9330 PECUE LN in BATON ROUGE, LA)
(Integrated Compliance Information System) - ICIS-06-2002-4301, FORMAL ENFORCEMENT ACTION, ICIS-06-2001-4369, Business SIC classification: AIRCRAFT
RACETRAC #373 (6240 BLUEBONNET BLVD in BATON ROUGE, LA)
(Integrated Compliance Information System) - ICIS-06-2000-0560, FORMAL ENFORCEMENT ACTION Business SIC classification: GROCERY STORES; GASOLINE SERVICE STATIONS
ASPHALT PLANT NO. 3 (5253 MANCUSO LANE in BATON ROUGE, LA)
(Integrated Compliance Information System) - ICIS-06-2001-5115, FORMAL ENFORCEMENT ACTION Business SIC classification: ASPHALT PAVING MIXTURES AND BLOCKS; READY-MIXED CONCRETE Alternative names: ASPHALT PLANT 3, BARBER BROTHERS CONTRACTING, BARBER BROS CONTRAC-ASPHALT PL
BFI CSI SIEGEN LANE FACILITY (5757 SIEGEN LANE in BATON ROUGE, LA)
HAZARDOUS WASTE BIENNIAL REPORTER (Resource Conservation and Recovery Act (tracking hazardous waste)) Large Quantity Generators, more that 1000 kg of hazardous waste/month (Resource Conservation and Recovery Act (tracking hazardous waste)) - notification Business NAICS classification: HAZARDOUS WASTE TREATMENT AND DISPOSAL. Organizations: BEL CHEMICAL SERVICES INC (CONTACT/OPERATOR)
, BROWNING FERRIS INDUSTRIES (CONTACT/OWNER)
Alternative names: BROWNING FERRIS INDUSTRIES, BROWNING FERRIS IND CHEMICAL SERVICES
BARBER BROTHERS CONTRACTING CO LLC - ASP (5253 MANCUSO LN in BATON ROUGE, LA)
AIR MINOR (AIRS/AFS) Business SIC classification: ASPHALT PAVING MIXTURES AND BLOCKS Alternative names: BARBER ASPHALT PLANT NUMBER 3, BARBER/MANCUSO PLT, BARBER SN 102542 INC, FRANK PANEPINTO
NORTH AMERICAN HYDRAULICS (11549 SUNBELT COURT in BATON ROUGE, LA)
(Resource Conservation and Recovery Act (tracking hazardous waste)) Business NAICS classification: FARM MACHINERY AND EQUIPMENT MANUFACTURING. Organizations: JOHN NESWADI (CONTACT/OPERATOR)
ABB SVC CO BATON ROUGE FACILITY (5809 MCCANN DR in BATON ROUGE, LA)
(Resource Conservation and Recovery Act (tracking hazardous waste)) Business NAICS classification: SWITCHGEAR AND SWITCHBOARD APPARATUS MANUFACTURING.
ACE AUTO RPR (12241 INDUSTRIPLEX STE A in BATON ROUGE, LA)
ADVANCED OFFICE SYS (11434 INDUSTRIPLEX in BATON ROUGE, LA)
(Resource Conservation and Recovery Act (tracking hazardous waste)) Organizations: ADVANCED OFFICE SYSTEMS (CONTACT/OWNER)
GULF INTERCOASTAL MARINE INC (8116 ONE CALAIS SUITE 1C in BATON ROUGE, LA)
(Resource Conservation and Recovery Act (tracking hazardous waste)) Organizations: DAVID M. NEHER & FRED H. FENN JR. (CONTACT/OWNER)
GULF NATIONAL INC (11910 SUNBELT CT STE 2 in BATON ROUGE, LA)
(Resource Conservation and Recovery Act (tracking hazardous waste)) Business NAICS classification: OTHER BUSINESS SERVICE CENTERS (INCLUDING COPY SHOPS). Organizations: NATIONAL GROUP (CONTACT/OWNER)
Housing units lacking complete plumbing facilities: 0.9% Housing units lacking complete kitchen facilities: 3.2%
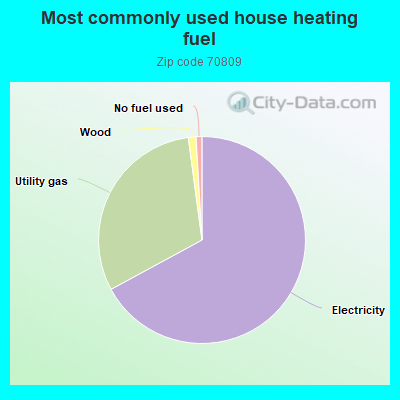
66.7%Electricity
30.6%Utility gas
1.2%Wood
0.9%No fuel used
Population in 1990: 15,623. Population change in the 1990s: +3,774 (+24.2%).
Place of birth for U.S.-born residents:
This state: 19,049
Northeast: 483
Midwest: 1,148
South: 2,837
West: 504
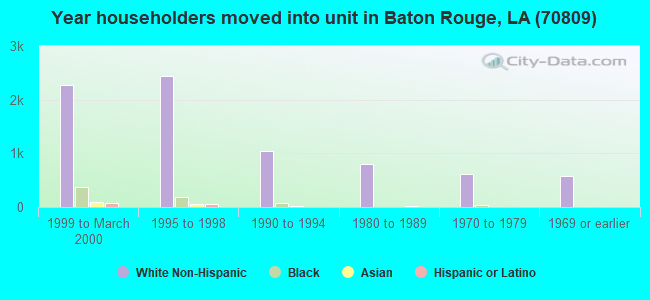
42% of the 70809 zip code residents lived in the same house 5 years ago. Out of people who lived in different houses, 58% lived in this county. Out of people who lived in different counties, 50% lived in Louisiana.
87% of the 70809 zip code residents lived in the same house 1 year ago. Out of people who lived in different houses, 53% moved from this county. Out of people who lived in different houses, 25% moved from different county within same state. Out of people who lived in different houses, 10% moved from different state. Out of people who lived in different houses, 14% moved from abroad.
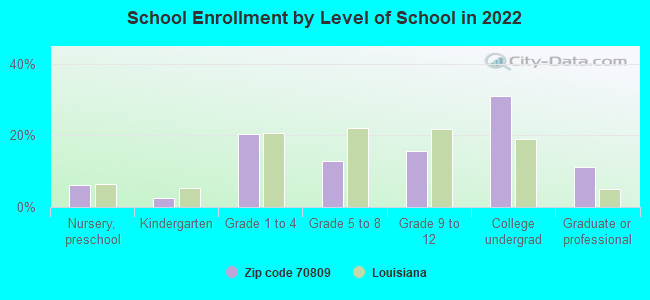
Private vs. public school enrollment:
Students in private schools in grades 1 to 8 (elementary and middle school): 955
Here:
40.1%
Louisiana:
19.6%
Students in private schools in grades 9 to 12 (high school): 421
Here:
38.3%
Louisiana:
18.3%
Students in private undergraduate colleges: 182
Here:
8.5%
Louisiana:
17.4%
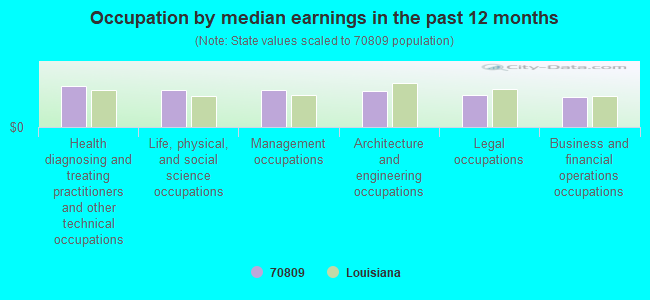
Occupation by median earnings in the past 12 months ($)
96,248Health diagnosing and treating practitioners and other technical occupations
87,551Life, physical, and social science occupations
87,475Management occupations
85,340Architecture and engineering occupations
74,357Legal occupations
70,415Business and financial operations occupations
Companies with biggest federal contracts located in this zip code (BATON ROUGE, LA):
SHAW ENVIRONMENTAL, INC (4171 ESSEN LANE) : $137,658,759 in 191 contractsfrom 2003 to 2006
Contracts for Construction of Structures and Facilities -- Other Non-Building Facilities, Construction of Structures and Facilities -- Other Conservation and Development Facilities, Construction of Structures and Facilities -- Miscellaneous Buildings, Hazardous Substance Removal, Cleanup, and Disposal Services and Operational Support, and moreby Army, U.S. Army Corps of Engineers - civil program financing only, Navy Signed by year:2000: $0; 2001: $0; 2002: $0; 2003: $1,158,947; 2004: $44,601,259; 2005: $44,572,723; 2006: $47,325,830.
Biggest contracts:
$28,047,293 with Army for Construction of Structures and Facilities -- Other Non-Building Facilities. Signed on 2006-01-30. Completion date: 2006-11-30.
$18,246,770, same as above.Signed on 2006-01-27. Completion date: 2006-11-30.
$13,000,000 with Army for Construction of Structures and Facilities -- Other Conservation and Development Facilities. Signed on 2005-09-23. Completion date: 2006-09-30.
$13,000,000 with U.S. Army Corps of Engineers - civil program financing only for Construction of Structures and Facilities -- Other Conservation and Development Facilities. Signed on 2005-09-23. Completion date: 2006-09-30.
JAMES CONSTRUCTION GROUP, LLC (11200 INDUSTRIPLEX BLVD ST) : $92,720,162 in 189 contractsfrom 1999 to 2006
Contracts for Construction of Structures and Facilities -- Other Non-Building Facilities by Army, U.S. Army Corps of Engineers - civil program financing only Signed by year:2000: $5,302,363; 2001: $8,455,531; 2002: $11,273,345; 2003: $11,339,215; 2004: $7,949,701; 2005: $35,017,829; 2006: $12,036,070.
Biggest contracts:
$30,675,000 with Army for Construction of Structures and Facilities -- Other Non-Building Facilities. Signed on 2005-11-14. Completion date: 2006-04-01.
$9,781,825, same as above.Signed on 2006-02-24. Completion date: 2006-10-27.
$2,764,665, same as above.Signed on 2005-10-26. Completion date: 2006-04-01.
$2,058,228 with U.S. Army Corps of Engineers - civil program financing only for Construction of Structures and Facilities -- Other Non-Building Facilities. Signed on 2000-12-21. Completion date: 1999-05-20.
G E C , INC (9357 INTERLINE AVENUE) : $38,248,414 in 593 contractsfrom 1999 to 2006
Contracts for Environmental Studies and Assessments, Other Environmental Services, Studies, and Analytical Support, Architect - Engineer Services (including landscaping, interior layout, and designing), Archeological/Paleontological Studies, and moreby U.S. Army Corps of Engineers - civil program financing only, Army, Air Force, Natural Resources Conservation Service, and others Signed by year:2000: $5,595,281; 2001: $4,805,467; 2002: $3,886,627; 2003: $4,813,712; 2004: $7,729,972; 2005: $8,186,868; 2006: $2,924,708.
Biggest contracts:
$1,299,697 with U.S. Army Corps of Engineers - civil program financing only for Environmental Studies and Assessments. Taking place in TX. Signed on 2003-06-17. Completion date: 2003-09-27.
$1,116,422 with Army for Other Environmental Services, Studies, and Analytical Support. Taking place in MO. Signed on 2004-09-28. Completion date: 2006-09-28.
$624,477 with U.S. Army Corps of Engineers - civil program financing only for Architect - Engineer Services (including landscaping, interior layout, and designing). Signed on 2001-04-24. Completion date: 2001-04-20.
$518,873 with Army for Architect - Engineer Services (including landscaping, interior layout, and designing). Signed on 2006-06-09. Completion date: 2006-10-12.
Contracts for Construction of Structures and Facilities -- Restoration of real property, Maintenance, Repair or Alteration of Real Property -- Maintenance Buildings by Army, U.S. Army Corps of Engineers - civil program financing only Signed by year:2000: $0; 2001: $0; 2002: $0; 2003: $0; 2004: $0; 2005: $34,325,705; 2006: $0.
Biggest contracts:
$10,998,644 with Army for Construction of Structures and Facilities -- Restoration of real property. Signed on 2005-10-26. Completion date: 2006-09-11.
$6,382,695, same as above.Signed on 2005-11-11. Completion date: 2005-11-30.
$5,196,977, same as above.Signed on 2005-10-21. Completion date: 2006-09-05.
$4,997,070, same as above.Signed on 2005-10-07. Completion date: 2005-11-30.
SHAW ENVIRONMENTAL & INFRASTRU (4171 ESSEN LN) : $33,207,646 in 22 contractsfrom 2002 to 2006
Contracts for Prefabricated and Portable Buildings, Construction of Structures and Facilities -- Other Non-Building Facilities, Construction of Structures and Facilities -- Restoration of real property, Miscellaneous Prefabricated Structures by Army, U.S. Army Corps of Engineers - civil program financing only Signed by year:2000: $0; 2001: $0; 2002: $1,671,551; 2003: $8,601,292; 2004: $0; 2005: $17,891,755; 2006: $5,043,048.
Biggest contracts:
$8,431,291 with Army for Prefabricated and Portable Buildings. Signed on 2005-12-07. Completion date: 2006-02-13.
$7,879,958 with Army for Construction of Structures and Facilities -- Other Non-Building Facilities. Signed on 2005-12-03. Completion date: 2006-04-01.
$5,200,000 with U.S. Army Corps of Engineers - civil program financing only for Construction of Structures and Facilities -- Restoration of real property. Taking place in FL. Signed on 2003-03-13. Completion date: 2003-01-31.
$4,276,979 with Army for Construction of Structures and Facilities -- Other Non-Building Facilities. Signed on 2006-03-15. Completion date: 2006-04-01.
ENVIRONMENTAL SPECIALTIES INTE (7943 PECUE LANE, SUITE A; small business) : $4,516,590 in 10 contractsfrom 2002 to 2004
Contracts for Maintenance, Repair or Alteration of Real Property -- Other Non-Building Facilities by U.S. Army Corps of Engineers - civil program financing only, Army Signed by year:2000: $0; 2001: $0; 2002: $1,202,063; 2003: $2,873,265; 2004: $441,262; 2005: $0; 2006: $0.
Biggest contracts:
$1,420,223 with U.S. Army Corps of Engineers - civil program financing only for Maintenance, Repair or Alteration of Real Property -- Other Non-Building Facilities. Taking place in DE. Signed on 2003-04-08. Completion date: 2003-11-11.
$611,951, same as above.Signed on 2003-09-15. Completion date: 2003-11-11.
$541,091, same as above.Signed on 2003-06-18. Completion date: 2003-11-11.
$502,063, same as above.Signed on 2002-12-24. Completion date: 2003-08-29.
JAMES INDUSTRIAL CONSTRUCTORS, (11200 INDUSTRIPLEX BLVD) : $3,646,275 in 5 contractsfrom 1999 to 2005
Contracts for Construction of Structures and Facilities -- Other Non-Building Facilities by U.S. Army Corps of Engineers - civil program financing only, Army Signed by year:2000: $1,448,275; 2001: $0; 2002: $0; 2003: $0; 2004: $0; 2005: $306,000; 2006: $0.
Biggest contracts:
$1,892,000 with U.S. Army Corps of Engineers - civil program financing only for Construction of Structures and Facilities -- Other Non-Building Facilities. Signed on 1999-12-02. Completion date: 1999-05-20.
$650,000, same as above.Signed on 2000-05-23. Completion date: 1999-05-20.
$600,000, same as above.Signed on 2000-06-27. Completion date: 1999-05-20.
$306,000 with Army for Construction of Structures and Facilities -- Other Non-Building Facilities. Signed on 2005-10-14. Completion date: 1999-05-20.
TOPCOR SERVICES INC (12025 INDUSTRIPLEX BLVD; small business) : $2,802,629 in 14 contractsfrom 2005 to 2006
Contracts for Maintenance, Repair or Alteration of Real Property -- Highways, Roads, Streets, Bridges, and Railways (includes resurfacing), Construction of Structures and Facilities -- Other Non-Building Facilities by Navy, Army, U.S. Army Corps of Engineers - civil program financing only Signed by year:2000: $0; 2001: $0; 2002: $0; 2003: $0; 2004: $0; 2005: $2,799,851; 2006: $2,778.
Biggest contracts:
$2,487,689 with Navy for Maintenance, Repair or Alteration of Real Property -- Highways, Roads, Streets, Bridges, and Railways (includes resurfacing). Taking place in SC. Signed on 2005-09-22. Completion date: 2006-05-17.
$127,714 with Army for Construction of Structures and Facilities -- Other Non-Building Facilities. Taking place in MS. Signed on 2005-02-17. Completion date: 2005-02-28.
$127,714 with U.S. Army Corps of Engineers - civil program financing only for Construction of Structures and Facilities -- Other Non-Building Facilities. Taking place in MS. Signed on 2005-02-17. Completion date: 2005-02-28.
$60,300 with Army for Construction of Structures and Facilities -- Other Non-Building Facilities. Taking place in MS. Signed on 2005-02-08. Completion date: 2005-03-15.
HNTB CORPORATION (9100 BLUEBONNET CENTRE BLV) : $2,134,628 in 15 contractsfrom 2004 to 2006
Contracts for Other Architect and Engineering Services, Architect - Engineer Services (including landscaping, interior layout, and designing) by Army, U.S. Army Corps of Engineers - civil program financing only Signed by year:2000: $0; 2001: $0; 2002: $0; 2003: $0; 2004: $300,000; 2005: $732,898; 2006: $1,101,730.
Biggest contracts:
$801,730 with Army for Other Architect and Engineering Services. Signed on 2006-06-23. Completion date: 2006-06-21.
$400,000 with Army for Architect - Engineer Services (including landscaping, interior layout, and designing). Signed on 2004-08-27. Completion date: 2006-02-22.
$400,000 with U.S. Army Corps of Engineers - civil program financing only for Architect - Engineer Services (including landscaping, interior layout, and designing). Signed on 2004-08-27. Completion date: 2006-02-22.
$280,000 with Army for Other Architect and Engineering Services. Signed on 2006-04-14. Completion date: 2006-04-14.
RHORER-MONIOTTE INVESTMENTS LL (19151 HIGHLAND RD) : $597,103 in 3 contractsfrom 2002 to 2005
$236,267 with Air Force for Valves, Powered. Signed on 2005-05-13. Completion date: 2005-09-30.
$192,942, same as above.Signed on 2002-09-27. Completion date: 2003-05-27.
$167,894, same as above.Signed on 2004-12-02. Completion date: 2005-02-28.
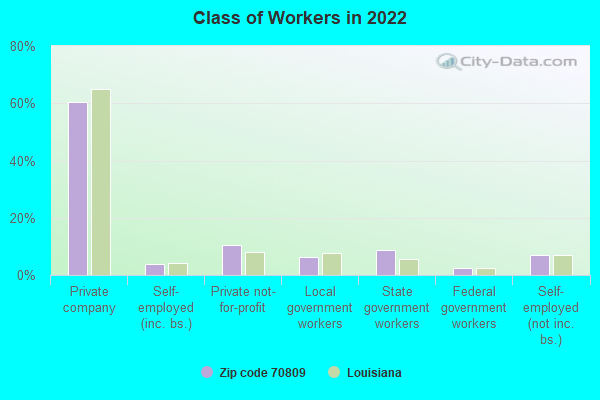
Top industries in this zip code by the number of employees in 2005:
Construction: Industrial Building Construction (over 1000: 1, 100-249: 1, 10-19: 1, 5-9: 1, 1-4: 1)
Construction: Oil and Gas Pipeline and Related Structures Construction (over 1000: 1, 20-49: 1, 10-19: 1, 1-4: 2)
Administrative and Support and Waste Management and Remediation Services: Temporary Help Services (250-499: 2, 100-249: 2, 50-99: 3, 20-49: 3, 1-4: 4)
Health Care and Social Assistance: Offices of Physicians (except Mental Health Specialists) (250-499: 1, 100-249: 2, 50-99: 3, 20-49: 6, 10-19: 6, 5-9: 8, 1-4: 28)
Other Services (except Public Administration): Commercial and Industrial Machinery and Equipment (except Automotive and Electronic) Repair and Maintenance (500-999: 1, 50-99: 1, 20-49: 2, 10-19: 5, 5-9: 4, 1-4: 3)
People in group quarters in 2010:
417 people in nursing facilities/skilled-nursing facilities
12 people in other noninstitutional facilities
6 people in group homes intended for adults
5 people in residential treatment centers for adults
People in group quarters in 2000:
410 people in nursing homes
137 people in other noninstitutional group quarters
54 people in orthopedic wards and institutions for the physically handicapped
29 people in religious group quarters
11 people in homes for the mentally retarded
Fatal accident statistics in 2014:
Fatal accident count: 7
Vehicles involved in fatal accidents: 12
Fatal accidents caused by drunken drivers: 1
Fatalities: 7
Persons involved in fatal accidents: 14
Pedestrians involved in fatal accidents: 3
Fatal accident statistics in 2013:
Fatal accident count: 3
Vehicles involved in fatal accidents: 7
Fatal accidents caused by drunken drivers: 0
Fatalities: 3
Persons involved in fatal accidents: 8
Pedestrians involved in fatal accidents: 1
Home Mortgage Disclosure Act Aggregated Statistics For Year 2009 (Based on 4 full and 6 partial tracts)
A) FHA, FSA/RHS & VA Home Purchase Loans
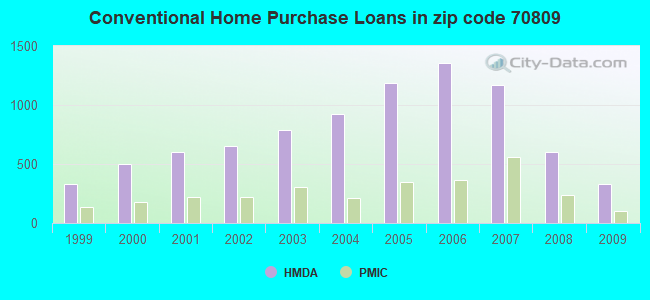
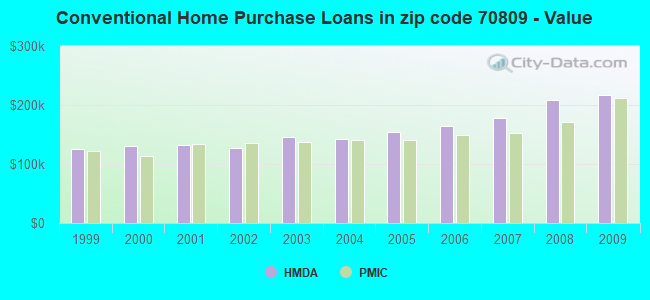
B) Conventional Home Purchase Loans
C) Refinancings
D) Home Improvement Loans
E) Loans on Dwellings For 5+ Families
F) Non-occupant Loans on < 5 Family Dwellings (A B C & D)
G) Loans On Manufactured Home Dwelling (A B C & D)
Number
Average Value
Number
Average Value
Number
Average Value
Number
Average Value
Number
Average Value
Number
Average Value
Number
Average Value
LOANS ORIGINATED
226
$150,432
328
$216,215
1,039
$219,432
72
$68,458
4
$3,986,855
93
$234,756
1
$29,920
APPLICATIONS APPROVED, NOT ACCEPTED
7
$164,889
23
$216,362
96
$189,917
1
$59,840
0
$0
5
$145,792
0
$0
APPLICATIONS DENIED
48
$137,350
42
$144,758
310
$201,583
47
$45,586
0
$0
41
$108,222
6
$23,300
APPLICATIONS WITHDRAWN
25
$163,055
58
$238,764
222
$207,028
5
$55,004
0
$0
7
$99,941
0
$0
FILES CLOSED FOR INCOMPLETENESS
6
$174,778
9
$333,910
74
$216,313
2
$130,365
0
$0
1
$63,080
0
$0
Aggregated Statistics For Year 2008 (Based on 4 full and 6 partial tracts)
A) FHA, FSA/RHS & VA Home Purchase Loans
B) Conventional Home Purchase Loans
C) Refinancings
D) Home Improvement Loans
E) Loans on Dwellings For 5+ Families
F) Non-occupant Loans on < 5 Family Dwellings (A B C & D)
G) Loans On Manufactured Home Dwelling (A B C & D)
Number
Average Value
Number
Average Value
Number
Average Value
Number
Average Value
Number
Average Value
Number
Average Value
Number
Average Value
LOANS ORIGINATED
154
$147,528
600
$209,106
557
$205,410
71
$94,694
4
$720,545
160
$204,826
5
$24,894
APPLICATIONS APPROVED, NOT ACCEPTED
12
$145,232
78
$201,191
97
$176,760
11
$78,388
1
$286,740
21
$95,415
4
$58,482
APPLICATIONS DENIED
23
$146,543
99
$191,795
255
$184,445
72
$86,565
0
$0
25
$117,110
8
$55,112
APPLICATIONS WITHDRAWN
16
$156,631
64
$244,324
91
$226,549
10
$144,673
0
$0
11
$153,875
5
$41,820
FILES CLOSED FOR INCOMPLETENESS
2
$107,940
16
$214,072
28
$223,710
1
$300,760
0
$0
2
$149,140
0
$0
Aggregated Statistics For Year 2007 (Based on 4 full and 6 partial tracts)
A) FHA, FSA/RHS & VA Home Purchase Loans
B) Conventional Home Purchase Loans
C) Refinancings
D) Home Improvement Loans
E) Loans on Dwellings For 5+ Families
F) Non-occupant Loans on < 5 Family Dwellings (A B C & D)
G) Loans On Manufactured Home Dwelling (A B C & D)
Number
Average Value
Number
Average Value
Number
Average Value
Number
Average Value
Number
Average Value
Number
Average Value
Number
Average Value
LOANS ORIGINATED
36
$135,380
1,169
$177,238
498
$177,108
114
$62,004
5
$5,835,330
172
$149,744
8
$39,329
APPLICATIONS APPROVED, NOT ACCEPTED
8
$156,644
251
$143,613
122
$196,357
11
$125,543
0
$0
22
$130,098
5
$30,426
APPLICATIONS DENIED
4
$145,092
178
$160,196
256
$174,323
65
$68,676
0
$0
33
$136,068
16
$50,661
APPLICATIONS WITHDRAWN
4
$161,500
116
$156,114
118
$186,700
7
$75,013
0
$0
6
$171,128
4
$30,080
FILES CLOSED FOR INCOMPLETENESS
0
$0
35
$160,327
28
$191,770
1
$149,600
0
$0
4
$104,510
0
$0
Aggregated Statistics For Year 2006 (Based on 4 full and 6 partial tracts)
A) FHA, FSA/RHS & VA Home Purchase Loans
B) Conventional Home Purchase Loans
C) Refinancings
D) Home Improvement Loans
E) Loans on Dwellings For 5+ Families
F) Non-occupant Loans on < 5 Family Dwellings (A B C & D)
G) Loans On Manufactured Home Dwelling (A B C & D)
Number
Average Value
Number
Average Value
Number
Average Value
Number
Average Value
Number
Average Value
Number
Average Value
Number
Average Value
LOANS ORIGINATED
46
$144,387
1,357
$163,711
590
$158,631
118
$69,059
5
$2,008,186
309
$113,094
15
$30,841
APPLICATIONS APPROVED, NOT ACCEPTED
6
$67,210
218
$127,744
117
$160,928
20
$122,622
0
$0
27
$74,483
12
$31,137
APPLICATIONS DENIED
4
$98,500
199
$133,814
280
$157,747
97
$60,415
2
$98,760
53
$118,131
24
$50,867
APPLICATIONS WITHDRAWN
2
$125,725
164
$568,415
168
$191,413
23
$90,552
1
$34,410
28
$2,545,191
0
$0
FILES CLOSED FOR INCOMPLETENESS
3
$105,453
47
$139,118
88
$166,266
1
$93,350
0
$0
19
$132,252
0
$0
Aggregated Statistics For Year 2005 (Based on 4 full and 6 partial tracts)
A) FHA, FSA/RHS & VA Home Purchase Loans
B) Conventional Home Purchase Loans
C) Refinancings
D) Home Improvement Loans
E) Loans on Dwellings For 5+ Families
F) Non-occupant Loans on < 5 Family Dwellings (A B C & D)
G) Loans On Manufactured Home Dwelling (A B C & D)
Number
Average Value
Number
Average Value
Number
Average Value
Number
Average Value
Number
Average Value
Number
Average Value
Number
Average Value
LOANS ORIGINATED
33
$124,702
1,186
$154,100
603
$148,697
76
$61,623
3
$560,627
205
$121,570
8
$35,092
APPLICATIONS APPROVED, NOT ACCEPTED
1
$91,760
187
$125,297
156
$119,718
19
$44,881
0
$0
26
$103,827
6
$58,890
APPLICATIONS DENIED
4
$68,148
182
$125,230
327
$135,503
82
$35,511
0
$0
37
$160,682
8
$26,604
APPLICATIONS WITHDRAWN
8
$128,719
134
$154,624
244
$166,425
29
$139,507
0
$0
29
$122,328
2
$13,000
FILES CLOSED FOR INCOMPLETENESS
1
$114,890
70
$128,734
58
$178,666
2
$147,025
0
$0
9
$129,370
0
$0
Aggregated Statistics For Year 2004 (Based on 4 full and 6 partial tracts)
A) FHA, FSA/RHS & VA Home Purchase Loans
B) Conventional Home Purchase Loans
C) Refinancings
D) Home Improvement Loans
E) Loans on Dwellings For 5+ Families
F) Non-occupant Loans on < 5 Family Dwellings (A B C & D)
G) Loans On Manufactured Home Dwelling (A B C & D)
Number
Average Value
Number
Average Value
Number
Average Value
Number
Average Value
Number
Average Value
Number
Average Value
Number
Average Value
LOANS ORIGINATED
77
$116,822
923
$142,566
750
$148,668
83
$47,923
4
$863,212
136
$106,657
5
$37,030
APPLICATIONS APPROVED, NOT ACCEPTED
7
$83,027
111
$127,273
174
$139,577
12
$29,579
0
$0
22
$103,877
5
$39,586
APPLICATIONS DENIED
20
$82,284
118
$114,594
364
$130,601
56
$37,076
0
$0
22
$91,876
23
$47,055
APPLICATIONS WITHDRAWN
15
$100,661
68
$141,691
264
$147,808
13
$89,283
2
$3,456,600
26
$89,261
1
$31,860
FILES CLOSED FOR INCOMPLETENESS
2
$144,000
28
$187,288
50
$143,236
6
$47,942
0
$0
0
$0
0
$0
Aggregated Statistics For Year 2003 (Based on 4 full and 6 partial tracts)
A) FHA, FSA/RHS & VA Home Purchase Loans
B) Conventional Home Purchase Loans
C) Refinancings
D) Home Improvement Loans
E) Loans on Dwellings For 5+ Families
F) Non-occupant Loans on < 5 Family Dwellings (A B C & D)
Number
Average Value
Number
Average Value
Number
Average Value
Number
Average Value
Number
Average Value
Number
Average Value
LOANS ORIGINATED
91
$106,095
787
$146,157
1,787
$141,910
74
$36,907
2
$197,520
169
$97,416
APPLICATIONS APPROVED, NOT ACCEPTED
3
$71,130
72
$140,897
280
$130,222
24
$42,031
3
$2,177,000
9
$87,901
APPLICATIONS DENIED
0
$0
55
$137,991
369
$129,620
32
$23,226
0
$0
21
$90,106
APPLICATIONS WITHDRAWN
5
$116,706
63
$152,705
274
$144,394
0
$0
0
$0
18
$90,022
FILES CLOSED FOR INCOMPLETENESS
6
$123,585
13
$225,687
53
$172,124
2
$27,495
1
$1,593,000
0
$0
Aggregated Statistics For Year 2002 (Based on 4 full and 4 partial tracts)
A) FHA, FSA/RHS & VA Home Purchase Loans
B) Conventional Home Purchase Loans
C) Refinancings
D) Home Improvement Loans
E) Loans on Dwellings For 5+ Families
F) Non-occupant Loans on < 5 Family Dwellings (A B C & D)
Number
Average Value
Number
Average Value
Number
Average Value
Number
Average Value
Number
Average Value
Number
Average Value
LOANS ORIGINATED
132
$90,090
650
$127,816
999
$132,486
85
$23,874
2
$132,000
149
$92,438
APPLICATIONS APPROVED, NOT ACCEPTED
6
$89,213
39
$118,095
138
$129,056
9
$29,361
0
$0
14
$81,400
APPLICATIONS DENIED
16
$99,065
70
$83,614
179
$113,220
27
$29,384
2
$422,000
18
$98,824
APPLICATIONS WITHDRAWN
9
$86,660
31
$140,140
125
$118,823
4
$53,482
0
$0
10
$109,322
FILES CLOSED FOR INCOMPLETENESS
0
$0
2
$76,355
55
$141,685
0
$0
0
$0
3
$74,223
Aggregated Statistics For Year 2001 (Based on 4 full and 4 partial tracts)
A) FHA, FSA/RHS & VA Home Purchase Loans
B) Conventional Home Purchase Loans
C) Refinancings
D) Home Improvement Loans
E) Loans on Dwellings For 5+ Families
F) Non-occupant Loans on < 5 Family Dwellings (A B C & D)
Number
Average Value
Number
Average Value
Number
Average Value
Number
Average Value
Number
Average Value
Number
Average Value
LOANS ORIGINATED
86
$99,898
602
$131,673
864
$127,265
70
$30,453
2
$987,600
91
$84,614
APPLICATIONS APPROVED, NOT ACCEPTED
5
$73,856
24
$108,981
103
$92,121
15
$34,560
0
$0
6
$60,312
APPLICATIONS DENIED
6
$103,310
53
$92,972
197
$94,471
20
$13,904
1
$382,320
12
$81,856
APPLICATIONS WITHDRAWN
18
$94,928
38
$120,658
184
$124,331
2
$20,000
0
$0
10
$111,157
FILES CLOSED FOR INCOMPLETENESS
6
$114,595
9
$99,640
49
$124,932
0
$0
0
$0
6
$21,800
Aggregated Statistics For Year 2000 (Based on 4 full and 4 partial tracts)
A) FHA, FSA/RHS & VA Home Purchase Loans
B) Conventional Home Purchase Loans
C) Refinancings
D) Home Improvement Loans
E) Loans on Dwellings For 5+ Families
F) Non-occupant Loans on < 5 Family Dwellings (A B C & D)
Number
Average Value
Number
Average Value
Number
Average Value
Number
Average Value
Number
Average Value
Number
Average Value
LOANS ORIGINATED
104
$83,638
504
$130,292
297
$99,449
106
$24,891
1
$298,850
115
$103,309
APPLICATIONS APPROVED, NOT ACCEPTED
7
$59,619
44
$121,597
65
$94,153
11
$12,870
0
$0
9
$41,109
APPLICATIONS DENIED
19
$79,506
39
$118,317
181
$81,505
38
$23,958
0
$0
16
$54,399
APPLICATIONS WITHDRAWN
6
$84,063
42
$127,562
98
$84,674
4
$19,752
0
$0
6
$49,027
FILES CLOSED FOR INCOMPLETENESS
0
$0
11
$97,900
33
$76,328
4
$42,500
0
$0
0
$0
Aggregated Statistics For Year 1999 (Based on 2 full and 3 partial tracts)
A) FHA, FSA/RHS & VA Home Purchase Loans
B) Conventional Home Purchase Loans
C) Refinancings
D) Home Improvement Loans
E) Loans on Dwellings For 5+ Families
F) Non-occupant Loans on < 5 Family Dwellings (A B C & D)
2002 - 2018 National Fire Incident Reporting System (NFIRS) incidents
According to the data from the years 2002 - 2018 the average number of fires per year is 57. The highest number of fires - 100 took place in 2016, and the least - 0 in 2005. The data has a rising trend.
When looking into fire subcategories, the most reports belonged to: Outside Fires (36.2%), and Structure Fires (33.5%).
Fire incident types reported to NFIRS in Zip Code 70809


 Nearest zip codes: 70836, 70815, 70816, 70810, 70808, 70806.


 According to the data from the years 2002 - 2018 the average number of fires per year is 57. The highest number of fires - 100 took place in 2016, and the least - 0 in 2005. The data has a rising trend.
 When looking into fire subcategories, the most reports belonged to: Outside Fires (36.2%), and Structure Fires (33.5%).