Estimated zip code population in 2022: 2,777 Zip code population in 2010: 2,704 Zip code population in 2000: 2,458
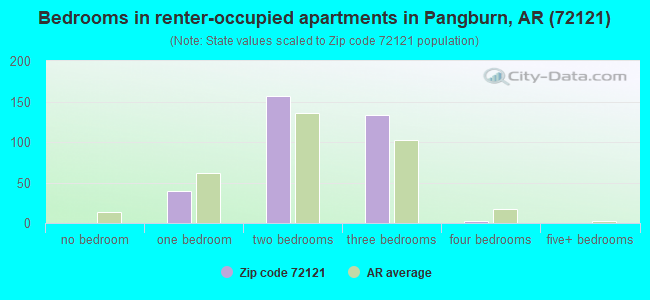
Houses and condos: 1,375 Renter-occupied apartments: 335
% of renters here:
31%
State:
34%
March 2022 cost of living index in zip code 72121: 80.1 (low, U.S. average is 100)
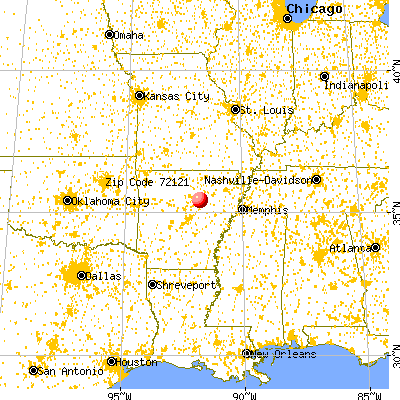
Land area: 71.5 sq. mi. Water area: 0.0 sq. mi.
Population density: 39 people per square mile
(very low).
OSM Map
General Map
Google Map
MSN Map
OSM Map
General Map
Google Map
MSN Map
OSM Map
General Map
Google Map
MSN Map
OSM Map
General Map
Google Map
MSN Map
Please wait while loading the map...
Real estate property taxes paid for housing units in 2022:
This zip code:
0.5% ($691)
Arkansas:
0.5% ($977)
Median real estate property taxes paid for housing units with mortgages in 2022: $886 (0.4%) Median real estate property taxes paid for housing units with no mortgage in 2022: $638 (0.6%)
Business Search- 14 Million verified businesses
Males: 1,406
(50.6%)
Females: 1,371
(49.4%)
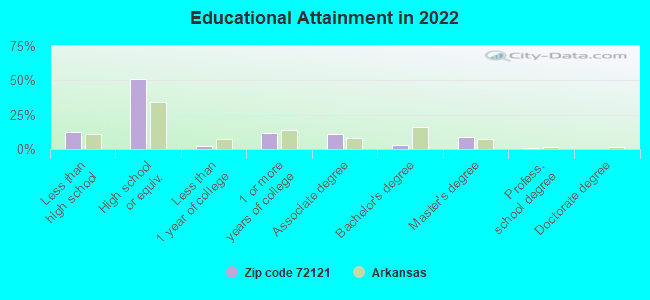
For population 25 years and over in 72121:
High school or higher: 87.4%
Bachelor's degree or higher: 11.8%
Graduate or professional degree: 9.1%
Unemployed: 3.1%
Mean travel time to work (commute): 23.7 minutes
For population 15 years and over in 72121:
Never married: 20.3%
Now married: 58.5%
Separated: 2.0%
Widowed: 8.0%
Divorced: 11.1%
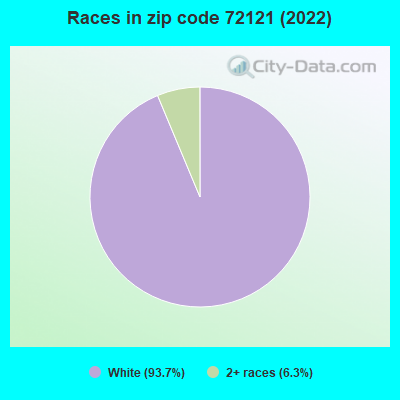
Zip code 72121 compared to state average:
Black race population percentage significantly below state average.
Hispanic race population percentage significantly below state average.
Foreign-born population percentage significantly below state average.
Length of stay since moving in significantly above state average.
Number of college students below state average.
Percentage of population with a bachelor's degree or higher significantly below state average.
Averages for the 2020 tax year for zip code 72121, filed in 2021:
Average Adjusted Gross Income (AGI) in 2020: $47,572 (Individual Income Tax Returns)
Here:
$47,572
State:
$64,872
Salary/wage: $44,535 (reported on 79.4% of returns)
Here:
$44,535
State:
$50,644
(% of AGI for various income ranges: 1210.3% for AGIs below $25k, 3550.9% for AGIs $25k-50k, 6948.2% for AGIs $50k-75k, 9901.7% for AGIs $75k-100k, 21380.0% for AGIs $100k-200k)
Taxable interest for individuals: $740 (reported on 23.4% of returns)
This zip code:
$740
Arkansas:
$1,857
(% of AGI for various income ranges: 29.3% for AGIs below $25k, 8.6% for AGIs $25k-50k, 11.8% for AGIs $50k-75k, 5.0% for AGIs $75k-100k, 103.3% for AGIs $100k-200k)
Ordinary dividends: $2,023 (reported on 12.1% of returns)
Here:
$2,023
State:
$21,681
(% of AGI for various income ranges: 25.7% for AGIs below $25k, 26.8% for AGIs $25k-50k, 41.8% for AGIs $50k-75k, 135.0% for AGIs $100k-200k)
Net capital gain/loss in AGI: +$5,855 (reported on 10.3% of returns)
Here:
+$5,855
State:
+$22,815
(% of AGI for various income ranges: 9.0% for AGIs below $25k, 41.4% for AGIs $25k-50k, 160.0% for AGIs $50k-75k, 583.3% for AGIs $100k-200k)
Profit/loss from business: +$7,984 (reported on 17.8% of returns)
Here:
+$7,984
State:
+$9,743
(% of AGI for various income ranges: 190.3% for AGIs below $25k, 275.9% for AGIs $25k-50k, 95.5% for AGIs $50k-75k, 390.0% for AGIs $75k-100k)
Taxable individual retirement arrangement distribution: $11,529 (reported on 6.5% of returns)
72121:
$11,529
Arkansas:
$18,502
(% of AGI for various income ranges: 42.3% for AGIs below $25k, 146.8% for AGIs $25k-50k, 595.0% for AGIs $75k-100k)
Total itemized deductions: $23,250 (reported on 1.9% of returns)
Here:
$23,250
State:
$52,840
(% of AGI for various income ranges: 155.0% for AGIs below $25k)
Taxes paid: $6,750 (reported on 1.9% of returns)
72121:
$6,750
State:
$7,196
(% of AGI for various income ranges: 61.4% for AGIs $25k-50k)
Earned income credit: $2,604 (reported on 23.4% of returns)
Here:
$2,604
State:
$2,546
(% of AGI for various income ranges: 146.7% for AGIs below $25k, 95.9% for AGIs $25k-50k)
Percentage of individuals using paid preparers for their 2020 taxes: 94.4%
Here:
94%
State:
94%
(% for various income ranges: 95.2% for AGIs below $25k, 92.9% for AGIs $25k-50k, 93.8% for AGIs $50k-75k, 100.0% for AGIs $75k-100k, 91.7% for AGIs $100k-200k)
Averages for the 2012 tax year for zip code 72121, filed in 2013:
Average Adjusted Gross Income (AGI) in 2012: $44,743 (Individual Income Tax Returns)
Here:
$44,743
State:
$52,148
Salary/wage: $38,610 (reported on 80.8% of returns)
Here:
$38,610
State:
$41,669
(% of AGI for various income ranges: 68.7% for AGIs below $25k, 75.1% for AGIs $25k-50k, 78.4% for AGIs $50k-75k, 72.8% for AGIs $75k-100k, 55.1% for AGIs $100k-200k)
Taxable interest for individuals: $824 (reported on 32.7% of returns)
This zip code:
$824
Arkansas:
$1,648
(% of AGI for various income ranges: 1.3% for AGIs below $25k, 0.4% for AGIs $25k-50k, 0.6% for AGIs $50k-75k, 0.5% for AGIs $75k-100k, 0.5% for AGIs $100k-200k)
Ordinary dividends: $1,086 (reported on 13.5% of returns)
Here:
$1,086
State:
$20,675
(% of AGI for various income ranges: 0.4% for AGIs $25k-50k, 0.7% for AGIs $50k-75k, 0.4% for AGIs $100k-200k)
Net capital gain/loss in AGI: +$8,770 (reported on 9.6% of returns)
Here:
+$8,770
State:
+$15,222
(% of AGI for various income ranges: 0.9% for AGIs $50k-75k, 6.8% for AGIs $100k-200k)
Profit/loss from business: +$8,383 (reported on 17.3% of returns)
Here:
+$8,383
State:
+$9,665
(% of AGI for various income ranges: 9.5% for AGIs below $25k, 4.5% for AGIs $25k-50k, 1.4% for AGIs $50k-75k, 4.5% for AGIs $75k-100k)
Taxable individual retirement arrangement distribution: $9,944 (reported on 8.7% of returns)
72121:
$9,944
Arkansas:
$13,644
(% of AGI for various income ranges: 1.8% for AGIs below $25k, 3.1% for AGIs $25k-50k, 5.1% for AGIs $75k-100k)
Total itemized deductions: $18,748 (22% of AGI, reported on 22.1% of returns)
Here:
$18,748
State:
$23,276
Here:
22.3% of AGI
State:
19.1% of AGI
(% of AGI for various income ranges: 6.1% for AGIs below $25k, 5.4% for AGIs $25k-50k, 10.1% for AGIs $50k-75k, 8.4% for AGIs $75k-100k, 14.3% for AGIs $100k-200k)
Charity contributions: $4,394 (reported on 15.4% of returns)
Here:
$4,394
State:
$5,996
(% of AGI for various income ranges: 1.3% for AGIs $25k-50k, 1.8% for AGIs $50k-75k, 1.9% for AGIs $75k-100k, 1.8% for AGIs $100k-200k)
Taxes paid: $5,296 (reported on 22.1% of returns)
72121:
$5,296
State:
$7,941
(% of AGI for various income ranges: 0.5% for AGIs below $25k, 0.9% for AGIs $25k-50k, 2.6% for AGIs $50k-75k, 2.4% for AGIs $75k-100k, 5.3% for AGIs $100k-200k)
Earned income credit: $2,218 (reported on 21.2% of returns)
Here:
$2,218
State:
$2,455
(% of AGI for various income ranges: 7.3% for AGIs below $25k, 1.2% for AGIs $25k-50k)
Percentage of individuals using paid preparers for their 2012 taxes: 75.0%
Here:
75%
State:
61%
(% for various income ranges: 70.0% for AGIs below $25k, 76.7% for AGIs $25k-50k, 75.0% for AGIs $50k-75k, 81.8% for AGIs $75k-100k, 85.7% for AGIs $100k-200k)
Averages for the 2004 tax year for zip code 72121, filed in 2005:
Average Adjusted Gross Income (AGI) in 2004: $30,119 (Individual Income Tax Returns)
Here:
$30,119
State:
$39,270
Salary/wage: $29,304 (reported on 83.2% of returns)
Here:
$29,304
State:
$34,079
(% of AGI for various income ranges: 131.0% for AGIs below $10k, 78.0% for AGIs $10k-25k, 84.5% for AGIs $25k-50k, 84.7% for AGIs $50k-75k, 76.2% for AGIs $75k-100k, 58.3% for AGIs over 100k)
Taxable interest for individuals: $1,275 (reported on 31.0% of returns)
This zip code:
$1,275
Arkansas:
$1,904
(% of AGI for various income ranges: 5.3% for AGIs below $10k, 2.5% for AGIs $10k-25k, 1.5% for AGIs $25k-50k, 0.3% for AGIs $50k-75k, 1.5% for AGIs $75k-100k, 0.5% for AGIs over 100k)
Taxable dividends: $750 (reported on 12.1% of returns)
Here:
$750
State:
$5,995
(% of AGI for various income ranges: 0.9% for AGIs below $10k, 0.5% for AGIs $10k-25k, 0.4% for AGIs $25k-50k, 0.1% for AGIs $50k-75k, 0.3% for AGIs $75k-100k)
Net capital gain/loss: +$1,796 (reported on 11.8% of returns)
Here:
+$1,796
State:
+$10,430
(% of AGI for various income ranges: -1.5% for AGIs below $10k, 0.4% for AGIs $10k-25k, 0.3% for AGIs $25k-50k, 0.9% for AGIs $50k-75k, 3.8% for AGIs $75k-100k)
Profit/loss from business: +$4,614 (reported on 19.2% of returns)
Here:
+$4,614
State:
+$7,823
(% of AGI for various income ranges: 27.6% for AGIs below $10k, 6.8% for AGIs $10k-25k, 1.5% for AGIs $25k-50k, 2.5% for AGIs $50k-75k)
Total itemized deductions: $15,144 (26% of AGI, reported on 18.1% of returns)
Here:
$15,144
State:
$18,389
Here:
26.2% of AGI
State:
21.0% of AGI
(% of AGI for various income ranges: 8.4% for AGIs $10k-25k, 8.7% for AGIs $25k-50k, 7.9% for AGIs $50k-75k, 12.5% for AGIs $75k-100k, 13.9% for AGIs over 100k)
Charity contributions deductions: $3,073 (5% of AGI, reported on 14.3% of returns)
Here:
$3,073
State:
$4,725
Here:
5.3% of AGI
State:
5.1% of AGI
(% of AGI for various income ranges: 0.8% for AGIs $10k-25k, 1.9% for AGIs $25k-50k, 1.2% for AGIs $50k-75k, 1.9% for AGIs $75k-100k, 1.5% for AGIs over 100k)
Total tax: $3,255 (reported on 68.5% of returns)
72121:
$3,255
State:
$6,047
(% of AGI for various income ranges: 6.4% for AGIs below $10k, 3.4% for AGIs $10k-25k, 5.4% for AGIs $25k-50k, 8.3% for AGIs $50k-75k, 9.5% for AGIs $75k-100k, 16.4% for AGIs over 100k)
Earned income credit: $1,700 (reported on 25.0% of returns)
Here:
$1,700
State:
$1,909
Percentage of individuals using paid preparers for their 2004 taxes: 75.9%
Here:
76%
State:
67%
(% for various income ranges: 68.9% for AGIs below $10k, 77.9% for AGIs $10k-25k, 76.4% for AGIs $25k-50k, 80.3% for AGIs $50k-75k, 75.0% for AGIs $75k-100k, 95.0% for AGIs over 100k)
Household received Food Stamps/SNAP in the past 12 months: 173 Household did not receive Food Stamps/SNAP in the past 12 months: 907
Women who had a birth in the past 12 months: 44 (2 now married, 40 unmarried) Women who did not have a birth in the past 12 months: 579 (366 now married, 215 unmarried)
Housing units in zip code 72121 with a mortgage: 497 (116 second mortgage, 112 both second mortgage and home equity loan) Median monthly owner costs for units with a mortgage: $1,131 Median monthly owner costs for units without a mortgage: $244
Residents with income below the poverty level in 2022:
This zip code:
23.1%
Whole state:
16.8%
Residents with income below 50% of the poverty level in 2022:
This zip code:
12.7%
Whole state:
8.5%
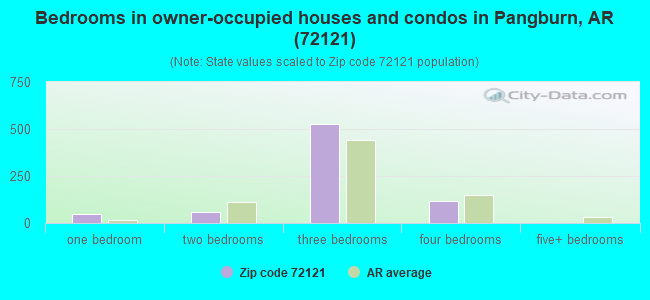
Median number of rooms in houses and condos:
Here:
6.4
State:
6.1
Median number of rooms in apartments:
Here:
4.5
State:
4.3
Notable locations in this zip code not listed on our city pages
Notable locations in zip code 72121: Dripping Springs Landing (A), Ramsey Landing (B), Pangburn Volunteer Fire Station (C), Hickory Flat Volunteer Fire Department (D), Pangburn Police Department (E). Display/hide their locations on the map
Churches in zip code 72121 include: Full Gospel Church (A), Harris Chapel (B), Mount Olive Church (C), Pine View Church (D). Display/hide their locations on the map
Size of family households: 292 2-persons, 243 3-persons, 79 4-persons, 85 5-persons, 76 6-persons
Size of nonfamily households: 299 1-person, 9 2-persons
482 married couples with children.
198 single-parent households (26 men, 172 women).
99.4% of residents of 72121 zip code speak English at home.
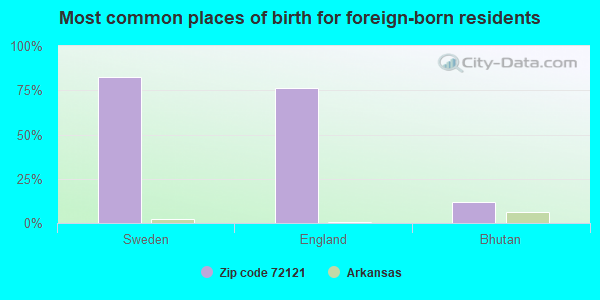
Foreign born population: 17 (0.6%) (12.1% of them are naturalized citizens)
This zip code:
0.6%
Whole state:
5.1%
82%Sweden
76%England
12%Bhutan
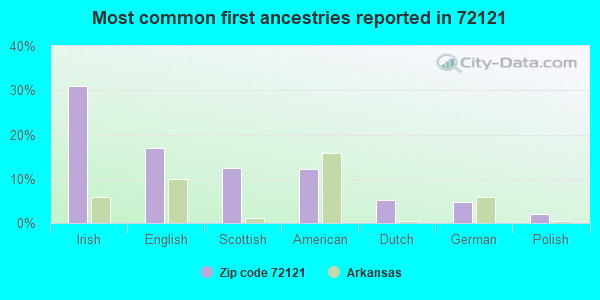
31%Irish
17%English
12%Scottish
12%American
5%Dutch
5%German
2%Polish
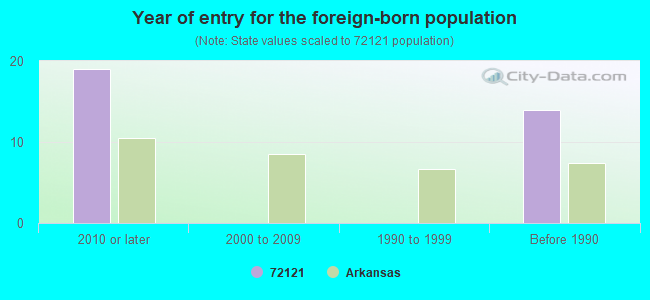
Year of entry for the foreign-born population
192010 or later
02000 to 2009
01990 to 1999
14Before 1990
Facilities with environmental interests located in this zip code:
ARK DEHYDRATED FOODS (RT.1 - HICKORY FLAT in PANGBURN, AR)
AIR SYNTHETIC MINOR (AIRS/AFS)
Housing units lacking complete plumbing facilities: 1.8% Housing units lacking complete kitchen facilities: 4.4%
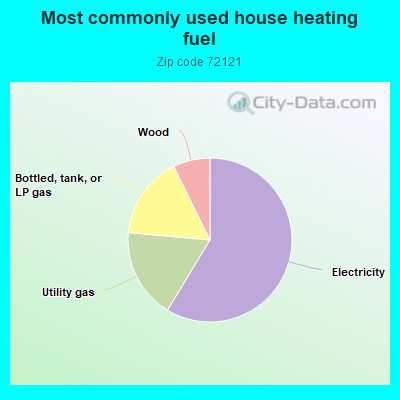
58.8%Electricity
17.8%Utility gas
16.3%Bottled, tank, or LP gas
7.3%Wood
Population in 1990: 1,996. Population change in the 1990s: +462 (+23.1%).
Place of birth for U.S.-born residents:
This state: 1,967
Northeast: 138
Midwest: 292
South: 245
West: 81
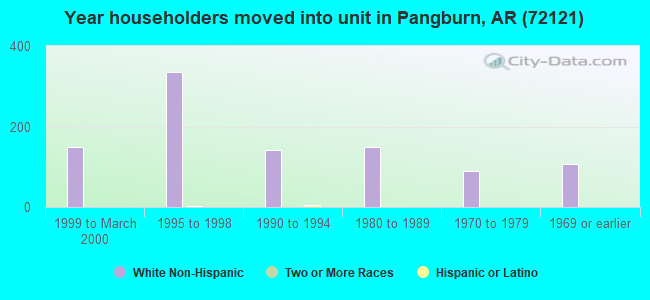
57% of the 72121 zip code residents lived in the same house 5 years ago. Out of people who lived in different houses, 44% lived in this county. Out of people who lived in different counties, 50% lived in Arkansas.
84% of the 72121 zip code residents lived in the same house 1 year ago. Out of people who lived in different houses, 30% moved from this county. Out of people who lived in different houses, 62% moved from different county within same state. Out of people who lived in different houses, 6% moved from different state. Out of people who lived in different houses, 1% moved from abroad.
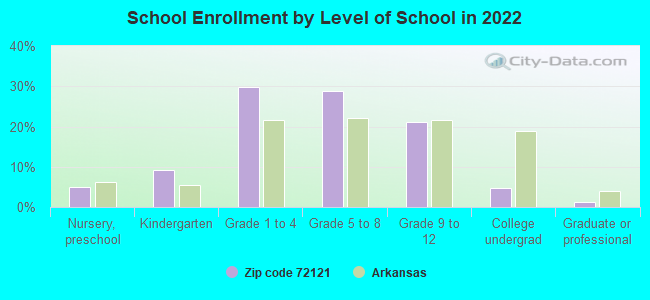
Private vs. public school enrollment:
Students in private schools in grades 1 to 8 (elementary and middle school): 26
Here:
6.9%
Arkansas:
10.5%
Students in private schools in grades 9 to 12 (high school):
Here:
0.0%
Arkansas:
8.7%
Students in private undergraduate colleges: 25
Here:
73.8%
Arkansas:
19.4%
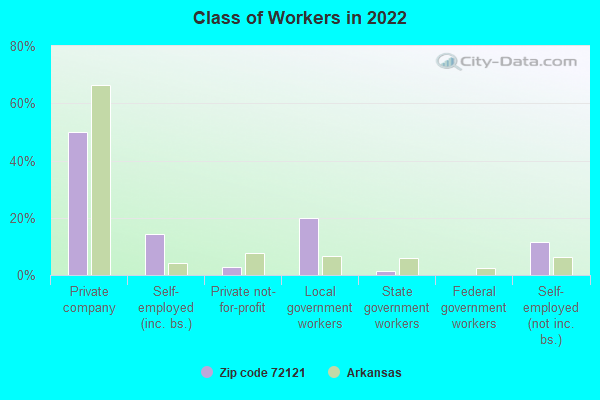
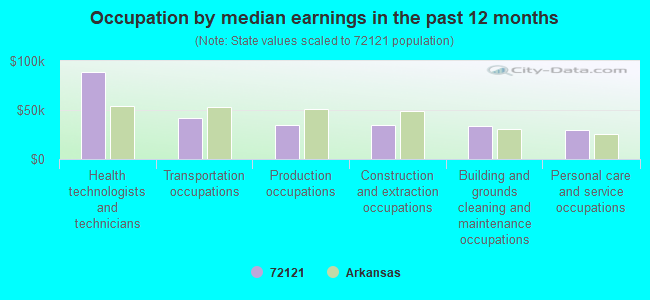
Occupation by median earnings in the past 12 months ($)
89,168Health technologists and technicians
42,063Transportation occupations
35,003Production occupations
34,446Construction and extraction occupations
33,681Building and grounds cleaning and maintenance occupations
29,719Personal care and service occupations
Top industries in this zip code by the number of employees in 2005:
Construction: Commercial and Institutional Building Construction (20-49 employees: 1 establishment)
Construction: Plumbing, Heating, and Air-Conditioning Contractors (10-19: 1)
Finance and Insurance: Commercial Banking (5-9: 1, 1-4: 1)
Accommodation and Food Services: Full-Service Restaurants (5-9: 1)
Professional, Scientific, and Technical Services: Offices of Certified Public Accountants (5-9: 1)
Fatal accident statistics in 2013:
Fatal accident count: 2
Vehicles involved in fatal accidents: 2
Fatal accidents caused by drunken drivers: 2
Fatalities: 3
Persons involved in fatal accidents: 4
Pedestrians involved in fatal accidents: 0
Fatal accident statistics in 2010:
Fatal accident count: 1
Vehicles involved in fatal accidents: 2
Fatal accidents caused by drunken drivers: 0
Fatalities: 1
Persons involved in fatal accidents: 5
Pedestrians involved in fatal accidents: 0
2002 - 2018 National Fire Incident Reporting System (NFIRS) incidents
Based on the data from the years 2002 - 2018 the average number of fire incidents per year is 20. The highest number of reported fire incidents - 51 took place in 2010, and the least - 4 in 2004. The data has an increasing trend.
When looking into fire subcategories, the most reports belonged to: Outside Fires (59.2%), and Structure Fires (29.2%).
Fire incident types reported to NFIRS in Zip Code 72121


 Nearest zip codes: 72179, 72085, 72081, 72534, 72523, 72568.


 Based on the data from the years 2002 - 2018 the average number of fire incidents per year is 20. The highest number of reported fire incidents - 51 took place in 2010, and the least - 4 in 2004. The data has an increasing trend.
 When looking into fire subcategories, the most reports belonged to: Outside Fires (59.2%), and Structure Fires (29.2%).