Averages for the 2020 tax year for zip code 72938, filed in 2021:
Average Adjusted Gross Income (AGI) in 2020: $43,957 (Individual Income Tax Returns)
Here:
$43,957
State:
$64,872
Salary/wage: $36,786 (reported on 78.7% of returns)
Here:
$36,786
State:
$50,644
(% of AGI for various income ranges: 1190.0% for AGIs below $25k, 3441.8% for AGIs $25k-50k, 6142.5% for AGIs $50k-75k, 8666.7% for AGIs $75k-100k, 10736.7% for AGIs $100k-200k)
Taxable interest for individuals: $578 (reported on 19.1% of returns)
This zip code:
$578
Arkansas:
$1,857
(% of AGI for various income ranges: 18.5% for AGIs below $25k, 50.0% for AGIs $50k-75k, 26.7% for AGIs $100k-200k)
Ordinary dividends: $1,533 (reported on 6.4% of returns)
Here:
$1,533
State:
$21,681
(% of AGI for various income ranges: 41.8% for AGIs $25k-50k)
Profit/loss from business: +$7,283 (reported on 12.8% of returns)
Here:
+$7,283
State:
+$9,743
(% of AGI for various income ranges: 172.3% for AGIs below $25k, 193.6% for AGIs $25k-50k)
Taxable individual retirement arrangement distribution: $8,467 (reported on 6.4% of returns)
72938:
$8,467
Arkansas:
$18,502
(% of AGI for various income ranges: 195.4% for AGIs below $25k)
Earned income credit: $2,767 (reported on 25.5% of returns)
Here:
$2,767
State:
$2,546
(% of AGI for various income ranges: 153.8% for AGIs below $25k, 120.0% for AGIs $25k-50k)
Percentage of individuals using paid preparers for their 2020 taxes: 93.6%
Here:
94%
State:
94%
(% for various income ranges: 100.0% for AGIs below $25k, 100.0% for AGIs $25k-50k, 83.3% for AGIs $50k-75k, 80.0% for AGIs $75k-100k, 80.0% for AGIs $100k-200k)
Averages for the 2012 tax year for zip code 72938, filed in 2013:
Average Adjusted Gross Income (AGI) in 2012: $38,188 (Individual Income Tax Returns)
Here:
$38,188
State:
$52,148
Salary/wage: $33,258 (reported on 76.7% of returns)
Here:
$33,258
State:
$41,669
(% of AGI for various income ranges: 62.9% for AGIs below $25k, 73.7% for AGIs $25k-50k, 73.2% for AGIs $50k-75k, 71.5% for AGIs $75k-100k, 53.2% for AGIs $100k-200k)
Taxable interest for individuals: $1,067 (reported on 20.9% of returns)
This zip code:
$1,067
Arkansas:
$1,648
(% of AGI for various income ranges: 1.3% for AGIs below $25k, 0.4% for AGIs $25k-50k, 2.0% for AGIs $75k-100k)
Ordinary dividends: $1,067 (reported on 7.0% of returns)
Here:
$1,067
State:
$20,675
Profit/loss from business: +$4,929 (reported on 16.3% of returns)
Here:
+$4,929
State:
+$9,665
Taxable individual retirement arrangement distribution: $7,975 (reported on 9.3% of returns)
72938:
$7,975
Arkansas:
$13,644
Total itemized deductions: $19,950 (30% of AGI, reported on 14.0% of returns)
Here:
$19,950
State:
$23,276
Here:
29.9% of AGI
State:
19.1% of AGI
Charity contributions: $5,025 (reported on 9.3% of returns)
Here:
$5,025
State:
$5,996
Taxes paid: $3,917 (reported on 14.0% of returns)
72938:
$3,917
State:
$7,941
Earned income credit: $2,785 (reported on 30.2% of returns)
Here:
$2,785
State:
$2,455
(% of AGI for various income ranges: 10.5% for AGIs below $25k, 2.0% for AGIs $25k-50k)
Percentage of individuals using paid preparers for their 2012 taxes: 69.8%
Here:
70%
State:
61%
(% for various income ranges: 65.0% for AGIs below $25k, 75.0% for AGIs $25k-50k, 80.0% for AGIs $50k-75k, 66.7% for AGIs $75k-100k, 66.7% for AGIs $100k-200k)
Averages for the 2004 tax year for zip code 72938, filed in 2005:
Average Adjusted Gross Income (AGI) in 2004: $30,073 (Individual Income Tax Returns)
Here:
$30,073
State:
$39,270
Salary/wage: $29,644 (reported on 85.1% of returns)
Here:
$29,644
State:
$34,079
(% of AGI for various income ranges: 133.1% for AGIs below $10k, 82.4% for AGIs $10k-25k, 86.5% for AGIs $25k-50k, 77.5% for AGIs $50k-75k, 82.5% for AGIs $75k-100k)
Taxable interest for individuals: $1,405 (reported on 32.2% of returns)
This zip code:
$1,405
Arkansas:
$1,904
(% of AGI for various income ranges: 11.0% for AGIs below $10k, 1.6% for AGIs $10k-25k, 1.0% for AGIs $25k-50k, 2.4% for AGIs $50k-75k, 0.1% for AGIs $75k-100k)
Taxable dividends: $367 (reported on 9.4% of returns)
Here:
$367
State:
$5,995
Net capital gain/loss: +$193 (reported on 10.9% of returns)
Here:
+$193
State:
+$10,430
(% of AGI for various income ranges: -0.3% for AGIs $10k-25k, 0.0% for AGIs $25k-50k, 0.8% for AGIs $50k-75k, -0.6% for AGIs $75k-100k)
Profit/loss from business: +$2,829 (reported on 13.4% of returns)
Here:
+$2,829
State:
+$7,823
(% of AGI for various income ranges: 6.8% for AGIs below $10k, 7.7% for AGIs $10k-25k, -0.6% for AGIs $25k-50k, 0.3% for AGIs $50k-75k)
IRA payment deduction: $2,867 (reported on 2.9% of returns)
72938:
$2,867
Arkansas:
$3,204
Total itemized deductions: $14,926 (25% of AGI, reported on 15.5% of returns)
Here:
$14,926
State:
$18,389
Here:
25.5% of AGI
State:
21.0% of AGI
Charity contributions deductions: $3,688 (7% of AGI, reported on 12.3% of returns)
Here:
$3,688
State:
$4,725
Here:
6.8% of AGI
State:
5.1% of AGI
Total tax: $3,421 (reported on 65.5% of returns)
72938:
$3,421
State:
$6,047
(% of AGI for various income ranges: 3.4% for AGIs below $10k, 3.5% for AGIs $10k-25k, 5.6% for AGIs $25k-50k, 8.1% for AGIs $50k-75k, 13.8% for AGIs $75k-100k)
Earned income credit: $1,912 (reported on 26.1% of returns)
Here:
$1,912
State:
$1,909
Percentage of individuals using paid preparers for their 2004 taxes: 73.8%
Here:
74%
State:
67%
(% for various income ranges: 65.4% for AGIs below $10k, 80.0% for AGIs $10k-25k, 72.5% for AGIs $25k-50k, 72.3% for AGIs $50k-75k, 80.0% for AGIs $75k-100k)
Household received Food Stamps/SNAP in the past 12 months: 85 Household did not receive Food Stamps/SNAP in the past 12 months: 337
Women who did not have a birth in the past 12 months: 173 (114 now married, 59 unmarried)
Housing units in zip code 72938 with a mortgage: 84 (2 second mortgage, 1 both second mortgage and home equity loan) Median monthly owner costs for units with a mortgage: $914 Median monthly owner costs for units without a mortgage: $428
Residents with income below the poverty level in 2022:
This zip code:
18.4%
Whole state:
16.8%
Residents with income below 50% of the poverty level in 2022:
This zip code:
16.2%
Whole state:
8.5%
Median number of rooms in houses and condos:
Here:
5.5
State:
6.1
Median number of rooms in apartments:
Here:
7.7
State:
4.3
Notable locations in this zip code not listed on our city pages
Churches in zip code 72938 include: Pine Grove Church (A), Faith Chapel Church (B), West Harmony Church (C), Shiloh Church (D). Display/hide their locations on the map
Streams, rivers, and creeks: Cherokee Creek (A), School House Branch (B), Pine Grove Creek (C), West Harmony Creek (D), West Creek (E). Display/hide their locations on the map
Size of family households: 159 2-persons, 73 3-persons, 54 4-persons, 38 5-persons, 3 7-or-more-persons
Size of nonfamily households: 86 1-person, 5 2-persons
83 married couples with children.
36 single-parent households (3 men, 33 women).
94.1% of residents of 72938 zip code speak English at home.
0.1% of residents speak other Indo-European language at home (100% well).
5.6% of residents speak Asian or Pacific Island language at home (100% very well).
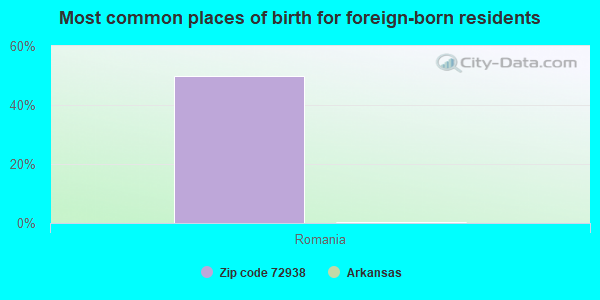
Foreign born population: 2 (0.2%) (100.0% of them are naturalized citizens)
This zip code:
0.2%
Whole state:
5.1%
50%Romania
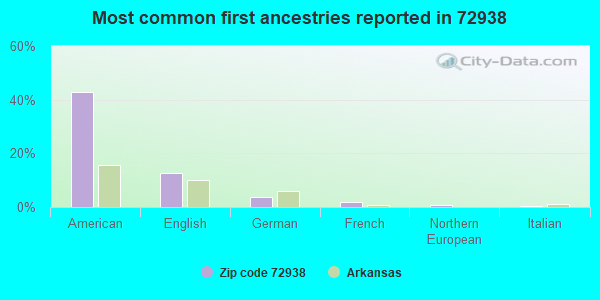
43%American
13%English
4%German
2%French
1%Northern European
0%Italian
0%Russian
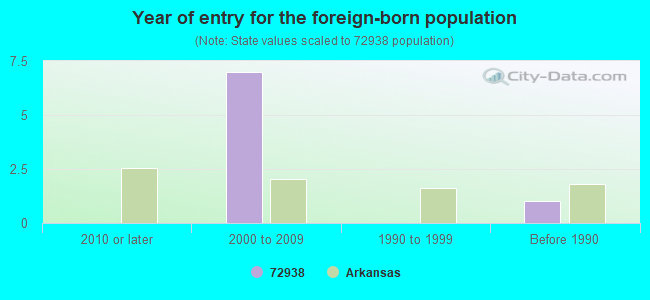
Year of entry for the foreign-born population
02010 or later
72000 to 2009
01990 to 1999
1Before 1990
Facilities with environmental interests located in this zip code:
CDX GAS,LLC/POD #1 BOOSTER (9916 HWY. 96 WEST in HARTFORD, AR)
AIR MINOR (AIRS/AFS) STATE MASTER (PDS) - AIR-2010-AR-1, AIR MINOR, AIR-2010-AR-2, AIR-2010-A, Alternative names: CDX GAS,L.L.C.-POD #1 BOOSTER
HARTFORD ELEMENTARY SCHOOL (P.O. BOX 489 in HARTFORD, AR)
(Geographic Names Information System) (National Center for Education Statistics) - STATE ID-6604051
HARTFORD HIGH SCHOOL (P.O. BOX 489 in HARTFORD, AR)
(Geographic Names Information System) (National Center for Education Statistics) - STATE ID-6604052
AMERICAN SALES CO (202 E MAIN ST in HARTFORD, AR)
(Integrated Compliance Information System) - ICIS-06-1994-0125, FORMAL ENFORCEMENT ACTION Business SIC classification: SPECIALTY CLEANING, POLISHING, AND SANITATION PREPARATIONS; MOTOR VEHICLE PARTS AND ACCESSORIES
HARTFORD SCHOOL DISTRICT ((HWY 96) 408 W. LUDLOW in HARTFORD, AR)
National Pollutant Discharge Elimination System NON-MAJOR (Tracking pollutant discharge elimination systems) - permit Business SIC classification: ELEMENTARY AND SECONDARY SCHOOLS
Housing units lacking complete plumbing facilities: 14.4% Housing units lacking complete kitchen facilities: 14.8%
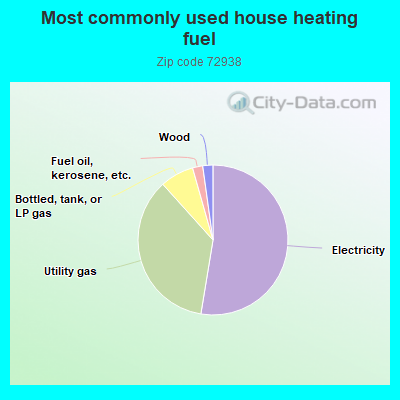
52.8%Electricity
35.9%Utility gas
7.3%Bottled, tank, or LP gas
2.2%Fuel oil, kerosene, etc.
2.2%Wood
Population in 1990: 1,073. Population change in the 1990s: +412 (+38.4%).
Place of birth for U.S.-born residents:
This state: 687
Northeast: 2
Midwest: 16
South: 301
West: 97
59% of the 72938 zip code residents lived in the same house 5 years ago. Out of people who lived in different houses, 61% lived in this county. Out of people who lived in different counties, 50% lived in Arkansas.
83% of the 72938 zip code residents lived in the same house 1 year ago. Out of people who lived in different houses, 55% moved from this county. Out of people who lived in different houses, 9% moved from different county within same state. Out of people who lived in different houses, 30% moved from different state.
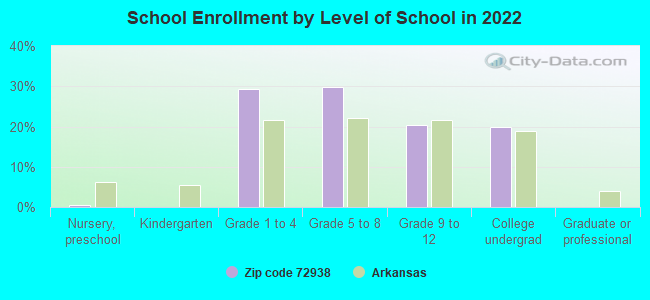
Private vs. public school enrollment:
Students in private schools in grades 1 to 8 (elementary and middle school): 7
Here:
5.4%
Arkansas:
10.5%
Students in private schools in grades 9 to 12 (high school):
Here:
0.0%
Arkansas:
8.7%
Students in private undergraduate colleges:
Here:
0.0%
Arkansas:
19.4%
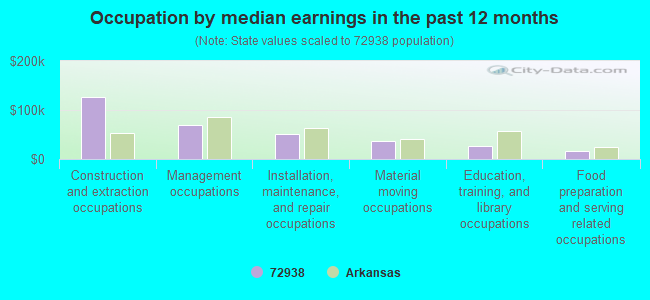
Occupation by median earnings in the past 12 months ($)
126,974Construction and extraction occupations
68,842Management occupations
51,078Installation, maintenance, and repair occupations
36,171Material moving occupations
26,114Education, training, and library occupations
15,771Food preparation and serving related occupations
Top industries in this zip code by the number of employees in 2005:
Health Care and Social Assistance: Home Health Care Services (20-49 employees: 1 establishment)
Administrative and Support and Waste Management and Remediation Services: Office Administrative Services (10-19: 1)
Mining: Support Activities for Coal Mining (5-9: 1)
Information: Periodical Publishers (5-9: 1)
Other Services (except Public Administration): Religious Organizations (5-9: 1)
Administrative and Support and Waste Management and Remediation Services: Other Waste Collection (5-9: 1)
Construction: New Single-Family Housing Construction (except Operative Builders) (5-9: 1)
Finance and Insurance: Commercial Banking (1-4: 1)
Wholesale Trade: Other Miscellaneous Durable Goods Merchant Wholesalers (1-4: 1)
Home Mortgage Disclosure Act Aggregated Statistics For Year 2009 (Based on 2 partial tracts)
A) FHA, FSA/RHS & VA Home Purchase Loans
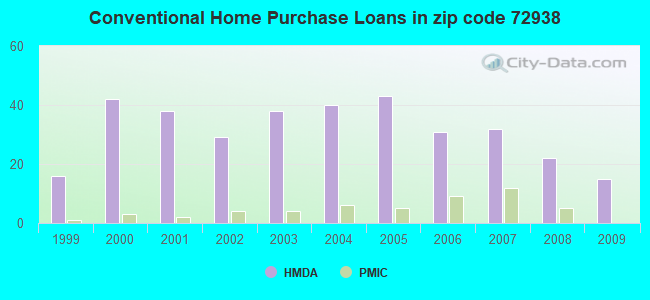
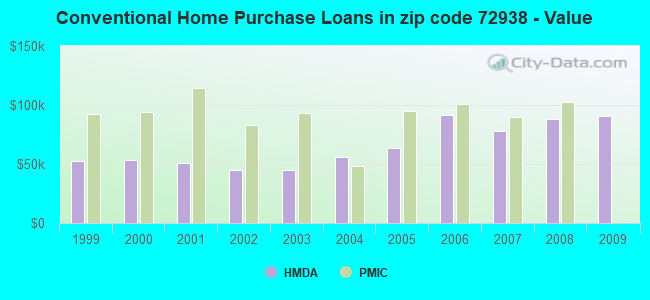
B) Conventional Home Purchase Loans
C) Refinancings
D) Home Improvement Loans
F) Non-occupant Loans on < 5 Family Dwellings (A B C & D)
G) Loans On Manufactured Home Dwelling (A B C & D)
Number
Average Value
Number
Average Value
Number
Average Value
Number
Average Value
Number
Average Value
Number
Average Value
LOANS ORIGINATED
12
$122,658
15
$90,263
44
$106,216
16
$25,647
5
$70,770
7
$36,600
APPLICATIONS APPROVED, NOT ACCEPTED
0
$0
5
$90,848
1
$263,330
1
$7,680
1
$9,330
4
$49,510
APPLICATIONS DENIED
2
$94,085
9
$42,608
18
$108,592
10
$13,934
3
$32,367
9
$37,731
APPLICATIONS WITHDRAWN
2
$88,325
4
$64,050
13
$105,415
4
$59,660
1
$20,300
1
$30,170
FILES CLOSED FOR INCOMPLETENESS
1
$118,500
2
$37,305
1
$242,480
0
$0
0
$0
1
$29,620
Aggregated Statistics For Year 2008 (Based on 2 partial tracts)
A) FHA, FSA/RHS & VA Home Purchase Loans
B) Conventional Home Purchase Loans
C) Refinancings
D) Home Improvement Loans
F) Non-occupant Loans on < 5 Family Dwellings (A B C & D)
G) Loans On Manufactured Home Dwelling (A B C & D)
Number
Average Value
Number
Average Value
Number
Average Value
Number
Average Value
Number
Average Value
Number
Average Value
LOANS ORIGINATED
9
$117,157
22
$88,100
42
$91,721
26
$20,805
7
$57,524
10
$61,498
APPLICATIONS APPROVED, NOT ACCEPTED
0
$0
3
$59,797
2
$68,025
1
$25,240
1
$101,490
3
$72,050
APPLICATIONS DENIED
2
$148,670
14
$59,954
14
$101,922
6
$23,315
4
$50,745
9
$67,294
APPLICATIONS WITHDRAWN
1
$44,990
6
$57,787
11
$98,947
2
$24,960
2
$48,000
3
$38,583
FILES CLOSED FOR INCOMPLETENESS
0
$0
1
$8,230
2
$68,575
0
$0
0
$0
0
$0
Aggregated Statistics For Year 2007 (Based on 2 partial tracts)
A) FHA, FSA/RHS & VA Home Purchase Loans
B) Conventional Home Purchase Loans
C) Refinancings
D) Home Improvement Loans
E) Loans on Dwellings For 5+ Families
F) Non-occupant Loans on < 5 Family Dwellings (A B C & D)
G) Loans On Manufactured Home Dwelling (A B C & D)
Number
Average Value
Number
Average Value
Number
Average Value
Number
Average Value
Number
Average Value
Number
Average Value
Number
Average Value
LOANS ORIGINATED
3
$59,797
32
$77,764
44
$84,908
31
$23,855
1
$84,480
11
$58,451
16
$39,705
APPLICATIONS APPROVED, NOT ACCEPTED
0
$0
5
$99,846
4
$122,338
3
$16,277
0
$0
0
$0
3
$101,127
APPLICATIONS DENIED
1
$77,350
16
$87,193
24
$96,394
9
$13,410
0
$0
2
$72,140
7
$80,723
APPLICATIONS WITHDRAWN
2
$101,765
4
$113,012
12
$99,205
2
$57,330
0
$0
1
$79,550
1
$15,910
FILES CLOSED FOR INCOMPLETENESS
0
$0
1
$32,920
3
$103,867
1
$21,940
0
$0
0
$0
0
$0
Aggregated Statistics For Year 2006 (Based on 2 partial tracts)
A) FHA, FSA/RHS & VA Home Purchase Loans
B) Conventional Home Purchase Loans
C) Refinancings
D) Home Improvement Loans
E) Loans on Dwellings For 5+ Families
F) Non-occupant Loans on < 5 Family Dwellings (A B C & D)
G) Loans On Manufactured Home Dwelling (A B C & D)
Number
Average Value
Number
Average Value
Number
Average Value
Number
Average Value
Number
Average Value
Number
Average Value
Number
Average Value
LOANS ORIGINATED
5
$128,922
31
$91,351
39
$82,501
34
$19,798
1
$71,870
8
$27,088
9
$38,584
APPLICATIONS APPROVED, NOT ACCEPTED
0
$0
9
$65,161
4
$79,272
2
$15,910
0
$0
0
$0
7
$42,164
APPLICATIONS DENIED
1
$61,440
18
$54,251
20
$85,746
7
$17,711
0
$0
1
$30,720
12
$42,425
APPLICATIONS WITHDRAWN
2
$52,115
5
$84,814
12
$78,541
3
$38,950
0
$0
1
$85,580
1
$10,970
FILES CLOSED FOR INCOMPLETENESS
0
$0
1
$8,230
2
$82,290
1
$23,590
0
$0
0
$0
0
$0
Aggregated Statistics For Year 2005 (Based on 2 partial tracts)
A) FHA, FSA/RHS & VA Home Purchase Loans
B) Conventional Home Purchase Loans
C) Refinancings
D) Home Improvement Loans
F) Non-occupant Loans on < 5 Family Dwellings (A B C & D)
G) Loans On Manufactured Home Dwelling (A B C & D)
Number
Average Value
Number
Average Value
Number
Average Value
Number
Average Value
Number
Average Value
Number
Average Value
LOANS ORIGINATED
8
$103,685
43
$63,548
46
$77,806
29
$20,809
16
$48,654
17
$39,919
APPLICATIONS APPROVED, NOT ACCEPTED
2
$34,015
7
$46,004
5
$54,092
2
$36,480
1
$71,870
6
$38,585
APPLICATIONS DENIED
3
$44,253
18
$52,178
25
$80,227
5
$78,998
3
$46,997
12
$45,671
APPLICATIONS WITHDRAWN
2
$81,465
4
$67,340
13
$112,505
1
$15,360
0
$0
0
$0
FILES CLOSED FOR INCOMPLETENESS
1
$47,180
1
$42,240
3
$106,430
0
$0
1
$79,550
0
$0
Aggregated Statistics For Year 2004 (Based on 2 partial tracts)
A) FHA, FSA/RHS & VA Home Purchase Loans
B) Conventional Home Purchase Loans
C) Refinancings
D) Home Improvement Loans
F) Non-occupant Loans on < 5 Family Dwellings (A B C & D)
G) Loans On Manufactured Home Dwelling (A B C & D)
Number
Average Value
Number
Average Value
Number
Average Value
Number
Average Value
Number
Average Value
Number
Average Value
LOANS ORIGINATED
10
$95,511
40
$55,669
60
$67,185
24
$26,470
22
$42,990
25
$40,333
APPLICATIONS APPROVED, NOT ACCEPTED
1
$85,030
12
$54,540
8
$58,631
2
$23,315
0
$0
9
$53,580
APPLICATIONS DENIED
3
$43,523
17
$59,442
29
$62,900
7
$18,653
2
$69,945
15
$50,325
APPLICATIONS WITHDRAWN
1
$32,920
1
$72,420
12
$79,044
2
$6,035
1
$80,640
0
$0
FILES CLOSED FOR INCOMPLETENESS
1
$109,170
3
$38,767
3
$81,193
0
$0
0
$0
1
$75,160
Aggregated Statistics For Year 2003 (Based on 2 partial tracts)
A) FHA, FSA/RHS & VA Home Purchase Loans
B) Conventional Home Purchase Loans
C) Refinancings
D) Home Improvement Loans
E) Loans on Dwellings For 5+ Families
F) Non-occupant Loans on < 5 Family Dwellings (A B C & D)
Number
Average Value
Number
Average Value
Number
Average Value
Number
Average Value
Number
Average Value
Number
Average Value
LOANS ORIGINATED
3
$74,610
38
$45,216
78
$71,909
16
$19,098
1
$48,830
22
$43,240
APPLICATIONS APPROVED, NOT ACCEPTED
0
$0
5
$67,148
9
$68,941
2
$46,080
0
$0
0
$0
APPLICATIONS DENIED
2
$47,730
8
$43,340
27
$71,135
3
$12,253
0
$0
1
$13,720
APPLICATIONS WITHDRAWN
1
$44,440
5
$36,536
19
$68,431
1
$20,300
0
$0
1
$15,910
FILES CLOSED FOR INCOMPLETENESS
0
$0
3
$65,283
4
$91,890
0
$0
0
$0
0
$0
Aggregated Statistics For Year 2002 (Based on 2 partial tracts)
A) FHA, FSA/RHS & VA Home Purchase Loans
B) Conventional Home Purchase Loans
C) Refinancings
D) Home Improvement Loans
F) Non-occupant Loans on < 5 Family Dwellings (A B C & D)
Number
Average Value
Number
Average Value
Number
Average Value
Number
Average Value
Number
Average Value
LOANS ORIGINATED
8
$87,776
29
$44,834
72
$65,329
24
$21,350
20
$31,270
APPLICATIONS APPROVED, NOT ACCEPTED
0
$0
3
$66,747
10
$61,224
2
$12,070
0
$0
APPLICATIONS DENIED
3
$54,677
16
$51,157
27
$67,071
8
$18,995
1
$26,330
APPLICATIONS WITHDRAWN
1
$87,780
6
$73,878
10
$67,258
1
$34,560
1
$10,970
FILES CLOSED FOR INCOMPLETENESS
0
$0
0
$0
4
$77,628
0
$0
0
$0
Aggregated Statistics For Year 2001 (Based on 2 partial tracts)
A) FHA, FSA/RHS & VA Home Purchase Loans
B) Conventional Home Purchase Loans
C) Refinancings
D) Home Improvement Loans
E) Loans on Dwellings For 5+ Families
F) Non-occupant Loans on < 5 Family Dwellings (A B C & D)
Number
Average Value
Number
Average Value
Number
Average Value
Number
Average Value
Number
Average Value
Number
Average Value
LOANS ORIGINATED
7
$66,929
38
$50,731
63
$61,069
29
$16,288
2
$177,470
16
$23,350
APPLICATIONS APPROVED, NOT ACCEPTED
1
$34,010
5
$43,120
10
$61,279
1
$7,680
0
$0
0
$0
APPLICATIONS DENIED
1
$64,730
22
$36,781
33
$57,603
10
$24,413
0
$0
3
$68,027
APPLICATIONS WITHDRAWN
1
$18,100
4
$39,362
13
$59,375
1
$27,430
0
$0
0
$0
FILES CLOSED FOR INCOMPLETENESS
0
$0
1
$24,690
3
$47,547
0
$0
0
$0
0
$0
Aggregated Statistics For Year 2000 (Based on 2 partial tracts)
A) FHA, FSA/RHS & VA Home Purchase Loans
B) Conventional Home Purchase Loans
C) Refinancings
D) Home Improvement Loans
F) Non-occupant Loans on < 5 Family Dwellings (A B C & D)
Number
Average Value
Number
Average Value
Number
Average Value
Number
Average Value
Number
Average Value
LOANS ORIGINATED
7
$59,249
42
$53,306
39
$55,184
25
$19,004
12
$25,876
APPLICATIONS APPROVED, NOT ACCEPTED
2
$66,380
9
$34,013
4
$54,998
3
$14,997
1
$8,230
APPLICATIONS DENIED
1
$40,600
42
$35,019
26
$49,564
12
$14,537
3
$30,173
APPLICATIONS WITHDRAWN
3
$52,667
6
$51,568
15
$51,495
1
$29,080
1
$12,070
FILES CLOSED FOR INCOMPLETENESS
0
$0
1
$49,920
2
$50,470
0
$0
0
$0
Aggregated Statistics For Year 1999 (Based on 1 partial tract)
A) FHA, FSA/RHS & VA Home Purchase Loans
B) Conventional Home Purchase Loans
C) Refinancings
D) Home Improvement Loans
F) Non-occupant Loans on < 5 Family Dwellings (A B C & D)
Detailed PMIC statistics for the following Tracts:0103.02
2003 - 2018 National Fire Incident Reporting System (NFIRS) incidents
Based on the data from the years 2003 - 2018 the average number of fires per year is 15. The highest number of fire incidents - 33 took place in 2017, and the least - 1 in 2005. The data has a decreasing trend.
When looking into fire subcategories, the most incidents belonged to: Structure Fires (49.2%), and Outside Fires (43.0%).
Fire incident types reported to NFIRS in Zip Code 72938

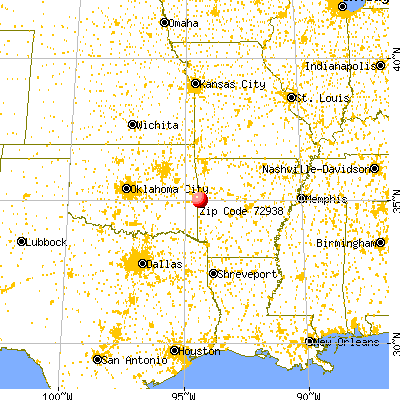


 Nearest zip codes: 72945, 72937, 72944, 72940, 74932, 74953.


 Based on the data from the years 2003 - 2018 the average number of fires per year is 15. The highest number of fire incidents - 33 took place in 2017, and the least - 1 in 2005. The data has a decreasing trend.
 When looking into fire subcategories, the most incidents belonged to: Structure Fires (49.2%), and Outside Fires (43.0%).