Estimated zip code population in 2022: 1,536 Zip code population in 2010: 1,881 Zip code population in 2000: 1,799
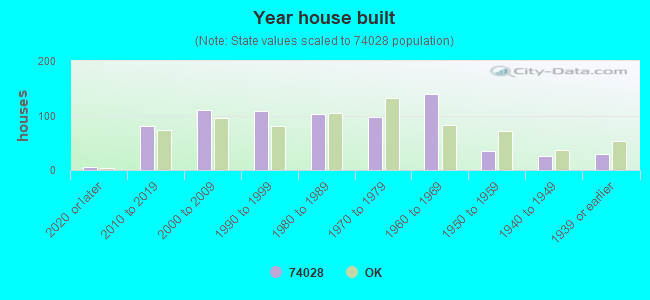
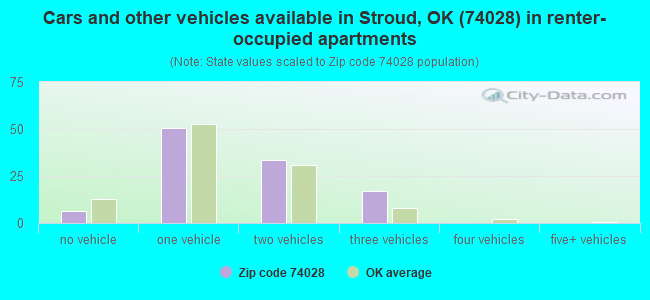
Houses and condos: 746 Renter-occupied apartments: 108
% of renters here:
17%
State:
35%
March 2022 cost of living index in zip code 74028: 80.0 (low, U.S. average is 100)
Land area: 101.7 sq. mi. Water area: 1.6 sq. mi.
Population density: 15 people per square mile
(very low).
OSM Map
General Map
Google Map
MSN Map
OSM Map
General Map
Google Map
MSN Map
OSM Map
General Map
Google Map
MSN Map
OSM Map
General Map
Google Map
MSN Map
Please wait while loading the map...
Real estate property taxes paid for housing units in 2022:
This zip code:
0.4% ($706)
Oklahoma:
0.8% ($1,501)
Median real estate property taxes paid for housing units with mortgages in 2022: $988 (0.6%) Median real estate property taxes paid for housing units with no mortgage in 2022: $568 (0.3%)
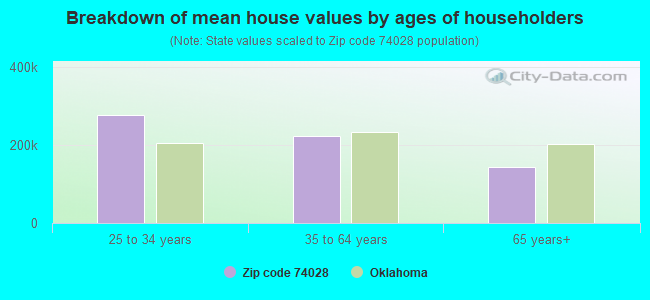
Estimated median house/condo value in 2022: $176,971
74028:
$176,971
Oklahoma:
$191,700
According to our research of Oklahoma and other state lists, there were 3 registered sex offenders living in 74028 zip code as of April 24, 2024. The ratio of all residents to sex offenders in zip code 74028 is 597 to 1. The ratio of registered sex offenders to all residents in this zip code is near the state average.
Median resident age:
This zip code:
45.4 years
Oklahoma median age:
37.1 years
Average household size:
This zip code:
2.4 people
Oklahoma:
2.5 people
Averages for the 2020 tax year for zip code 74028, filed in 2021:
Average Adjusted Gross Income (AGI) in 2020: $54,172 (Individual Income Tax Returns)
Here:
$54,172
State:
$63,060
Salary/wage: $47,800 (reported on 81.3% of returns)
Here:
$47,800
State:
$52,427
(% of AGI for various income ranges: 1187.4% for AGIs below $25k, 3576.3% for AGIs $25k-50k, 6182.5% for AGIs $50k-75k, 9276.0% for AGIs $75k-100k, 21046.0% for AGIs $100k-200k)
Taxable interest for individuals: $706 (reported on 22.7% of returns)
This zip code:
$706
Oklahoma:
$1,603
(% of AGI for various income ranges: 22.1% for AGIs below $25k, 7.9% for AGIs $25k-50k, 12.5% for AGIs $50k-75k, 106.0% for AGIs $100k-200k)
Ordinary dividends: $2,762 (reported on 10.7% of returns)
Here:
$2,762
State:
$7,001
(% of AGI for various income ranges: 35.8% for AGIs $25k-50k, 306.0% for AGIs $100k-200k)
Net capital gain/loss in AGI: +$7,243 (reported on 9.3% of returns)
Here:
+$7,243
State:
+$19,855
(% of AGI for various income ranges: 45.3% for AGIs $25k-50k, 842.0% for AGIs $100k-200k)
Profit/loss from business: +$6,050 (reported on 16.0% of returns)
Here:
+$6,050
State:
+$9,904
(% of AGI for various income ranges: 181.1% for AGIs below $25k, 128.9% for AGIs $25k-50k, 274.0% for AGIs $75k-100k)
Taxable individual retirement arrangement distribution: $14,080 (reported on 6.7% of returns)
74028:
$14,080
Oklahoma:
$20,476
(% of AGI for various income ranges: 162.1% for AGIs below $25k, 495.0% for AGIs $50k-75k)
Earned income credit: $2,562 (reported on 21.3% of returns)
Here:
$2,562
State:
$2,435
(% of AGI for various income ranges: 127.9% for AGIs below $25k, 87.9% for AGIs $25k-50k)
Percentage of individuals using paid preparers for their 2020 taxes: 94.7%
Here:
95%
State:
94%
(% for various income ranges: 96.3% for AGIs below $25k, 95.7% for AGIs $25k-50k, 90.0% for AGIs $50k-75k, 100.0% for AGIs $75k-100k, 88.9% for AGIs $100k-200k)
Averages for the 2012 tax year for zip code 74028, filed in 2013:
Average Adjusted Gross Income (AGI) in 2012: $47,483 (Individual Income Tax Returns)
Here:
$47,483
State:
$58,581
Salary/wage: $39,152 (reported on 83.1% of returns)
Here:
$39,152
State:
$45,973
(% of AGI for various income ranges: 73.3% for AGIs below $25k, 88.1% for AGIs $25k-50k, 81.3% for AGIs $50k-75k, 82.3% for AGIs $75k-100k, 46.1% for AGIs $100k-200k)
Taxable interest for individuals: $1,475 (reported on 20.8% of returns)
This zip code:
$1,475
Oklahoma:
$1,625
(% of AGI for various income ranges: 1.1% for AGIs below $25k, 0.2% for AGIs $25k-50k, 0.7% for AGIs $50k-75k, 0.9% for AGIs $75k-100k, 0.7% for AGIs $100k-200k)
Ordinary dividends: $3,000 (reported on 10.4% of returns)
Here:
$3,000
State:
$6,374
(% of AGI for various income ranges: 2.0% for AGIs below $25k, 0.7% for AGIs $50k-75k, 0.8% for AGIs $100k-200k)
Net capital gain/loss in AGI: +$7,433 (reported on 7.8% of returns)
Here:
+$7,433
State:
+$24,023
Profit/loss from business: +$6,313 (reported on 19.5% of returns)
Here:
+$6,313
State:
+$11,913
(% of AGI for various income ranges: 10.9% for AGIs below $25k, 2.3% for AGIs $25k-50k, 3.4% for AGIs $50k-75k, 2.5% for AGIs $75k-100k)
Taxable individual retirement arrangement distribution: $14,000 (reported on 7.8% of returns)
74028:
$14,000
Oklahoma:
$15,242
Total itemized deductions: $20,667 (16% of AGI, reported on 15.6% of returns)
Here:
$20,667
State:
$24,882
Here:
16.1% of AGI
State:
18.8% of AGI
(% of AGI for various income ranges: 8.4% for AGIs $25k-50k, 10.4% for AGIs $50k-75k, 8.3% for AGIs $100k-200k)
Charity contributions: $5,360 (reported on 13.0% of returns)
Here:
$5,360
State:
$6,591
(% of AGI for various income ranges: 1.5% for AGIs $25k-50k, 2.1% for AGIs $50k-75k, 2.0% for AGIs $100k-200k)
Taxes paid: $5,408 (reported on 15.6% of returns)
74028:
$5,408
State:
$7,196
(% of AGI for various income ranges: 0.9% for AGIs $25k-50k, 2.2% for AGIs $50k-75k, 3.1% for AGIs $100k-200k)
Earned income credit: $2,058 (reported on 24.7% of returns)
Here:
$2,058
State:
$2,354
(% of AGI for various income ranges: 7.0% for AGIs below $25k, 1.4% for AGIs $25k-50k)
Percentage of individuals using paid preparers for their 2012 taxes: 76.6%
Here:
77%
State:
56%
(% for various income ranges: 75.8% for AGIs below $25k, 76.2% for AGIs $25k-50k, 81.8% for AGIs $50k-75k, 80.0% for AGIs $75k-100k, 71.4% for AGIs $100k-200k)
Averages for the 2004 tax year for zip code 74028, filed in 2005:
Average Adjusted Gross Income (AGI) in 2004: $31,542 (Individual Income Tax Returns)
Here:
$31,542
State:
$41,245
Salary/wage: $28,360 (reported on 84.7% of returns)
Here:
$28,360
State:
$35,318
(% of AGI for various income ranges: 109.4% for AGIs below $10k, 84.4% for AGIs $10k-25k, 90.4% for AGIs $25k-50k, 92.2% for AGIs $50k-75k, 76.0% for AGIs $75k-100k, 20.2% for AGIs over 100k)
Taxable interest for individuals: $1,190 (reported on 28.0% of returns)
This zip code:
$1,190
Oklahoma:
$1,745
(% of AGI for various income ranges: 7.1% for AGIs below $10k, 1.9% for AGIs $10k-25k, 1.1% for AGIs $25k-50k, 0.6% for AGIs $50k-75k, 0.5% for AGIs $75k-100k)
Taxable dividends: $1,586 (reported on 9.6% of returns)
Here:
$1,586
State:
$2,920
(% of AGI for various income ranges: 1.9% for AGIs below $10k, 1.2% for AGIs $10k-25k, 0.1% for AGIs $25k-50k, 2.0% for AGIs $75k-100k)
Net capital gain/loss: +$2,083 (reported on 8.2% of returns)
Here:
+$2,083
State:
+$10,653
(% of AGI for various income ranges: -2.1% for AGIs below $10k, -0.2% for AGIs $10k-25k, -0.1% for AGIs $25k-50k, 3.2% for AGIs $50k-75k)
Profit/loss from business: +$7,110 (reported on 23.7% of returns)
Here:
+$7,110
State:
+$8,532
(% of AGI for various income ranges: 11.3% for AGIs below $10k, 12.2% for AGIs $10k-25k, 5.5% for AGIs $25k-50k, 5.6% for AGIs $50k-75k)
Total itemized deductions: $14,867 (21% of AGI, reported on 18.5% of returns)
Here:
$14,867
State:
$17,093
Here:
21.2% of AGI
State:
20.5% of AGI
(% of AGI for various income ranges: 7.2% for AGIs $10k-25k, 9.7% for AGIs $25k-50k, 10.6% for AGIs $50k-75k, 11.2% for AGIs $75k-100k, 6.2% for AGIs over 100k)
Charity contributions deductions: $3,188 (4% of AGI, reported on 16.0% of returns)
Here:
$3,188
State:
$4,240
Here:
4.3% of AGI
State:
4.8% of AGI
(% of AGI for various income ranges: 1.5% for AGIs $10k-25k, 1.4% for AGIs $25k-50k, 1.8% for AGIs $50k-75k, 1.6% for AGIs $75k-100k, 2.1% for AGIs over 100k)
Total tax: $2,956 (reported on 68.5% of returns)
74028:
$2,956
State:
$6,542
(% of AGI for various income ranges: 4.5% for AGIs below $10k, 3.6% for AGIs $10k-25k, 5.8% for AGIs $25k-50k, 7.5% for AGIs $50k-75k, 24.8% for AGIs $75k-100k)
Earned income credit: $1,856 (reported on 29.4% of returns)
Here:
$1,856
State:
$1,830
Percentage of individuals using paid preparers for their 2004 taxes: 78.8%
Here:
79%
State:
63%
(% for various income ranges: 73.7% for AGIs below $10k, 81.4% for AGIs $10k-25k, 80.4% for AGIs $25k-50k, 82.3% for AGIs $50k-75k, 60.0% for AGIs $75k-100k, 90.9% for AGIs over 100k)
Household received Food Stamps/SNAP in the past 12 months: 90 Household did not receive Food Stamps/SNAP in the past 12 months: 544
Women who had a birth in the past 12 months: 18 (7 now married, 10 unmarried) Women who did not have a birth in the past 12 months: 295 (126 now married, 169 unmarried)
Housing units in zip code 74028 with a mortgage: 144 (5 second mortgage, 5 both second mortgage and home equity loan) Median monthly owner costs for units with a mortgage: $1,319 Median monthly owner costs for units without a mortgage: $480
Residents with income below the poverty level in 2022:
This zip code:
16.1%
Whole state:
15.7%
Residents with income below 50% of the poverty level in 2022:
This zip code:
9.6%
Whole state:
8.3%
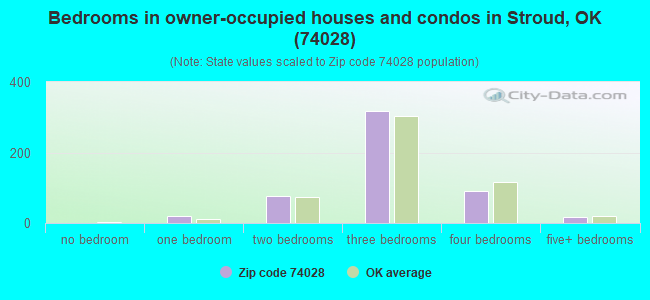
Median number of rooms in houses and condos:
Here:
5.8
State:
6.1
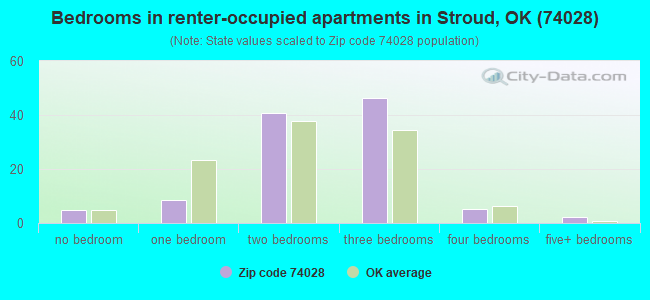
Median number of rooms in apartments:
Here:
5.0
State:
4.5
Notable locations in this zip code not listed on our city pages
Cemeteries: Polly Long Cemetery (1), Memorial Club Cemetery (2), Little Creek Church Cemetery (3), Oakdale Cemetery (4). Display/hide their locations on the map
Reservoirs: Stroud Reservoir (A), Little Deep Fork Creek Site 26 Reservoir (B), Little Deep Fork Creek Site 23 Reservoir (C), Little Deep Fork Creek Site 20 Reservoir (D), Little Deep Fork Creek Site 19 Reservoir (E), Little Deep Fork Creek Site 55c Reservoir (F), Little Deep Fork Creek Site 18 Reservoir (G), Little Deep Fork Creek Site 27 Reservoir (H). Display/hide their locations on the map
Size of family households: 153 2-persons, 106 3-persons, 144 4-persons, 60 5-persons, 17 6-persons, 4 7-or-more-persons
Size of nonfamily households: 116 1-person, 24 2-persons, 3 3-persons
212 married couples with children.
59 single-parent households (21 men, 38 women).
99.5% of residents of 74028 zip code speak English at home.
0.9% of residents speak Spanish at home (100% very well).
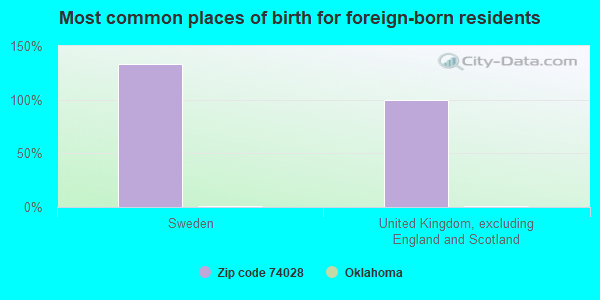
Foreign born population: 3 (0.3%) (100.0% of them are naturalized citizens)
This zip code:
0.3%
Whole state:
6.0%
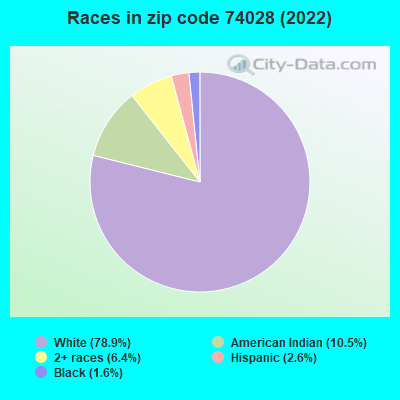
133%Sweden
100%United Kingdom, excluding England and Scotland
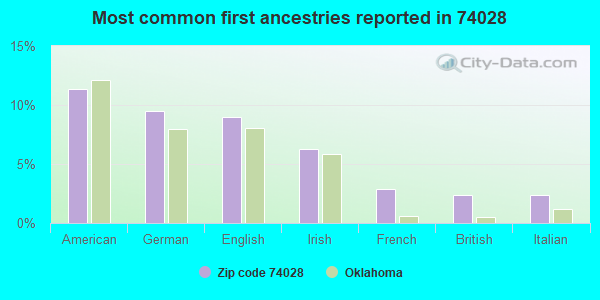
11%American
9%German
9%English
6%Irish
3%French
2%British
2%Italian
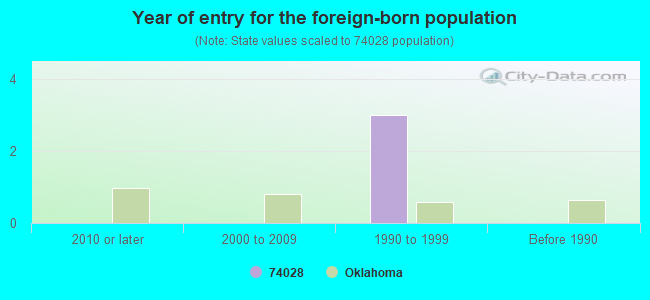
Year of entry for the foreign-born population
02010 or later
02000 to 2009
31990 to 1999
0Before 1990
Facilities with environmental interests located in this zip code:
DEPEW ES (500 W 7TH ST. in DEPEW, OK)
(National Center for Education Statistics) - STATE ID-19-I021-105
DEPEW HS (725 SIMS in DEPEW, OK)
(National Center for Education Statistics) - STATE ID-19-I021-705
DEPEW SCHOOL SYSTEM (725 SIMMS STREET, P O BOX 257 in DEPEW, OK)
COMPLIANCE ACTIVITY (Tracking inspections of insecticide, fungicide, and rodenticide, and toxic substances)
ASSOCIATED NATURAL GAS/MILFAY GAS PLANT (GO 6M SW ON HWY66 TO SH THEN S 2M TO FACILITY in DEPEW, OK)
CRITERIA AND HAZARDOUS AIR POLLUTANT INVENTORY (Inventory of air pollution sources) Business SIC classification: NATURAL GAS LIQUIDS Business NAICS classification: NATURAL GAS LIQUID EXTRACTION.
Housing units lacking complete plumbing facilities: 5.3% Housing units lacking complete kitchen facilities: 5.2%
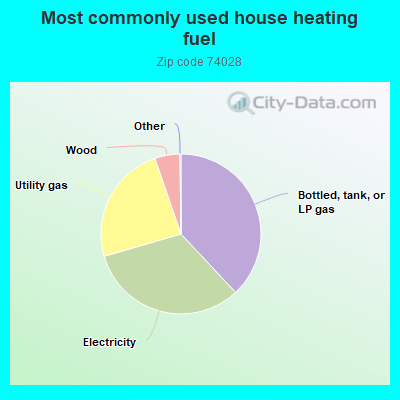
38.2%Bottled, tank, or LP gas
32.6%Electricity
24.3%Utility gas
5.1%Wood
Population in 1990: 2,224.
Place of birth for U.S.-born residents:
This state: 1,172
Northeast: 9
Midwest: 69
South: 165
West: 112
62% of the 74028 zip code residents lived in the same house 5 years ago. Out of people who lived in different houses, 58% lived in this county. Out of people who lived in different counties, 50% lived in Oklahoma.
99% of the 74028 zip code residents lived in the same house 1 year ago. Out of people who lived in different houses, 112% moved from this county. Out of people who lived in different houses, 100% moved from different county within same state.
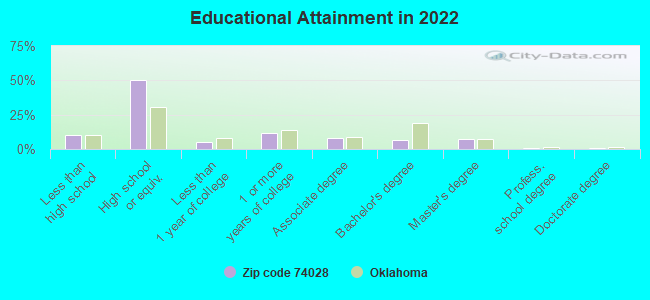
Private vs. public school enrollment:
Students in private schools in grades 1 to 8 (elementary and middle school): 5
Here:
2.8%
Oklahoma:
11.7%
Students in private schools in grades 9 to 12 (high school): 9
Here:
9.8%
Oklahoma:
11.7%
Students in private undergraduate colleges: 2
Here:
14.7%
Oklahoma:
19.3%
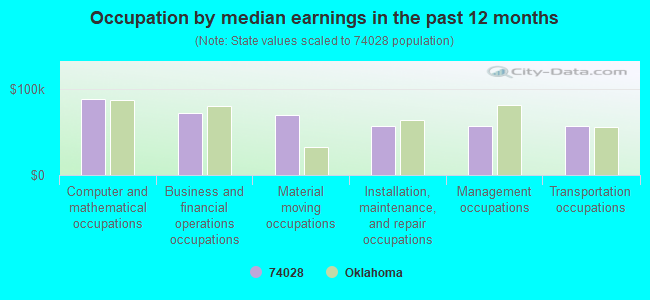
Occupation by median earnings in the past 12 months ($)
88,551Computer and mathematical occupations
71,730Business and financial operations occupations
69,785Material moving occupations
57,466Installation, maintenance, and repair occupations
56,838Management occupations
56,684Transportation occupations
Top industries in this zip code by the number of employees in 2005:
Administrative and Support and Waste Management and Remediation Services: Remediation Services (100-249 employees: 1 establishment)
Construction: Other Building Equipment Contractors (20-49: 1)
Professional, Scientific, and Technical Services: Photography Studios, Portrait (10-19: 1)
Mining: Support Activities for Oil and Gas Operations (5-9: 1, 1-4: 1)
Health Care and Social Assistance: Offices of Dentists (5-9: 1)
Wholesale Trade: Farm and Garden Machinery and Equipment Merchant Wholesalers (5-9: 1)
Finance and Insurance: Commercial Banking (5-9: 1)
Construction: Flooring Contractors (1-4: 1)
Health Care and Social Assistance: Offices of Physicians (except Mental Health Specialists) (1-4: 1)
Fatal accident statistics in 2014:
Fatal accident count: 1
Vehicles involved in fatal accidents: 1
Fatal accidents caused by drunken drivers: 1
Fatalities: 1
Persons involved in fatal accidents: 2
Pedestrians involved in fatal accidents: 0
Fatal accident statistics in 2012:
Fatal accident count: 2
Vehicles involved in fatal accidents: 3
Fatal accidents caused by drunken drivers: 1
Fatalities: 3
Persons involved in fatal accidents: 6
Pedestrians involved in fatal accidents: 0
Home Mortgage Disclosure Act Aggregated Statistics For Year 2009 (Based on 4 partial tracts)
A) FHA, FSA/RHS & VA Home Purchase Loans
B) Conventional Home Purchase Loans
C) Refinancings
D) Home Improvement Loans
F) Non-occupant Loans on < 5 Family Dwellings (A B C & D)
G) Loans On Manufactured Home Dwelling (A B C & D)
Number
Average Value
Number
Average Value
Number
Average Value
Number
Average Value
Number
Average Value
Number
Average Value
LOANS ORIGINATED
6
$121,153
10
$74,140
43
$103,540
8
$53,599
3
$247,260
16
$57,165
APPLICATIONS APPROVED, NOT ACCEPTED
1
$111,830
3
$111,740
3
$100,293
1
$35,310
0
$0
2
$45,210
APPLICATIONS DENIED
1
$74,580
8
$68,724
18
$133,040
5
$8,888
2
$22,145
7
$60,883
APPLICATIONS WITHDRAWN
2
$156,090
4
$66,215
8
$108,228
1
$15,700
1
$61,000
1
$34,660
FILES CLOSED FOR INCOMPLETENESS
1
$69,670
2
$196,490
2
$176,580
0
$0
1
$123,610
0
$0
Aggregated Statistics For Year 2008 (Based on 4 partial tracts)
A) FHA, FSA/RHS & VA Home Purchase Loans
B) Conventional Home Purchase Loans
C) Refinancings
D) Home Improvement Loans
F) Non-occupant Loans on < 5 Family Dwellings (A B C & D)
G) Loans On Manufactured Home Dwelling (A B C & D)
Number
Average Value
Number
Average Value
Number
Average Value
Number
Average Value
Number
Average Value
Number
Average Value
LOANS ORIGINATED
5
$139,416
18
$119,460
38
$104,731
12
$47,334
4
$160,572
15
$59,859
APPLICATIONS APPROVED, NOT ACCEPTED
1
$105,020
3
$87,410
3
$107,743
1
$22,700
0
$0
3
$63,607
APPLICATIONS DENIED
2
$164,875
10
$93,454
20
$115,006
4
$52,885
0
$0
13
$79,094
APPLICATIONS WITHDRAWN
1
$48,520
2
$36,445
11
$132,512
1
$44,110
0
$0
1
$42,290
FILES CLOSED FOR INCOMPLETENESS
0
$0
0
$0
5
$113,384
0
$0
0
$0
0
$0
Aggregated Statistics For Year 2007 (Based on 4 partial tracts)
A) FHA, FSA/RHS & VA Home Purchase Loans
B) Conventional Home Purchase Loans
C) Refinancings
D) Home Improvement Loans
F) Non-occupant Loans on < 5 Family Dwellings (A B C & D)
G) Loans On Manufactured Home Dwelling (A B C & D)
Number
Average Value
Number
Average Value
Number
Average Value
Number
Average Value
Number
Average Value
Number
Average Value
LOANS ORIGINATED
2
$118,330
22
$95,865
44
$86,966
16
$28,854
5
$65,718
21
$54,565
APPLICATIONS APPROVED, NOT ACCEPTED
0
$0
4
$85,702
8
$98,280
1
$17,660
0
$0
5
$69,084
APPLICATIONS DENIED
0
$0
7
$72,994
32
$104,908
9
$39,189
0
$0
6
$76,873
APPLICATIONS WITHDRAWN
1
$74,160
3
$61,427
11
$108,258
1
$59,620
1
$18,840
4
$72,218
FILES CLOSED FOR INCOMPLETENESS
1
$69,450
1
$98,880
4
$109,920
0
$0
0
$0
1
$69,450
Aggregated Statistics For Year 2006 (Based on 4 partial tracts)
A) FHA, FSA/RHS & VA Home Purchase Loans
B) Conventional Home Purchase Loans
C) Refinancings
D) Home Improvement Loans
F) Non-occupant Loans on < 5 Family Dwellings (A B C & D)
G) Loans On Manufactured Home Dwelling (A B C & D)
Number
Average Value
Number
Average Value
Number
Average Value
Number
Average Value
Number
Average Value
Number
Average Value
LOANS ORIGINATED
4
$70,495
28
$59,427
35
$62,160
21
$25,062
7
$57,721
23
$43,206
APPLICATIONS APPROVED, NOT ACCEPTED
1
$18,250
9
$52,400
3
$99,607
2
$24,720
1
$17,660
8
$55,361
APPLICATIONS DENIED
1
$68,280
12
$54,307
25
$77,865
5
$47,192
0
$0
15
$58,667
APPLICATIONS WITHDRAWN
0
$0
5
$70,694
13
$87,487
1
$24,960
1
$14,130
2
$81,210
FILES CLOSED FOR INCOMPLETENESS
0
$0
0
$0
2
$81,780
0
$0
0
$0
0
$0
Aggregated Statistics For Year 2005 (Based on 4 partial tracts)
A) FHA, FSA/RHS & VA Home Purchase Loans
B) Conventional Home Purchase Loans
C) Refinancings
D) Home Improvement Loans
F) Non-occupant Loans on < 5 Family Dwellings (A B C & D)
G) Loans On Manufactured Home Dwelling (A B C & D)
Number
Average Value
Number
Average Value
Number
Average Value
Number
Average Value
Number
Average Value
Number
Average Value
LOANS ORIGINATED
3
$88,853
27
$66,652
33
$55,783
13
$19,445
6
$32,497
23
$40,178
APPLICATIONS APPROVED, NOT ACCEPTED
0
$0
9
$69,684
4
$84,078
1
$29,090
0
$0
9
$63,083
APPLICATIONS DENIED
0
$0
14
$65,609
17
$86,989
6
$32,393
1
$42,950
9
$53,701
APPLICATIONS WITHDRAWN
0
$0
6
$69,865
14
$98,789
3
$50,807
1
$2,940
4
$64,228
FILES CLOSED FOR INCOMPLETENESS
0
$0
1
$94,760
1
$100,060
1
$72,990
0
$0
0
$0
Aggregated Statistics For Year 2004 (Based on 4 partial tracts)
A) FHA, FSA/RHS & VA Home Purchase Loans
B) Conventional Home Purchase Loans
C) Refinancings
D) Home Improvement Loans
F) Non-occupant Loans on < 5 Family Dwellings (A B C & D)
G) Loans On Manufactured Home Dwelling (A B C & D)
Number
Average Value
Number
Average Value
Number
Average Value
Number
Average Value
Number
Average Value
Number
Average Value
LOANS ORIGINATED
1
$115,640
21
$46,297
29
$77,775
12
$35,158
6
$60,073
17
$33,351
APPLICATIONS APPROVED, NOT ACCEPTED
0
$0
9
$43,697
3
$62,240
0
$0
1
$14,130
7
$46,014
APPLICATIONS DENIED
1
$18,720
19
$52,720
19
$76,679
7
$19,140
1
$15,250
14
$44,781
APPLICATIONS WITHDRAWN
0
$0
5
$53,150
12
$102,208
1
$43,320
1
$70,310
5
$53,610
FILES CLOSED FOR INCOMPLETENESS
0
$0
0
$0
2
$97,705
0
$0
0
$0
1
$53,380
Aggregated Statistics For Year 2003 (Based on 4 partial tracts)
A) FHA, FSA/RHS & VA Home Purchase Loans
B) Conventional Home Purchase Loans
C) Refinancings
D) Home Improvement Loans
F) Non-occupant Loans on < 5 Family Dwellings (A B C & D)
Number
Average Value
Number
Average Value
Number
Average Value
Number
Average Value
Number
Average Value
LOANS ORIGINATED
1
$83,880
20
$59,837
37
$71,997
9
$15,808
3
$73,857
APPLICATIONS APPROVED, NOT ACCEPTED
0
$0
3
$45,220
4
$63,175
0
$0
0
$0
APPLICATIONS DENIED
1
$22,180
12
$44,271
33
$74,398
5
$38,600
2
$48,745
APPLICATIONS WITHDRAWN
0
$0
4
$51,530
11
$76,305
2
$13,700
1
$21,180
FILES CLOSED FOR INCOMPLETENESS
0
$0
1
$55,110
3
$120,050
0
$0
0
$0
Aggregated Statistics For Year 2002 (Based on 4 partial tracts)
A) FHA, FSA/RHS & VA Home Purchase Loans
B) Conventional Home Purchase Loans
C) Refinancings
D) Home Improvement Loans
F) Non-occupant Loans on < 5 Family Dwellings (A B C & D)
Number
Average Value
Number
Average Value
Number
Average Value
Number
Average Value
Number
Average Value
LOANS ORIGINATED
3
$91,530
13
$65,989
34
$69,511
9
$24,100
3
$12,407
APPLICATIONS APPROVED, NOT ACCEPTED
0
$0
1
$84,920
7
$56,309
0
$0
0
$0
APPLICATIONS DENIED
0
$0
16
$40,318
15
$56,655
2
$12,130
0
$0
APPLICATIONS WITHDRAWN
0
$0
4
$65,650
9
$70,577
2
$34,645
0
$0
FILES CLOSED FOR INCOMPLETENESS
0
$0
1
$44,730
1
$67,560
0
$0
0
$0
Aggregated Statistics For Year 2001 (Based on 4 partial tracts)
A) FHA, FSA/RHS & VA Home Purchase Loans
B) Conventional Home Purchase Loans
C) Refinancings
D) Home Improvement Loans
F) Non-occupant Loans on < 5 Family Dwellings (A B C & D)
Number
Average Value
Number
Average Value
Number
Average Value
Number
Average Value
Number
Average Value
LOANS ORIGINATED
3
$83,077
21
$25,537
26
$53,368
10
$22,249
6
$16,332
APPLICATIONS APPROVED, NOT ACCEPTED
0
$0
3
$44,013
2
$55,620
0
$0
0
$0
APPLICATIONS DENIED
0
$0
22
$34,933
10
$46,900
4
$6,055
0
$0
APPLICATIONS WITHDRAWN
0
$0
3
$42,683
7
$70,896
1
$16,290
0
$0
FILES CLOSED FOR INCOMPLETENESS
0
$0
0
$0
1
$92,780
0
$0
0
$0
Aggregated Statistics For Year 2000 (Based on 4 partial tracts)
A) FHA, FSA/RHS & VA Home Purchase Loans
B) Conventional Home Purchase Loans
C) Refinancings
D) Home Improvement Loans
F) Non-occupant Loans on < 5 Family Dwellings (A B C & D)
Number
Average Value
Number
Average Value
Number
Average Value
Number
Average Value
Number
Average Value
LOANS ORIGINATED
1
$67,730
22
$52,549
29
$48,706
17
$15,271
3
$14,063
APPLICATIONS APPROVED, NOT ACCEPTED
0
$0
5
$44,378
1
$140,550
2
$6,110
0
$0
APPLICATIONS DENIED
0
$0
10
$45,686
8
$42,364
2
$9,160
0
$0
APPLICATIONS WITHDRAWN
0
$0
4
$43,198
2
$63,225
2
$46,965
0
$0
FILES CLOSED FOR INCOMPLETENESS
1
$35,320
0
$0
0
$0
0
$0
0
$0
Aggregated Statistics For Year 1999 (Based on 2 partial tracts)
A) FHA, FSA/RHS & VA Home Purchase Loans
B) Conventional Home Purchase Loans
C) Refinancings
D) Home Improvement Loans
F) Non-occupant Loans on < 5 Family Dwellings (A B C & D)


 Nearest zip codes: 74046, 74068, 74079, 74010, 74030, 74071.