Estimated zip code population in 2022: 22,355 Zip code population in 2010: 15,083 Zip code population in 2000: 12,998
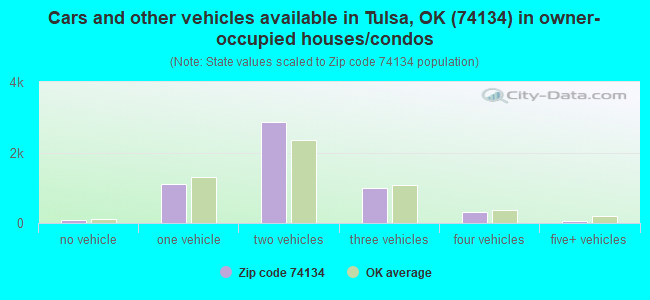
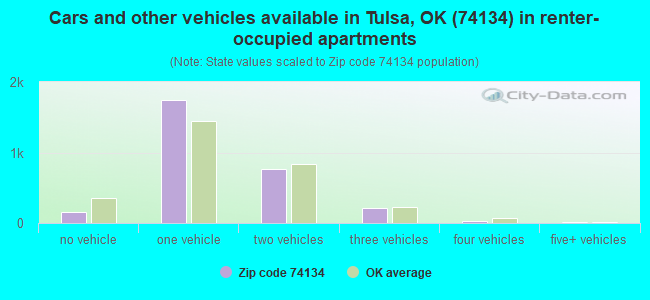
Houses and condos: 9,063 Renter-occupied apartments: 2,941
% of renters here:
35%
State:
35%
March 2022 cost of living index in zip code 74134: 86.3 (less than average, U.S. average is 100)
Land area: 11.0 sq. mi. Water area: 0.4 sq. mi.
Population density: 2,026 people per square mile
(low).
OSM Map
General Map
Google Map
MSN Map
OSM Map
General Map
Google Map
MSN Map
OSM Map
General Map
Google Map
MSN Map
OSM Map
General Map
Google Map
MSN Map
Please wait while loading the map...
Real estate property taxes paid for housing units in 2022:
This zip code:
1.0% ($2,206)
Oklahoma:
0.8% ($1,501)
Median real estate property taxes paid for housing units with mortgages in 2022: $2,383 (1.0%) Median real estate property taxes paid for housing units with no mortgage in 2022: $1,889 (1.1%)
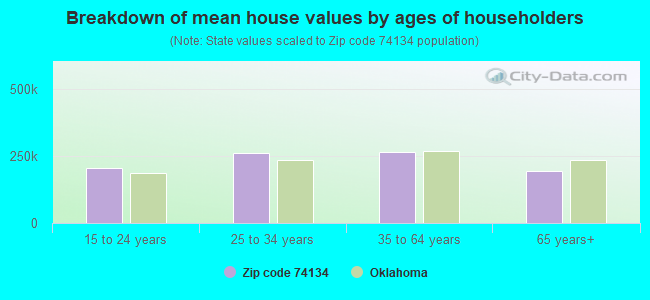
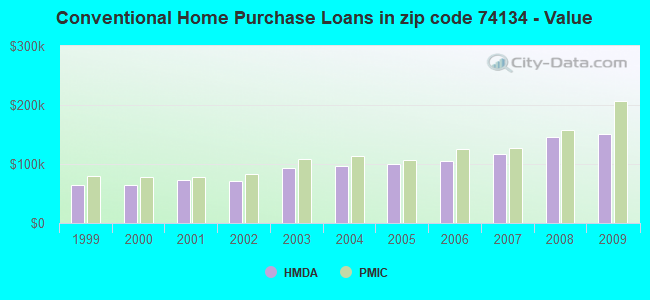
Estimated median house/condo value in 2022: $218,010
74134:
$218,010
Oklahoma:
$191,700
According to our research of Oklahoma and other state lists, there were 18 registered sex offenders living in 74134 zip code as of April 24, 2024. The ratio of all residents to sex offenders in zip code 74134 is 942 to 1. The ratio of registered sex offenders to all residents in this zip code is lower than the state average.
Median resident age:
This zip code:
35.5 years
Oklahoma median age:
37.1 years
Average household size:
This zip code:
2.7 people
Oklahoma:
2.5 people
Averages for the 2020 tax year for zip code 74134, filed in 2021:
Average Adjusted Gross Income (AGI) in 2020: $60,775 (Individual Income Tax Returns)
Here:
$60,775
State:
$63,060
Salary/wage: $56,145 (reported on 86.7% of returns)
Here:
$56,145
State:
$52,427
(% of AGI for various income ranges: 1212.9% for AGIs below $25k, 3663.0% for AGIs $25k-50k, 6560.4% for AGIs $50k-75k, 9733.3% for AGIs $75k-100k, 18286.5% for AGIs $100k-200k, 54071.9% for AGIs over 200k)
Taxable interest for individuals: $745 (reported on 24.0% of returns)
This zip code:
$745
Oklahoma:
$1,603
(% of AGI for various income ranges: 8.9% for AGIs below $25k, 9.7% for AGIs $25k-50k, 33.0% for AGIs $50k-75k, 33.3% for AGIs $75k-100k, 60.8% for AGIs $100k-200k, 166.9% for AGIs over 200k)
Ordinary dividends: $2,784 (reported on 12.0% of returns)
Here:
$2,784
State:
$7,001
(% of AGI for various income ranges: 11.5% for AGIs below $25k, 11.5% for AGIs $25k-50k, 41.1% for AGIs $50k-75k, 55.2% for AGIs $75k-100k, 109.6% for AGIs $100k-200k, 664.4% for AGIs over 200k)
Net capital gain/loss in AGI: +$7,178 (reported on 11.3% of returns)
Here:
+$7,178
State:
+$19,855
(% of AGI for various income ranges: 4.2% for AGIs below $25k, 12.6% for AGIs $25k-50k, 39.3% for AGIs $50k-75k, 100.5% for AGIs $75k-100k, 308.3% for AGIs $100k-200k, 2498.1% for AGIs over 200k)
Profit/loss from business: +$10,463 (reported on 17.6% of returns)
Here:
+$10,463
State:
+$9,904
(% of AGI for various income ranges: 166.4% for AGIs below $25k, 149.5% for AGIs $25k-50k, 236.9% for AGIs $50k-75k, 226.5% for AGIs $75k-100k, 412.0% for AGIs $100k-200k, 2142.5% for AGIs over 200k)
Taxable individual retirement arrangement distribution: $18,464 (reported on 5.9% of returns)
74134:
$18,464
Oklahoma:
$20,476
(% of AGI for various income ranges: 33.4% for AGIs below $25k, 51.9% for AGIs $25k-50k, 168.6% for AGIs $50k-75k, 287.6% for AGIs $75k-100k, 353.0% for AGIs $100k-200k, 1447.5% for AGIs over 200k)
Total itemized deductions: $32,690 (reported on 8.3% of returns)
Here:
$32,690
State:
$39,736
(% of AGI for various income ranges: 26.9% for AGIs below $25k, 73.4% for AGIs $25k-50k, 272.8% for AGIs $50k-75k, 450.5% for AGIs $75k-100k, 1112.0% for AGIs $100k-200k, 5873.1% for AGIs over 200k)
Charity contributions: $13,164 (reported on 6.6% of returns)
Here:
$13,164
State:
$17,288
(% of AGI for various income ranges: 17.4% for AGIs $25k-50k, 53.5% for AGIs $50k-75k, 103.8% for AGIs $75k-100k, 355.5% for AGIs $100k-200k, 2551.2% for AGIs over 200k)
Taxes paid: $7,385 (reported on 8.3% of returns)
74134:
$7,385
State:
$7,046
(% of AGI for various income ranges: 3.5% for AGIs below $25k, 11.8% for AGIs $25k-50k, 57.7% for AGIs $50k-75k, 118.6% for AGIs $75k-100k, 314.9% for AGIs $100k-200k, 1054.4% for AGIs over 200k)
Earned income credit: $2,510 (reported on 19.2% of returns)
Here:
$2,510
State:
$2,435
(% of AGI for various income ranges: 112.0% for AGIs below $25k, 88.3% for AGIs $25k-50k, 1.6% for AGIs $50k-75k)
Percentage of individuals using paid preparers for their 2020 taxes: 93.5%
Here:
93%
State:
94%
(% for various income ranges: 92.5% for AGIs below $25k, 93.4% for AGIs $25k-50k, 94.1% for AGIs $50k-75k, 94.5% for AGIs $75k-100k, 94.1% for AGIs $100k-200k, 94.7% for AGIs over 200k)
Averages for the 2012 tax year for zip code 74134, filed in 2013:
Average Adjusted Gross Income (AGI) in 2012: $51,853 (Individual Income Tax Returns)
Here:
$51,853
State:
$58,581
Salary/wage: $48,205 (reported on 90.9% of returns)
Here:
$48,205
State:
$45,973
(% of AGI for various income ranges: 81.6% for AGIs below $25k, 87.5% for AGIs $25k-50k, 87.0% for AGIs $50k-75k, 87.4% for AGIs $75k-100k, 86.3% for AGIs $100k-200k, 71.2% for AGIs over 200k)
Taxable interest for individuals: $568 (reported on 26.4% of returns)
This zip code:
$568
Oklahoma:
$1,625
(% of AGI for various income ranges: 0.5% for AGIs below $25k, 0.2% for AGIs $25k-50k, 0.4% for AGIs $50k-75k, 0.3% for AGIs $75k-100k, 0.2% for AGIs $100k-200k, 0.2% for AGIs over 200k)
Ordinary dividends: $1,730 (reported on 10.3% of returns)
Here:
$1,730
State:
$6,374
(% of AGI for various income ranges: 0.5% for AGIs below $25k, 0.3% for AGIs $25k-50k, 0.3% for AGIs $50k-75k, 0.2% for AGIs $75k-100k, 0.5% for AGIs $100k-200k, 0.3% for AGIs over 200k)
Net capital gain/loss in AGI: +$4,932 (reported on 8.0% of returns)
Here:
+$4,932
State:
+$24,023
(% of AGI for various income ranges: 0.2% for AGIs $50k-75k, 0.4% for AGIs $75k-100k, 0.7% for AGIs $100k-200k, 3.8% for AGIs over 200k)
Profit/loss from business: +$10,062 (reported on 14.9% of returns)
Here:
+$10,062
State:
+$11,913
(% of AGI for various income ranges: 9.6% for AGIs below $25k, 3.3% for AGIs $25k-50k, 2.4% for AGIs $50k-75k, 1.5% for AGIs $75k-100k, 1.5% for AGIs $100k-200k, 2.4% for AGIs over 200k)
Taxable individual retirement arrangement distribution: $13,374 (reported on 5.9% of returns)
74134:
$13,374
Oklahoma:
$15,242
(% of AGI for various income ranges: 1.5% for AGIs below $25k, 1.5% for AGIs $25k-50k, 1.8% for AGIs $50k-75k, 1.5% for AGIs $75k-100k, 2.1% for AGIs $100k-200k)
Total itemized deductions: $20,260 (21% of AGI, reported on 30.6% of returns)
Here:
$20,260
State:
$24,882
Here:
21.1% of AGI
State:
18.8% of AGI
(% of AGI for various income ranges: 6.1% for AGIs below $25k, 8.5% for AGIs $25k-50k, 11.2% for AGIs $50k-75k, 13.1% for AGIs $75k-100k, 15.4% for AGIs $100k-200k, 13.5% for AGIs over 200k)
Charity contributions: $4,584 (reported on 24.4% of returns)
Here:
$4,584
State:
$6,591
(% of AGI for various income ranges: 0.6% for AGIs below $25k, 1.2% for AGIs $25k-50k, 1.9% for AGIs $50k-75k, 2.3% for AGIs $75k-100k, 3.0% for AGIs $100k-200k, 3.1% for AGIs over 200k)
Taxes paid: $6,214 (reported on 30.3% of returns)
74134:
$6,214
State:
$7,196
(% of AGI for various income ranges: 0.8% for AGIs below $25k, 1.7% for AGIs $25k-50k, 3.1% for AGIs $50k-75k, 4.0% for AGIs $75k-100k, 5.2% for AGIs $100k-200k, 5.5% for AGIs over 200k)
Earned income credit: $2,458 (reported on 20.7% of returns)
Here:
$2,458
State:
$2,354
(% of AGI for various income ranges: 7.8% for AGIs below $25k, 1.3% for AGIs $25k-50k)
Percentage of individuals using paid preparers for their 2012 taxes: 49.9%
Here:
50%
State:
56%
(% for various income ranges: 47.4% for AGIs below $25k, 51.2% for AGIs $25k-50k, 50.9% for AGIs $50k-75k, 50.7% for AGIs $75k-100k, 51.8% for AGIs $100k-200k, 60.0% for AGIs over 200k)
Averages for the 2004 tax year for zip code 74134, filed in 2005:
Average Adjusted Gross Income (AGI) in 2004: $34,662 (Individual Income Tax Returns)
Here:
$34,662
State:
$41,245
Salary/wage: $33,629 (reported on 91.1% of returns)
Here:
$33,629
State:
$35,318
(% of AGI for various income ranges: 98.6% for AGIs below $10k, 87.2% for AGIs $10k-25k, 90.0% for AGIs $25k-50k, 90.0% for AGIs $50k-75k, 88.6% for AGIs $75k-100k, 79.3% for AGIs over 100k)
Taxable interest for individuals: $780 (reported on 32.2% of returns)
This zip code:
$780
Oklahoma:
$1,745
(% of AGI for various income ranges: 1.6% for AGIs below $10k, 1.0% for AGIs $10k-25k, 0.6% for AGIs $25k-50k, 0.8% for AGIs $50k-75k, 0.5% for AGIs $75k-100k, 0.7% for AGIs over 100k)
Taxable dividends: $638 (reported on 11.0% of returns)
Here:
$638
State:
$2,920
(% of AGI for various income ranges: 0.7% for AGIs below $10k, 0.3% for AGIs $10k-25k, 0.2% for AGIs $25k-50k, 0.2% for AGIs $50k-75k, 0.1% for AGIs $75k-100k, 0.2% for AGIs over 100k)
Net capital gain/loss: +$624 (reported on 8.0% of returns)
Here:
+$624
State:
+$10,653
(% of AGI for various income ranges: -0.7% for AGIs below $10k, -0.1% for AGIs $10k-25k, -0.0% for AGIs $25k-50k, 0.0% for AGIs $50k-75k, 0.2% for AGIs $75k-100k, 1.4% for AGIs over 100k)
Profit/loss from business: +$4,630 (reported on 14.1% of returns)
Here:
+$4,630
State:
+$8,532
(% of AGI for various income ranges: 2.6% for AGIs below $10k, 4.0% for AGIs $10k-25k, 1.7% for AGIs $25k-50k, 1.4% for AGIs $50k-75k, 1.4% for AGIs $75k-100k, 1.3% for AGIs over 100k)
IRA payment deduction: $2,548 (reported on 1.7% of returns)
74134:
$2,548
Oklahoma:
$3,127
(% of AGI for various income ranges: 0.5% for AGIs below $10k, 0.1% for AGIs $25k-50k, 0.2% for AGIs $50k-75k, 0.2% for AGIs $75k-100k)
Total itemized deductions: $13,479 (23% of AGI, reported on 33.6% of returns)
Here:
$13,479
State:
$17,093
Here:
23.1% of AGI
State:
20.5% of AGI
(% of AGI for various income ranges: 9.6% for AGIs below $10k, 6.4% for AGIs $10k-25k, 12.2% for AGIs $25k-50k, 14.4% for AGIs $50k-75k, 15.8% for AGIs $75k-100k, 17.7% for AGIs over 100k)
Charity contributions deductions: $2,823 (5% of AGI, reported on 28.5% of returns)
Here:
$2,823
State:
$4,240
Here:
4.7% of AGI
State:
4.8% of AGI
(% of AGI for various income ranges: 1.1% for AGIs below $10k, 0.9% for AGIs $10k-25k, 1.7% for AGIs $25k-50k, 2.7% for AGIs $50k-75k, 3.2% for AGIs $75k-100k, 3.8% for AGIs over 100k)
Total tax: $3,945 (reported on 69.8% of returns)
74134:
$3,945
State:
$6,542
(% of AGI for various income ranges: 2.5% for AGIs below $10k, 3.6% for AGIs $10k-25k, 5.9% for AGIs $25k-50k, 8.8% for AGIs $50k-75k, 10.5% for AGIs $75k-100k, 14.0% for AGIs over 100k)
Earned income credit: $1,856 (reported on 20.1% of returns)
Here:
$1,856
State:
$1,830
Percentage of individuals using paid preparers for their 2004 taxes: 56.5%
Here:
56%
State:
63%
(% for various income ranges: 51.9% for AGIs below $10k, 63.3% for AGIs $10k-25k, 56.3% for AGIs $25k-50k, 52.2% for AGIs $50k-75k, 50.3% for AGIs $75k-100k, 56.8% for AGIs over 100k)
Likely homosexual households (counted as self-reported same-sex unmarried-partner households)
Lesbian couples: 0.1% of all households
Gay men: 0.1% of all households
Household received Food Stamps/SNAP in the past 12 months: 812 Household did not receive Food Stamps/SNAP in the past 12 months: 7,469
Women who had a birth in the past 12 months: 339 (234 now married, 104 unmarried) Women who did not have a birth in the past 12 months: 5,280 (2,947 now married, 2,333 unmarried)
Housing units in zip code 74134 with a mortgage: 4,012 (337 second mortgage, 254 both second mortgage and home equity loan) Houses without a mortgage: 49
Median monthly owner costs for units with a mortgage: $1,537 Median monthly owner costs for units without a mortgage: $565
Residents with income below the poverty level in 2022:
This zip code:
11.3%
Whole state:
15.7%
Residents with income below 50% of the poverty level in 2022:
This zip code:
6.4%
Whole state:
8.3%
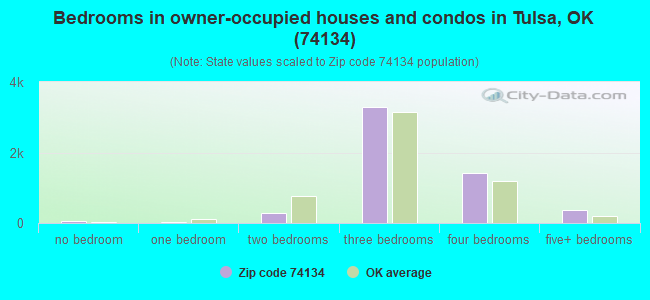
Median number of rooms in houses and condos:
Here:
6.0
State:
6.1
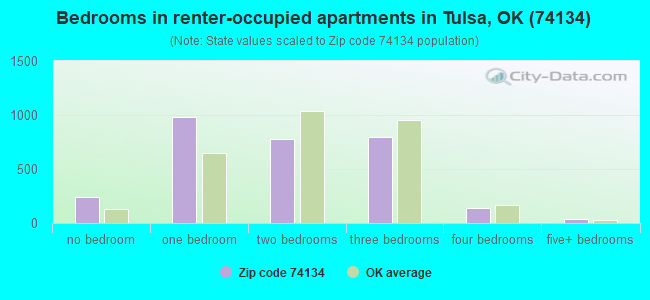
Median number of rooms in apartments:
Here:
4.0
State:
4.5
Notable locations in this zip code not listed on our city pages
Churches in zip code 74134 include: Faith Cumberland Presbyterian Church (A), Korean Grace Church (B), Korean United Methodist Church (C), Life Baptist Church (D), Eagles Nest Church (E), Christ Ministries (F), Church of God in Christ (G), Christian Assembly of God (H), Berean Fellowship (I). Display/hide their locations on the map
In group quarters: 1 (-1 institutionalized population)
Size of family households: 2,392 2-persons, 1,495 3-persons, 1,309 4-persons, 566 5-persons, 221 6-persons, 74 7-or-more-persons
Size of nonfamily households: 1,932 1-person, 300 2-persons, 33 3-persons
4,397 married couples with children.
1,494 single-parent households (447 men, 1,047 women).
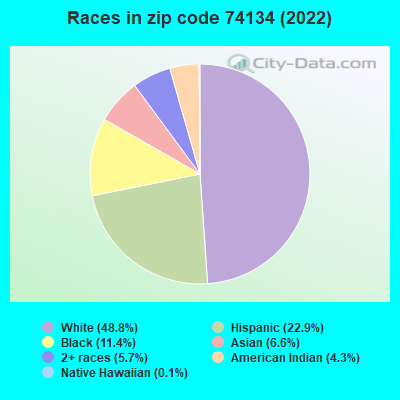
73.0% of residents of 74134 zip code speak English at home.
20.0% of residents speak Spanish at home (50% very well, 23% well, 17% not well, 10% not at all).
0.8% of residents speak other Indo-European language at home (54% very well, 18% well, 28% not well).
6.0% of residents speak Asian or Pacific Island language at home (45% very well, 29% well, 10% not well, 16% not at all).
0.3% of residents speak other language at home (100% very well).
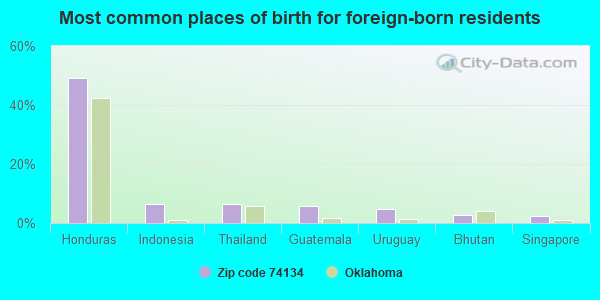
Foreign born population: 3,686 (16.5%) (37.1% of them are naturalized citizens)
Facilities with environmental interests located in this zip code:
CITGO PETROLEUM PRODUCT TECH CENTER (4500 SOUTH 129TH EAST AVENUE in TULSA, OK)
STATE MASTER (Oklahoma environmental compliance activities data) HAZARDOUS WASTE BIENNIAL REPORTER (Resource Conservation and Recovery Act (tracking hazardous waste)) - ICIS-, ENFORCEMENT/COMPLIANCE ACTIVITY Large Quantity Generators, more that 1000 kg of hazardous waste/month (Resource Conservation and Recovery Act (tracking hazardous waste)) - notification - ICIS-, ENFORCEMENT/COMPLIANCE ACTIVITY Organizations: CITGO PETROLEUM CORPORATION (CONTACT/OPERATOR)
, MERIT OCC (CONTACT/OWNER)
Alternative names: CITGO PETROLEUM CORP, CITGO PETROLEUM CORPORATION RESEARCH LAB
ADVANCED COMPOSITES GROUP INCORPORATED (5350 S. 129TH E. AVE. in TULSA, OK)
AIR MAJOR (AIRS/AFS) CRITERIA AND HAZARDOUS AIR POLLUTANT INVENTORY (Inventory of air pollution sources) STATE MASTER (Oklahoma environmental compliance activities data) HAZARDOUS WASTE BIENNIAL REPORTER (Resource Conservation and Recovery Act (tracking hazardous waste)) Large Quantity Generators, more that 1000 kg of hazardous waste/month (Resource Conservation and Recovery Act (tracking hazardous waste)) - notification TRI REPORTER (Tracking of toxic chemicals releasing facilities) Business SIC classification: COATED FABRICS, NOT RUBBERIZED Business NAICS classification: FABRIC COATING MILLS.; ALL OTHER PLASTICS PRODUCT MANUFACTURING. Alternative names: ADVANCE COMPOSITES /5350 S 129TH E AVE, ADVANCED COMPOSITES GROUP INC.
ANDERSEN ES (1200 SO. WILLOW AVE. in TULSA, OK)
(National Center for Education Statistics) - STATE ID-72-I009-130 Organizations: UNION (SCHOOL DISTRICT)
BOEVERS ES (3433 SO. 133RD E. AVE. in TULSA, OK)
(National Center for Education Statistics) - STATE ID-72-I009-115 Organizations: UNION (SCHOOL DISTRICT)
A.B. JEWEL WATER TREATMENT (18707 EAST 21ST STREET in TULSA, OK)
National Pollutant Discharge Elimination System NON-MAJOR (Tracking pollutant discharge elimination systems) - permit Conditionally Exempt Small Quantity Generators, less than 100 kg/month of hazardous waste (Resource Conservation and Recovery Act (tracking hazardous waste)) HAZARDOUS WASTE BIENNIAL REPORTER (Resource Conservation and Recovery Act (tracking hazardous waste)) Business SIC classification: WATER SUPPLY Organizations: CITY OF TULSA (CONTACT/OPERATOR)
Alternative names: A B JEWELL WATER TREATMENT PLANT, CITY OF TULSA - A B JEWELL LAB, TULSA MUA - A.B. JEWELL, TULSA, MUA-AB JEWELL
GLOBE CLNRS PARK/3171 C S 129TH (GLOB (3171-C S 129TH E AVE in TULSA, OK)
AIR SYNTHETIC MINOR (AIRS/AFS) Business SIC classification: DRYCLEANING PLANTS, EXCEPT RUG CLEANING Alternative names: GLOBE CLEANERS II, GLOBE CLEANERS P 3171 C SOUTH 129TH
Housing units lacking complete plumbing facilities: 0.2% Housing units lacking complete kitchen facilities: 1.5%
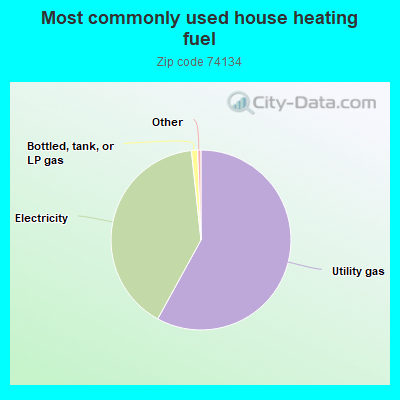
58.0%Utility gas
40.3%Electricity
1.1%Bottled, tank, or LP gas
Population in 1990: 12,607. Population change in the 1990s: +391 (+3.1%).
Place of birth for U.S.-born residents:
This state: 11,045
Northeast: 925
Midwest: 2,443
South: 2,435
West: 1,372
42% of the 74134 zip code residents lived in the same house 5 years ago. Out of people who lived in different houses, 62% lived in this county. Out of people who lived in different counties, 50% lived in Oklahoma.
90% of the 74134 zip code residents lived in the same house 1 year ago. Out of people who lived in different houses, 47% moved from this county. Out of people who lived in different houses, 25% moved from different county within same state. Out of people who lived in different houses, 19% moved from different state. Out of people who lived in different houses, 11% moved from abroad.
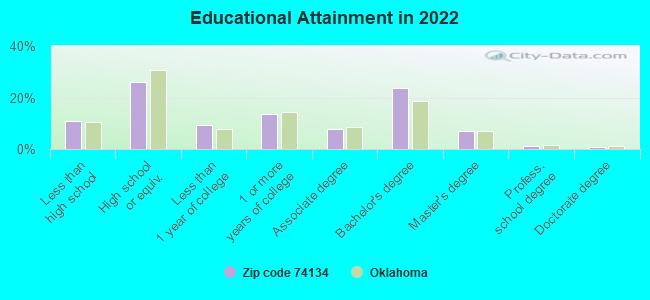
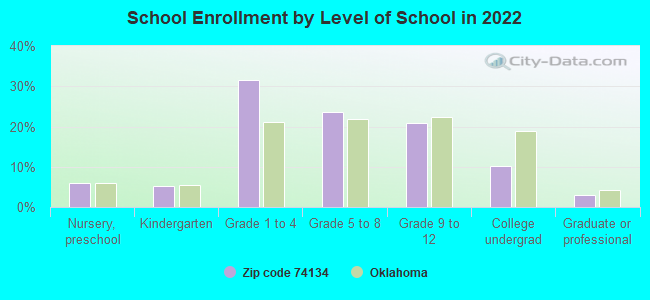
Private vs. public school enrollment:
Students in private schools in grades 1 to 8 (elementary and middle school): 390
Here:
11.6%
Oklahoma:
11.7%
Students in private schools in grades 9 to 12 (high school): 131
Here:
10.3%
Oklahoma:
11.7%
Students in private undergraduate colleges: 216
Here:
33.4%
Oklahoma:
19.3%
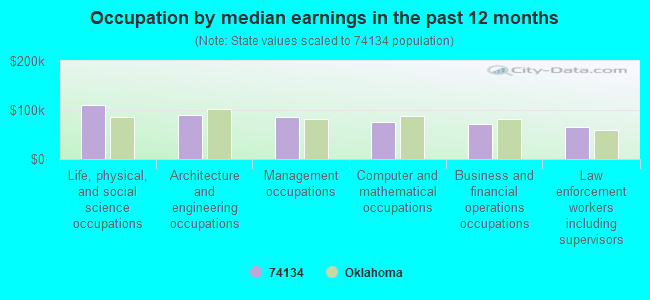
Occupation by median earnings in the past 12 months ($)
111,034Life, physical, and social science occupations
90,758Architecture and engineering occupations
85,705Management occupations
75,035Computer and mathematical occupations
70,844Business and financial operations occupations
65,414Law enforcement workers including supervisors
Companies with federal contracts located in this zip code:
COUNTY OF TULSA (5051 S 129TH EAST AVE in TULSA, OK) : $388,072 in 11 contractsfrom 2000 to 2006
Contracts for Water Quality Studies by U.S. Army Corps of Engineers - civil program financing only, Army Signed by year:2000: $39,200; 2001: $40,500; 2002: $34,400; 2003: $51,600; 2004: $112,660; 2005: $89,868; 2006: $19,844.
Biggest contracts:
$51,600 with U.S. Army Corps of Engineers - civil program financing only for Water Quality Studies. Signed on 2003-03-31. Completion date: 2003-04-18.
$44,934 with Army for Water Quality Studies. Signed on 2005-03-03. Completion date: 2005-09-30.
$44,934 with U.S. Army Corps of Engineers - civil program financing only for Water Quality Studies. Signed on 2005-03-03. Completion date: 2005-09-30.
$40,500, same as above.Signed on 2001-04-18. Completion date: 2001-10-31.
THYSSEN ELEVATOR CO (5854 S 129TH EAST AVE in TULSA, OK) : $131,073 in 4 contractsfrom 1999 to 2000
$79,356 with Air Force for Maintenance, Repair and Rebuilding of Equipment -- Materials Handling Equipment. Taking place in TX. Signed on 2000-10-10. Completion date: 2001-09-30.
$64,242, same as above.Signed on 1999-10-06. Completion date: 2000-09-30.
$0 with Navy for Maintenance, Repair or Alteration of Real Property -- Office Buildings. Taking place in TX. Signed on 2000-10-01. Completion date: 1999-11-10.
-$12,525, same as above.Signed on 2000-10-01. Completion date: 1999-11-10.
OMNI-2 MECHANICAL SERVICES, LL (5918 S 129TH ST EAST AVE in TULSA, OK; small business)
$5,824 with Army for Maintenance, Repair and Rebuilding of Equipment -- Water Purification and Sewage Treatment Equipment. Signed on 2003-09-12. Completion date: 2003-04-12.
Top industries in this zip code by the number of employees in 2005:
Finance and Insurance: Credit Card Issuing (500-999 employees: 1 establishment)
Finance and Insurance: Direct Life Insurance Carriers (500-999: 1)
Administrative and Support and Waste Management and Remediation Services: All Other Travel Arrangement and Reservation Services (250-499: 1, 1-4: 1)
Management of Companies and Enterprises: Corporate, Subsidiary, and Regional Managing Offices (250-499: 1)
Other Services (except Public Administration): Industrial Launderers (100-249: 1)
Construction: Other Foundation, Structure, and Building Exterior Contractors (50-99: 1)
2002 - 2018 National Fire Incident Reporting System (NFIRS) incidents
Based on the data from the years 2002 - 2018 the average number of fires per year is 47. The highest number of fires - 65 took place in 2003, and the least - 35 in 2018. The data has a decreasing trend.
When looking into fire subcategories, the most incidents belonged to: Outside Fires (49.2%), and Structure Fires (32.5%).
Fire incident types reported to NFIRS in Zip Code 74134


 Nearest zip codes: 74108, 74146, 74128, 74012, 74129, 74145.


 Based on the data from the years 2002 - 2018 the average number of fires per year is 47. The highest number of fires - 65 took place in 2003, and the least - 35 in 2018. The data has a decreasing trend.
 When looking into fire subcategories, the most incidents belonged to: Outside Fires (49.2%), and Structure Fires (32.5%).