Estimated zip code population in 2022: 11,491 Zip code population in 2010: 9,805 Zip code population in 2000: 8,762
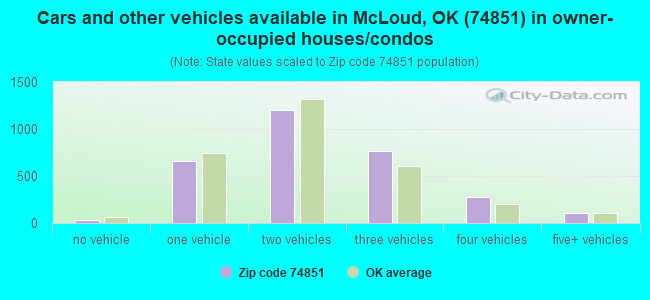
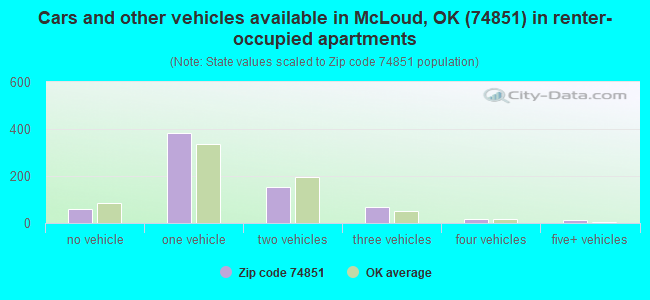
Houses and condos: 3,980 Renter-occupied apartments: 690
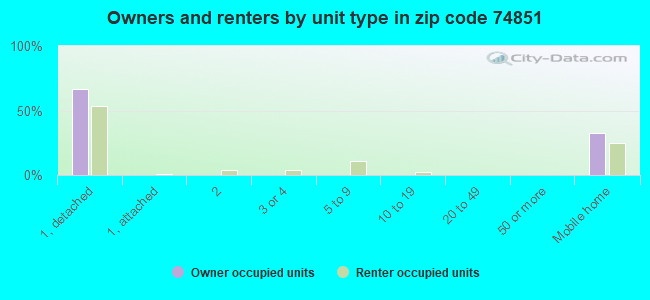
% of renters here:
18%
State:
35%
March 2022 cost of living index in zip code 74851: 78.3 (low, U.S. average is 100)
Land area: 85.2 sq. mi. Water area: 1.1 sq. mi.
Population density: 135 people per square mile
(very low).
OSM Map
General Map
Google Map
MSN Map
OSM Map
General Map
Google Map
MSN Map
OSM Map
General Map
Google Map
MSN Map
OSM Map
General Map
Google Map
MSN Map
Please wait while loading the map...
Real estate property taxes paid for housing units in 2022:
This zip code:
0.5% ($813)
Oklahoma:
0.8% ($1,501)
Median real estate property taxes paid for housing units with mortgages in 2022: $1,056 (0.5%) Median real estate property taxes paid for housing units with no mortgage in 2022: $652 (0.5%)
Averages for the 2020 tax year for zip code 74851, filed in 2021:
Average Adjusted Gross Income (AGI) in 2020: $53,850 (Individual Income Tax Returns)
Here:
$53,850
State:
$63,060
Salary/wage: $46,999 (reported on 81.4% of returns)
Here:
$46,999
State:
$52,427
(% of AGI for various income ranges: 1068.7% for AGIs below $25k, 3160.2% for AGIs $25k-50k, 5654.4% for AGIs $50k-75k, 8723.9% for AGIs $75k-100k, 15129.7% for AGIs $100k-200k, 45606.7% for AGIs over 200k)
Taxable interest for individuals: $787 (reported on 26.0% of returns)
This zip code:
$787
Oklahoma:
$1,603
(% of AGI for various income ranges: 8.0% for AGIs below $25k, 13.6% for AGIs $25k-50k, 25.0% for AGIs $50k-75k, 54.5% for AGIs $75k-100k, 79.4% for AGIs $100k-200k, 286.7% for AGIs over 200k)
Ordinary dividends: $2,288 (reported on 7.9% of returns)
Here:
$2,288
State:
$7,001
(% of AGI for various income ranges: 5.4% for AGIs below $25k, 8.5% for AGIs $25k-50k, 15.4% for AGIs $50k-75k, 55.2% for AGIs $75k-100k, 85.6% for AGIs $100k-200k, 283.3% for AGIs over 200k)
Net capital gain/loss in AGI: +$16,424 (reported on 8.1% of returns)
Here:
+$16,424
State:
+$19,855
(% of AGI for various income ranges: 2.5% for AGIs below $25k, 12.3% for AGIs $25k-50k, 39.0% for AGIs $50k-75k, 70.6% for AGIs $75k-100k, 372.5% for AGIs $100k-200k, 12726.7% for AGIs over 200k)
Profit/loss from business: +$7,381 (reported on 14.8% of returns)
Here:
+$7,381
State:
+$9,904
(% of AGI for various income ranges: 112.9% for AGIs below $25k, 144.6% for AGIs $25k-50k, 117.3% for AGIs $50k-75k, 34.8% for AGIs $75k-100k, 164.7% for AGIs $100k-200k, 2743.3% for AGIs over 200k)
Taxable individual retirement arrangement distribution: $20,535 (reported on 5.5% of returns)
74851:
$20,535
Oklahoma:
$20,476
(% of AGI for various income ranges: 36.8% for AGIs below $25k, 80.0% for AGIs $25k-50k, 119.2% for AGIs $50k-75k, 207.6% for AGIs $75k-100k, 720.0% for AGIs $100k-200k)
Total itemized deductions: $32,625 (reported on 3.8% of returns)
Here:
$32,625
State:
$39,736
(% of AGI for various income ranges: 256.2% for AGIs $50k-75k, 227.3% for AGIs $75k-100k, 591.6% for AGIs $100k-200k, 4150.0% for AGIs over 200k)
Charity contributions: $8,636 (reported on 2.6% of returns)
Here:
$8,636
State:
$17,288
(% of AGI for various income ranges: 12.1% for AGIs $25k-50k, 49.1% for AGIs $75k-100k, 102.5% for AGIs $100k-200k, 1166.7% for AGIs over 200k)
Taxes paid: $5,981 (reported on 3.8% of returns)
74851:
$5,981
State:
$7,046
(% of AGI for various income ranges: 4.4% for AGIs below $25k, 24.2% for AGIs $50k-75k, 41.8% for AGIs $75k-100k, 121.9% for AGIs $100k-200k, 856.7% for AGIs over 200k)
Earned income credit: $2,458 (reported on 20.3% of returns)
Here:
$2,458
State:
$2,435
(% of AGI for various income ranges: 119.0% for AGIs below $25k, 91.0% for AGIs $25k-50k, 2.3% for AGIs $50k-75k)
Percentage of individuals using paid preparers for their 2020 taxes: 90.5%
Here:
90%
State:
94%
(% for various income ranges: 83.1% for AGIs below $25k, 95.3% for AGIs $25k-50k, 95.3% for AGIs $50k-75k, 90.9% for AGIs $75k-100k, 93.9% for AGIs $100k-200k, 100.0% for AGIs over 200k)
Averages for the 2012 tax year for zip code 74851, filed in 2013:
Average Adjusted Gross Income (AGI) in 2012: $45,139 (Individual Income Tax Returns)
Here:
$45,139
State:
$58,581
Salary/wage: $41,330 (reported on 84.1% of returns)
Here:
$41,330
State:
$45,973
(% of AGI for various income ranges: 72.9% for AGIs below $25k, 78.3% for AGIs $25k-50k, 78.4% for AGIs $50k-75k, 78.8% for AGIs $75k-100k, 79.5% for AGIs $100k-200k, 62.1% for AGIs over 200k)
Taxable interest for individuals: $659 (reported on 26.5% of returns)
This zip code:
$659
Oklahoma:
$1,625
(% of AGI for various income ranges: 0.8% for AGIs below $25k, 0.3% for AGIs $25k-50k, 0.4% for AGIs $50k-75k, 0.3% for AGIs $75k-100k, 0.4% for AGIs $100k-200k)
Ordinary dividends: $1,438 (reported on 8.1% of returns)
Here:
$1,438
State:
$6,374
(% of AGI for various income ranges: 0.2% for AGIs below $25k, 0.3% for AGIs $25k-50k, 0.3% for AGIs $50k-75k, 0.1% for AGIs $75k-100k, 0.4% for AGIs $100k-200k)
Net capital gain/loss in AGI: +$2,488 (reported on 6.7% of returns)
Here:
+$2,488
State:
+$24,023
(% of AGI for various income ranges: 0.3% for AGIs $25k-50k, 0.2% for AGIs $50k-75k, 0.3% for AGIs $75k-100k, 1.0% for AGIs $100k-200k)
Profit/loss from business: +$8,830 (reported on 15.0% of returns)
Here:
+$8,830
State:
+$11,913
(% of AGI for various income ranges: 9.1% for AGIs below $25k, 2.5% for AGIs $25k-50k, 1.8% for AGIs $50k-75k, 1.2% for AGIs $75k-100k, 3.7% for AGIs $100k-200k)
Taxable individual retirement arrangement distribution: $13,110 (reported on 5.6% of returns)
74851:
$13,110
Oklahoma:
$15,242
(% of AGI for various income ranges: 1.2% for AGIs below $25k, 1.2% for AGIs $25k-50k, 2.0% for AGIs $50k-75k, 1.8% for AGIs $75k-100k, 2.3% for AGIs $100k-200k)
Total itemized deductions: $18,954 (21% of AGI, reported on 19.8% of returns)
Here:
$18,954
State:
$24,882
Here:
21.5% of AGI
State:
18.8% of AGI
(% of AGI for various income ranges: 4.3% for AGIs below $25k, 4.9% for AGIs $25k-50k, 7.5% for AGIs $50k-75k, 9.0% for AGIs $75k-100k, 11.5% for AGIs $100k-200k, 17.1% for AGIs over 200k)
Charity contributions: $3,839 (reported on 14.2% of returns)
Here:
$3,839
State:
$6,591
(% of AGI for various income ranges: 0.5% for AGIs below $25k, 0.8% for AGIs $25k-50k, 1.0% for AGIs $50k-75k, 1.7% for AGIs $75k-100k, 1.7% for AGIs $100k-200k, 1.6% for AGIs over 200k)
Taxes paid: $4,836 (reported on 19.5% of returns)
74851:
$4,836
State:
$7,196
(% of AGI for various income ranges: 0.5% for AGIs below $25k, 0.8% for AGIs $25k-50k, 1.6% for AGIs $50k-75k, 2.2% for AGIs $75k-100k, 3.8% for AGIs $100k-200k, 5.1% for AGIs over 200k)
Earned income credit: $2,488 (reported on 24.0% of returns)
Here:
$2,488
State:
$2,354
(% of AGI for various income ranges: 8.4% for AGIs below $25k, 1.8% for AGIs $25k-50k)
Percentage of individuals using paid preparers for their 2012 taxes: 53.5%
Here:
53%
State:
56%
(% for various income ranges: 49.7% for AGIs below $25k, 53.3% for AGIs $25k-50k, 51.7% for AGIs $50k-75k, 59.5% for AGIs $75k-100k, 65.4% for AGIs $100k-200k, 100.0% for AGIs over 200k)
Averages for the 2004 tax year for zip code 74851, filed in 2005:
Average Adjusted Gross Income (AGI) in 2004: $35,440 (Individual Income Tax Returns)
Here:
$35,440
State:
$41,245
Salary/wage: $34,143 (reported on 85.6% of returns)
Here:
$34,143
State:
$35,318
(% of AGI for various income ranges: 94.8% for AGIs below $10k, 74.2% for AGIs $10k-25k, 82.9% for AGIs $25k-50k, 86.4% for AGIs $50k-75k, 85.9% for AGIs $75k-100k, 75.4% for AGIs over 100k)
Taxable interest for individuals: $779 (reported on 35.3% of returns)
This zip code:
$779
Oklahoma:
$1,745
(% of AGI for various income ranges: 4.0% for AGIs below $10k, 1.4% for AGIs $10k-25k, 0.8% for AGIs $25k-50k, 0.4% for AGIs $50k-75k, 0.5% for AGIs $75k-100k, 0.4% for AGIs over 100k)
Taxable dividends: $668 (reported on 11.2% of returns)
Here:
$668
State:
$2,920
(% of AGI for various income ranges: 1.0% for AGIs below $10k, 0.2% for AGIs $10k-25k, 0.2% for AGIs $25k-50k, 0.1% for AGIs $50k-75k, 0.1% for AGIs $75k-100k, 0.3% for AGIs over 100k)
Net capital gain/loss: +$2,151 (reported on 8.5% of returns)
Here:
+$2,151
State:
+$10,653
(% of AGI for various income ranges: -0.5% for AGIs below $10k, -0.0% for AGIs $10k-25k, 0.4% for AGIs $25k-50k, 0.4% for AGIs $50k-75k, 0.2% for AGIs $75k-100k, 2.3% for AGIs over 100k)
Profit/loss from business: +$6,006 (reported on 16.1% of returns)
Here:
+$6,006
State:
+$8,532
(% of AGI for various income ranges: 8.7% for AGIs below $10k, 6.8% for AGIs $10k-25k, 2.6% for AGIs $25k-50k, 0.3% for AGIs $50k-75k, 2.4% for AGIs $75k-100k, 3.1% for AGIs over 100k)
IRA payment deduction: $3,182 (reported on 1.0% of returns)
74851:
$3,182
Oklahoma:
$3,127
Total itemized deductions: $13,846 (22% of AGI, reported on 26.3% of returns)
Here:
$13,846
State:
$17,093
Here:
22.2% of AGI
State:
20.5% of AGI
(% of AGI for various income ranges: 6.0% for AGIs $10k-25k, 9.0% for AGIs $25k-50k, 11.1% for AGIs $50k-75k, 13.5% for AGIs $75k-100k, 13.4% for AGIs over 100k)
Charity contributions deductions: $2,701 (4% of AGI, reported on 21.7% of returns)
Here:
$2,701
State:
$4,240
Here:
4.2% of AGI
State:
4.8% of AGI
(% of AGI for various income ranges: 0.9% for AGIs $10k-25k, 1.3% for AGIs $25k-50k, 1.6% for AGIs $50k-75k, 2.5% for AGIs $75k-100k, 2.5% for AGIs over 100k)
Total tax: $3,975 (reported on 71.9% of returns)
74851:
$3,975
State:
$6,542
(% of AGI for various income ranges: 2.9% for AGIs below $10k, 3.9% for AGIs $10k-25k, 5.9% for AGIs $25k-50k, 8.2% for AGIs $50k-75k, 10.6% for AGIs $75k-100k, 14.7% for AGIs over 100k)
Earned income credit: $1,858 (reported on 21.3% of returns)
Here:
$1,858
State:
$1,830
Percentage of individuals using paid preparers for their 2004 taxes: 59.4%
Here:
59%
State:
63%
(% for various income ranges: 48.2% for AGIs below $10k, 60.9% for AGIs $10k-25k, 62.7% for AGIs $25k-50k, 60.0% for AGIs $50k-75k, 63.1% for AGIs $75k-100k, 69.7% for AGIs over 100k)
Household received Food Stamps/SNAP in the past 12 months: 632 Household did not receive Food Stamps/SNAP in the past 12 months: 3,141
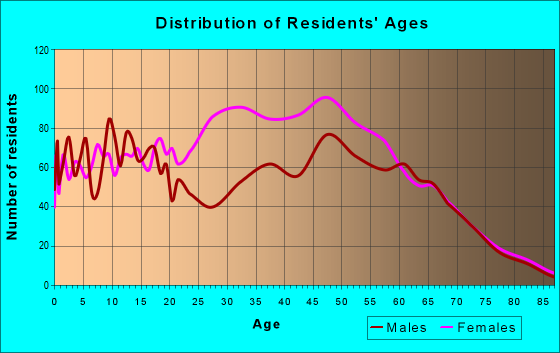
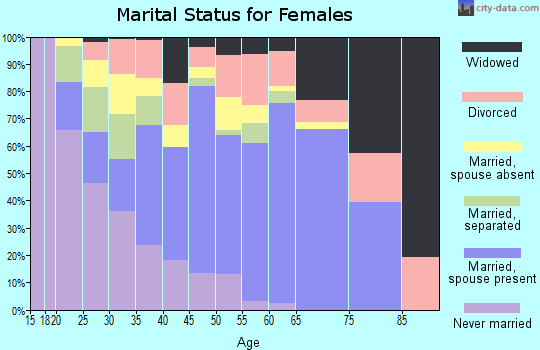
Women who had a birth in the past 12 months: 142 (94 now married, 48 unmarried) Women who did not have a birth in the past 12 months: 3,349 (1,671 now married, 1,677 unmarried)
Housing units in zip code 74851 with a mortgage: 1,612 (163 second mortgage, 116 both second mortgage and home equity loan) Houses without a mortgage: 36
Median monthly owner costs for units with a mortgage: $1,266 Median monthly owner costs for units without a mortgage: $391
Residents with income below the poverty level in 2022:
This zip code:
10.0%
Whole state:
15.7%
Residents with income below 50% of the poverty level in 2022:
This zip code:
4.5%
Whole state:
8.3%
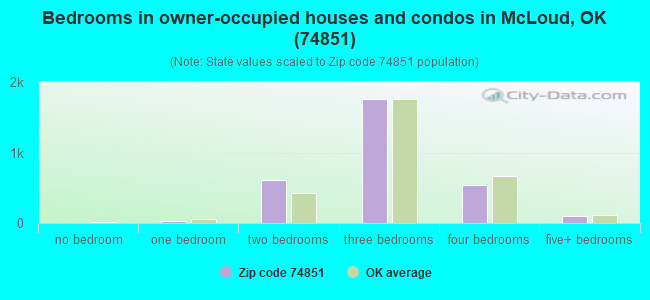
Median number of rooms in houses and condos:
Here:
5.6
State:
6.1
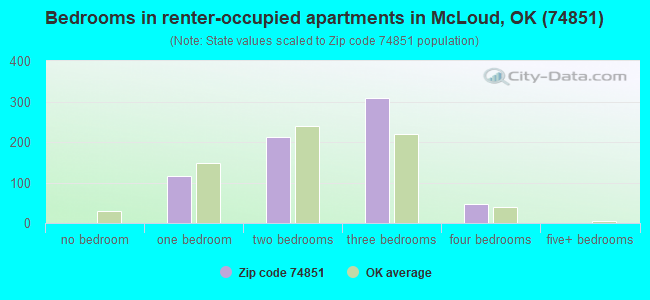
Median number of rooms in apartments:
Here:
4.7
State:
4.5
Notable locations in this zip code not listed on our city pages
Churches in zip code 74851 include: Assembly of God Church (A), Saint Vincent De Paul Church (B), First United Methodist Church (C), Church of Christ (D), Kickapoo Mission (E), Church of Christ Lakeview (F), Minneha Church (G). Display/hide their locations on the map
Cemeteries: Abrams Cemetery (1), Black Cemetery (2), Minneha Cemetery (3), Jent Cemetery (4), Kickapoo Cemetery (5), McLoud Cemetery (6), New Salem Cemetery (7). Display/hide their locations on the map
Lakes and reservoirs: Kishketon Lake (A), Quapaw Creek Site 18 Reservoir (B), Shawnee City Lake Number 2 (C), Oknoname 103005 Reservoir (D), Quapaw Creek Site 29 Reservoir (E). Display/hide their locations on the map
In group quarters: 1,274 (-1 institutionalized population)
Size of family households: 1,200 2-persons, 444 3-persons, 600 4-persons, 323 5-persons, 111 6-persons, 33 7-or-more-persons
Size of nonfamily households: 879 1-person, 152 2-persons, 3 3-persons
1,707 married couples with children.
445 single-parent households (87 men, 358 women).
92.5% of residents of 74851 zip code speak English at home.
4.6% of residents speak Spanish at home (63% very well, 21% well, 16% not well).
0.3% of residents speak other Indo-European language at home (70% very well, 30% well).
1.2% of residents speak Asian or Pacific Island language at home (51% very well, 14% well, 35% not well).
1.3% of residents speak other language at home (83% very well, 13% well, 4% not well).
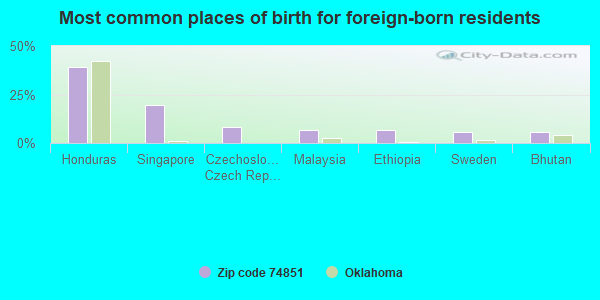
Foreign born population: 287 (2.5%) (61.1% of them are naturalized citizens)
This zip code:
2.5%
Whole state:
6.0%
39%Honduras
20%Singapore
8%Czechoslovakia (includes Czech Republic and Slovakia)
7%Malaysia
7%Ethiopia
6%Sweden
6%Bhutan
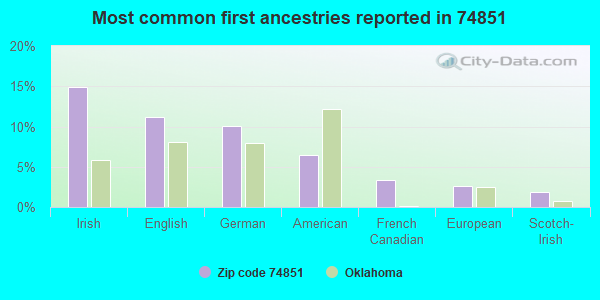
15%Irish
11%English
10%German
6%American
3%French Canadian
3%European
2%Scotch-Irish
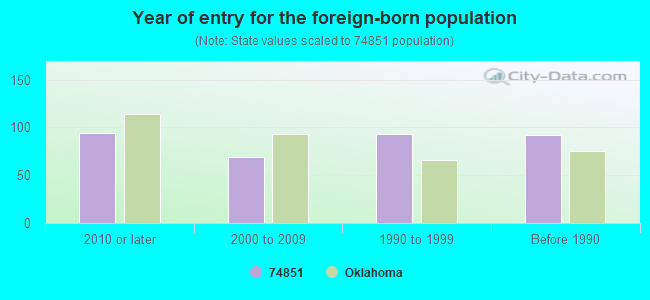
Year of entry for the foreign-born population
942010 or later
692000 to 2009
931990 to 1999
92Before 1990
Facilities with environmental interests located in this zip code:
DALE HS (300 SMITH AVE. in DALE, OK)
(National Center for Education Statistics) - STATE ID-63-I002-705
DALE JHS (300 SMITH AVE in DALE, OK)
(National Center for Education Statistics) - STATE ID-63-I002-610
MCLOUD ES (200 SOUTH MAIN in MCLOUD, OK)
(National Center for Education Statistics) - STATE ID-63-I001-105 Organizations: MC LOUD (SCHOOL DISTRICT)
MCLOUD HS (1100 WEST SEIKEL BLVD in MCLOUD, OK)
(National Center for Education Statistics) - STATE ID-63-I001-705 Organizations: MC LOUD (SCHOOL DISTRICT)
MCLOUD JHS (1100B W. SEIKEL BLVD. in MCLOUD, OK)
(National Center for Education Statistics) - STATE ID-63-I001-610 Organizations: MC LOUD (SCHOOL DISTRICT)
DALE PUBLIC SCHOOL (300SMITH AVE in DALE, OK)
COMPLIANCE ACTIVITY (Tracking inspections of insecticide, fungicide, and rodenticide, and toxic substances) Business SIC classification: ELEMENTARY AND SECONDARY SCHOOLS
MC LOUD PUBLIC SCHOOLS (113 NORTH MAIN STREET in MCLOUD, OK)
COMPLIANCE ACTIVITY (Tracking inspections of insecticide, fungicide, and rodenticide, and toxic substances) Business SIC classification: ELEMENTARY AND SECONDARY SCHOOLS Alternative names: MC LOUD SCHOOLS
Housing units lacking complete plumbing facilities: 1.2% Housing units lacking complete kitchen facilities: 1.7%
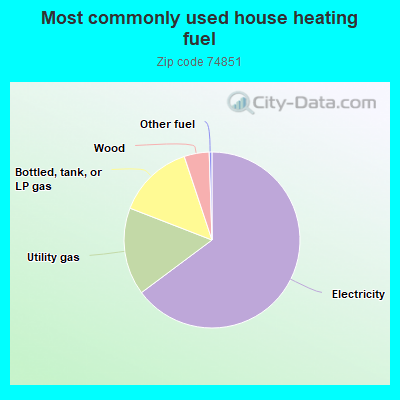
64.8%Electricity
16.1%Utility gas
14.0%Bottled, tank, or LP gas
4.6%Wood
0.5%Other fuel
Population in 1990: 3,334. Population change in the 1990s: +5,428 (+162.8%).
Place of birth for U.S.-born residents:
This state: 7,949
Northeast: 227
Midwest: 831
South: 1,145
West: 967
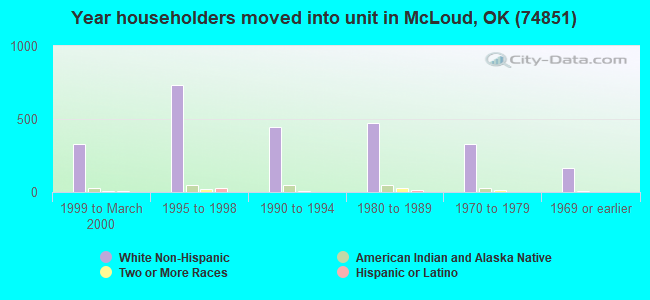
60% of the 74851 zip code residents lived in the same house 5 years ago. Out of people who lived in different houses, 30% lived in this county. Out of people who lived in different counties, 50% lived in Oklahoma.
91% of the 74851 zip code residents lived in the same house 1 year ago. Out of people who lived in different houses, 34% moved from this county. Out of people who lived in different houses, 55% moved from different county within same state. Out of people who lived in different houses, 15% moved from different state.
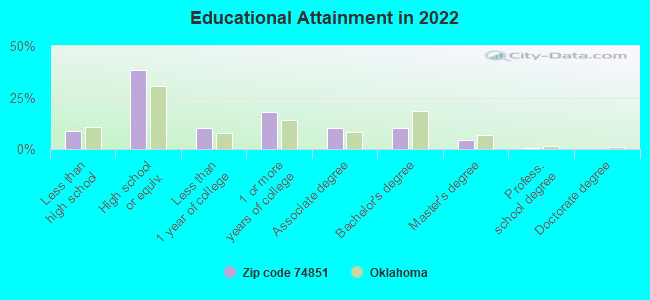
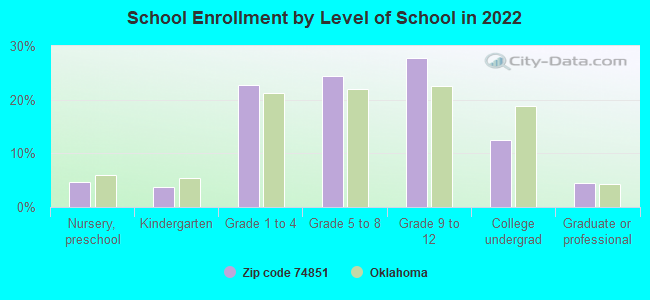
Private vs. public school enrollment:
Students in private schools in grades 1 to 8 (elementary and middle school): 278
Here:
22.4%
Oklahoma:
11.7%
Students in private schools in grades 9 to 12 (high school): 110
Here:
15.2%
Oklahoma:
11.7%
Students in private undergraduate colleges: 122
Here:
36.3%
Oklahoma:
19.3%
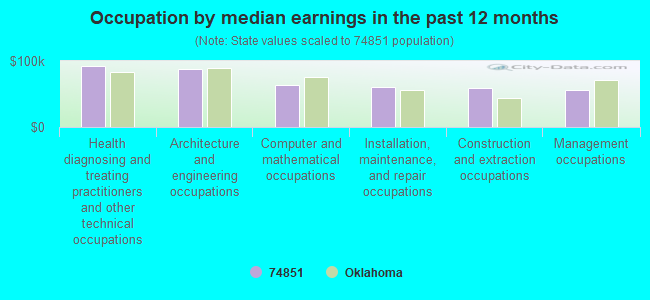
Occupation by median earnings in the past 12 months ($)
92,015Health diagnosing and treating practitioners and other technical occupations
87,843Architecture and engineering occupations
63,675Computer and mathematical occupations
60,160Installation, maintenance, and repair occupations
58,537Construction and extraction occupations
56,389Management occupations
Companies with federal contracts located in this zip code (MCLOUD, OK):
NORMA L LAWSON (29009 REDSKIN RD; small business) : $30,586 in 8 contractsfrom 2004 to 2006
Contracts for Other Administrative Support Services by Army, U.S. Army Corps of Engineers - civil program financing only Signed by year:2000: $0; 2001: $0; 2002: $0; 2003: $0; 2004: $12,396; 2005: $18,190; 2006: $0.
Biggest contracts:
$9,095 with Army for Other Administrative Support Services. Taking place in TX. Signed on 2006-02-06. Completion date: 2005-02-23.
$9,095 with U.S. Army Corps of Engineers - civil program financing only for Other Administrative Support Services. Taking place in TX. Signed on 2005-03-10. Completion date: 2005-02-23.
$9,095 with Army for Other Administrative Support Services. Taking place in TX. Signed on 2005-03-10. Completion date: 2005-02-23.
$6,198 with Army for Other Administrative Support Services. Signed on 2004-03-15. Completion date: 2004-03-01.
HOLLINGSWORT, MONTE (21220 SE 89TH ST; small business) : $18,050 in 3 contractsin 2005
$10,400 with Army for Motor Freight. Taking place in KY. Signed on 2005-11-08. Completion date: 2005-10-24.
$7,650 with Army for Other Cargo and Freight Services. Taking place in KS. Signed on 2005-01-11. Completion date: 2005-01-15.
$0 with Army for Motor Freight. Taking place in KY. Signed on 2005-11-08. Completion date: 2005-10-24.
RUSHING, JOE (29009 REDSKIN ROAD; small business) : $8,964 in 2 contractsin 2004
$4,482 with Army for Other Administrative Support Services. Signed on 2004-03-16. Completion date: 2004-04-15.
$4,482 with U.S. Army Corps of Engineers - civil program financing only for Other Administrative Support Services. Signed on 2004-03-16. Completion date: 2004-04-15.
COMPOSITE TECHNOLOGIES (118 SHADOW RIDGE DR; small business) : $0 in 2 contractsfrom 2003 to 2004
$40,500 with Defense Logistics Agency for Airframe Structural Components. Signed on 2003-12-24. Completion date: 2004-07-26.
-$40,500, same as above.Signed on 2004-09-03. Completion date: 2004-09-03.
Top industries in this zip code by the number of employees in 2005:
Health Care and Social Assistance: Nursing Care Facilities (50-99 employees: 1 establishment)
Accommodation and Food Services: Limited-Service Restaurants (20-49: 2)
Health Care and Social Assistance: Child Day Care Services (20-49: 1, 5-9: 1, 1-4: 2)
Construction: New Single-Family Housing Construction (except Operative Builders) (20-49: 1)
Accommodation and Food Services: Full-Service Restaurants (10-19: 2, 1-4: 1)
Other Services (except Public Administration): Religious Organizations (5-9: 3, 1-4: 5)
Construction: Site Preparation Contractors (10-19: 1, 1-4: 2)
People in group quarters in 2010:
1,039 people in state prisons
43 people in nursing facilities/skilled-nursing facilities
People in group quarters in 2000:
829 people in state prisons
71 people in nursing homes
Fatal accident statistics in 2013:
Fatal accident count: 1
Vehicles involved in fatal accidents: 2
Fatal accidents caused by drunken drivers: 0
Fatalities: 1
Persons involved in fatal accidents: 3
Pedestrians involved in fatal accidents: 0
Fatal accident statistics in 2012:
Fatal accident count: 2
Vehicles involved in fatal accidents: 2
Fatal accidents caused by drunken drivers: 0
Fatalities: 2
Persons involved in fatal accidents: 3
Pedestrians involved in fatal accidents: 0
Home Mortgage Disclosure Act Aggregated Statistics For Year 2009 (Based on 4 partial tracts)
A) FHA, FSA/RHS & VA Home Purchase Loans
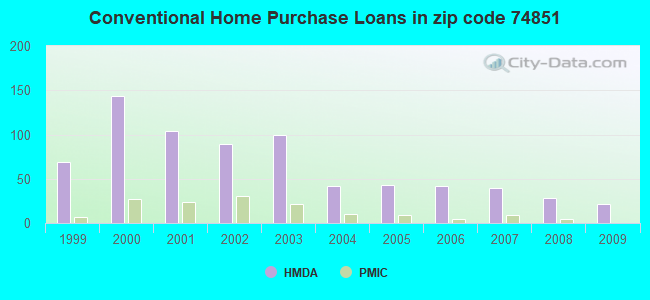
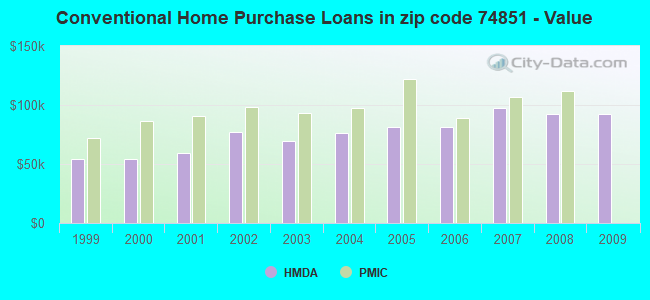
B) Conventional Home Purchase Loans
C) Refinancings
D) Home Improvement Loans
F) Non-occupant Loans on < 5 Family Dwellings (A B C & D)
G) Loans On Manufactured Home Dwelling (A B C & D)
Number
Average Value
Number
Average Value
Number
Average Value
Number
Average Value
Number
Average Value
Number
Average Value
LOANS ORIGINATED
17
$128,872
21
$92,181
62
$111,259
21
$23,526
8
$73,868
22
$52,148
APPLICATIONS APPROVED, NOT ACCEPTED
1
$85,190
3
$113,597
7
$86,156
1
$12,170
0
$0
2
$86,530
APPLICATIONS DENIED
3
$75,923
5
$105,204
26
$129,375
11
$28,912
2
$55,530
9
$59,304
APPLICATIONS WITHDRAWN
2
$128,900
1
$123,400
14
$105,926
3
$43,483
1
$47,900
3
$62,593
FILES CLOSED FOR INCOMPLETENESS
0
$0
1
$41,590
3
$151,277
0
$0
0
$0
2
$63,540
Aggregated Statistics For Year 2008 (Based on 4 partial tracts)
A) FHA, FSA/RHS & VA Home Purchase Loans
B) Conventional Home Purchase Loans
C) Refinancings
D) Home Improvement Loans
F) Non-occupant Loans on < 5 Family Dwellings (A B C & D)
G) Loans On Manufactured Home Dwelling (A B C & D)
Number
Average Value
Number
Average Value
Number
Average Value
Number
Average Value
Number
Average Value
Number
Average Value
LOANS ORIGINATED
15
$111,633
28
$92,111
54
$92,575
27
$27,864
9
$50,698
25
$54,471
APPLICATIONS APPROVED, NOT ACCEPTED
2
$120,840
7
$63,696
9
$102,746
3
$33,143
1
$52,090
7
$62,909
APPLICATIONS DENIED
4
$92,450
12
$73,004
30
$103,409
15
$37,703
2
$37,345
17
$60,614
APPLICATIONS WITHDRAWN
1
$133,750
5
$90,776
14
$98,171
2
$53,015
0
$0
3
$68,017
FILES CLOSED FOR INCOMPLETENESS
0
$0
0
$0
4
$100,705
0
$0
0
$0
1
$57,080
Aggregated Statistics For Year 2007 (Based on 4 partial tracts)
A) FHA, FSA/RHS & VA Home Purchase Loans
B) Conventional Home Purchase Loans
C) Refinancings
D) Home Improvement Loans
F) Non-occupant Loans on < 5 Family Dwellings (A B C & D)
G) Loans On Manufactured Home Dwelling (A B C & D)
Number
Average Value
Number
Average Value
Number
Average Value
Number
Average Value
Number
Average Value
Number
Average Value
LOANS ORIGINATED
10
$110,487
40
$97,840
44
$79,906
30
$24,589
9
$47,354
22
$53,585
APPLICATIONS APPROVED, NOT ACCEPTED
1
$74,000
6
$85,142
8
$95,428
4
$38,130
0
$0
5
$69,006
APPLICATIONS DENIED
2
$67,370
14
$71,489
38
$95,066
18
$33,419
5
$32,272
15
$60,703
APPLICATIONS WITHDRAWN
2
$98,675
4
$68,920
17
$106,847
3
$56,123
1
$12,610
4
$54,145
FILES CLOSED FOR INCOMPLETENESS
0
$0
0
$0
3
$92,610
1
$40,110
0
$0
0
$0
Aggregated Statistics For Year 2006 (Based on 4 partial tracts)
A) FHA, FSA/RHS & VA Home Purchase Loans
B) Conventional Home Purchase Loans
C) Refinancings
D) Home Improvement Loans
F) Non-occupant Loans on < 5 Family Dwellings (A B C & D)
G) Loans On Manufactured Home Dwelling (A B C & D)
Number
Average Value
Number
Average Value
Number
Average Value
Number
Average Value
Number
Average Value
Number
Average Value
LOANS ORIGINATED
16
$109,118
42
$81,544
41
$81,803
31
$26,772
9
$37,564
30
$52,536
APPLICATIONS APPROVED, NOT ACCEPTED
1
$84,150
11
$61,440
11
$93,945
1
$42,970
0
$0
10
$56,247
APPLICATIONS DENIED
3
$73,333
26
$65,997
42
$95,474
25
$38,753
3
$74,353
24
$57,672
APPLICATIONS WITHDRAWN
1
$99,960
3
$80,127
25
$108,215
3
$48,307
1
$64,800
3
$53,410
FILES CLOSED FOR INCOMPLETENESS
0
$0
1
$36,050
5
$135,084
2
$54,630
0
$0
0
$0
Aggregated Statistics For Year 2005 (Based on 4 partial tracts)
A) FHA, FSA/RHS & VA Home Purchase Loans
B) Conventional Home Purchase Loans
C) Refinancings
D) Home Improvement Loans
F) Non-occupant Loans on < 5 Family Dwellings (A B C & D)
G) Loans On Manufactured Home Dwelling (A B C & D)
Number
Average Value
Number
Average Value
Number
Average Value
Number
Average Value
Number
Average Value
Number
Average Value
LOANS ORIGINATED
11
$105,225
43
$81,595
58
$85,597
21
$24,755
7
$62,433
28
$58,482
APPLICATIONS APPROVED, NOT ACCEPTED
2
$56,345
17
$66,178
7
$107,136
0
$0
0
$0
15
$55,333
APPLICATIONS DENIED
2
$96,595
27
$62,070
56
$86,701
19
$30,381
4
$39,960
31
$50,808
APPLICATIONS WITHDRAWN
2
$86,765
10
$69,092
29
$99,019
4
$121,020
1
$68,540
6
$55,780
FILES CLOSED FOR INCOMPLETENESS
0
$0
1
$44,710
3
$68,620
0
$0
0
$0
0
$0
Aggregated Statistics For Year 2004 (Based on 4 partial tracts)
A) FHA, FSA/RHS & VA Home Purchase Loans
B) Conventional Home Purchase Loans
C) Refinancings
D) Home Improvement Loans
F) Non-occupant Loans on < 5 Family Dwellings (A B C & D)
G) Loans On Manufactured Home Dwelling (A B C & D)
Number
Average Value
Number
Average Value
Number
Average Value
Number
Average Value
Number
Average Value
Number
Average Value
LOANS ORIGINATED
18
$92,087
42
$76,139
73
$81,306
21
$27,532
9
$49,503
31
$54,900
APPLICATIONS APPROVED, NOT ACCEPTED
1
$64,750
10
$74,033
11
$81,737
2
$23,525
1
$31,880
7
$59,564
APPLICATIONS DENIED
5
$91,122
26
$57,369
61
$81,218
17
$30,097
2
$30,990
34
$55,461
APPLICATIONS WITHDRAWN
2
$59,065
4
$79,628
32
$83,026
4
$38,252
0
$0
9
$59,913
FILES CLOSED FOR INCOMPLETENESS
0
$0
2
$90,290
4
$80,375
0
$0
0
$0
0
$0
Aggregated Statistics For Year 2003 (Based on 6 partial tracts)
A) FHA, FSA/RHS & VA Home Purchase Loans
B) Conventional Home Purchase Loans
C) Refinancings
D) Home Improvement Loans
F) Non-occupant Loans on < 5 Family Dwellings (A B C & D)
Number
Average Value
Number
Average Value
Number
Average Value
Number
Average Value
Number
Average Value
LOANS ORIGINATED
33
$95,329
100
$69,472
323
$82,085
52
$19,234
19
$47,749
APPLICATIONS APPROVED, NOT ACCEPTED
0
$0
23
$77,940
61
$78,135
3
$39,253
2
$99,250
APPLICATIONS DENIED
6
$69,588
61
$49,919
200
$75,443
24
$21,251
6
$49,020
APPLICATIONS WITHDRAWN
1
$52,050
9
$57,948
70
$84,113
2
$25,895
5
$31,490
FILES CLOSED FOR INCOMPLETENESS
1
$69,270
6
$91,500
17
$84,071
0
$0
0
$0
Aggregated Statistics For Year 2002 (Based on 6 partial tracts)
A) FHA, FSA/RHS & VA Home Purchase Loans
B) Conventional Home Purchase Loans
C) Refinancings
D) Home Improvement Loans
F) Non-occupant Loans on < 5 Family Dwellings (A B C & D)
Number
Average Value
Number
Average Value
Number
Average Value
Number
Average Value
Number
Average Value
LOANS ORIGINATED
36
$73,726
89
$77,005
248
$78,926
68
$14,040
14
$38,262
APPLICATIONS APPROVED, NOT ACCEPTED
1
$52,850
28
$50,041
42
$75,065
4
$22,092
3
$54,900
APPLICATIONS DENIED
7
$83,973
71
$50,521
117
$64,221
38
$14,331
4
$17,102
APPLICATIONS WITHDRAWN
3
$62,847
10
$61,914
68
$76,048
7
$26,359
3
$54,507
FILES CLOSED FOR INCOMPLETENESS
4
$90,492
7
$58,250
23
$88,656
0
$0
0
$0
Aggregated Statistics For Year 2001 (Based on 6 partial tracts)
A) FHA, FSA/RHS & VA Home Purchase Loans
B) Conventional Home Purchase Loans
C) Refinancings
D) Home Improvement Loans
F) Non-occupant Loans on < 5 Family Dwellings (A B C & D)
Number
Average Value
Number
Average Value
Number
Average Value
Number
Average Value
Number
Average Value
LOANS ORIGINATED
37
$86,757
104
$59,277
234
$76,006
70
$11,170
20
$38,451
APPLICATIONS APPROVED, NOT ACCEPTED
1
$29,200
31
$57,008
42
$64,871
3
$23,890
0
$0
APPLICATIONS DENIED
5
$69,632
91
$44,021
117
$56,810
31
$13,491
4
$40,972
APPLICATIONS WITHDRAWN
5
$75,692
9
$56,634
74
$68,040
11
$18,010
1
$38,040
FILES CLOSED FOR INCOMPLETENESS
2
$99,540
5
$81,880
12
$86,518
0
$0
0
$0
Aggregated Statistics For Year 2000 (Based on 6 partial tracts)
A) FHA, FSA/RHS & VA Home Purchase Loans
B) Conventional Home Purchase Loans
C) Refinancings
D) Home Improvement Loans
F) Non-occupant Loans on < 5 Family Dwellings (A B C & D)
Number
Average Value
Number
Average Value
Number
Average Value
Number
Average Value
Number
Average Value
LOANS ORIGINATED
26
$77,027
143
$54,384
122
$63,970
88
$15,762
23
$30,780
APPLICATIONS APPROVED, NOT ACCEPTED
3
$69,130
47
$43,525
22
$58,103
7
$16,016
3
$33,647
APPLICATIONS DENIED
7
$65,506
114
$41,030
90
$55,784
54
$13,886
8
$35,680
APPLICATIONS WITHDRAWN
3
$61,570
20
$66,168
50
$61,134
4
$60,492
0
$0
FILES CLOSED FOR INCOMPLETENESS
1
$108,910
1
$123,600
6
$63,207
1
$14,440
0
$0
Aggregated Statistics For Year 1999 (Based on 3 partial tracts)
A) FHA, FSA/RHS & VA Home Purchase Loans
B) Conventional Home Purchase Loans
C) Refinancings
D) Home Improvement Loans
F) Non-occupant Loans on < 5 Family Dwellings (A B C & D)
2002 - 2018 National Fire Incident Reporting System (NFIRS) incidents
According to the data from the years 2002 - 2018 the average number of fire incidents per year is 43. The highest number of fires - 137 took place in 2008, and the least - 14 in 2004. The data has an increasing trend.
When looking into fire subcategories, the most incidents belonged to: Outside Fires (70.0%), and Structure Fires (20.7%).
Fire incident types reported to NFIRS in Zip Code 74851
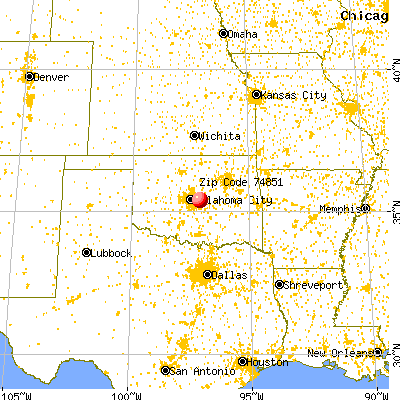


 Nearest zip codes: 73045, 74857, 74801, 74804, 73020, 74855.


 According to the data from the years 2002 - 2018 the average number of fire incidents per year is 43. The highest number of fires - 137 took place in 2008, and the least - 14 in 2004. The data has an increasing trend.
 When looking into fire subcategories, the most incidents belonged to: Outside Fires (70.0%), and Structure Fires (20.7%).