Estimated zip code population in 2022: 22,380 Zip code population in 2010: 11,032 Zip code population in 2000: 2,816
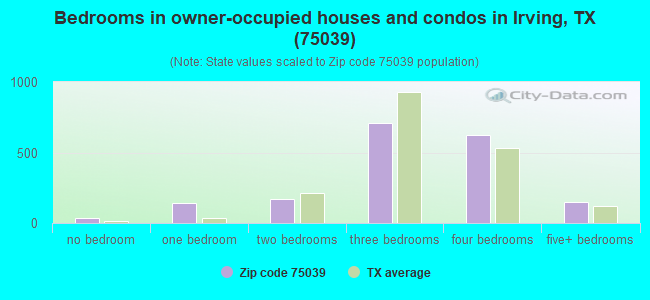
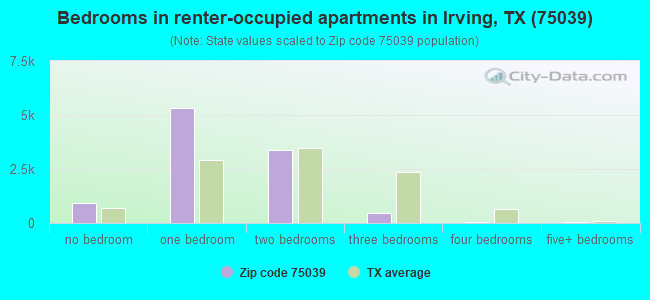
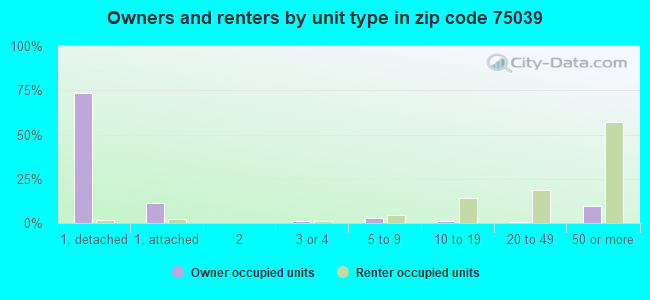
Houses and condos: 13,116 Renter-occupied apartments: 10,106
% of renters here:
85%
State:
38%
March 2022 cost of living index in zip code 75039: 99.3 (near average, U.S. average is 100)
Land area: 5.2 sq. mi. Water area: 0.3 sq. mi.
Population density: 4,265 people per square mile
(average).
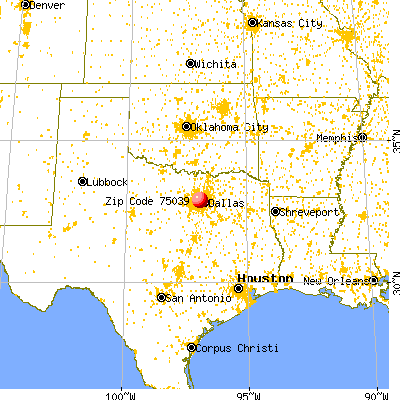
OSM Map
General Map
Google Map
MSN Map
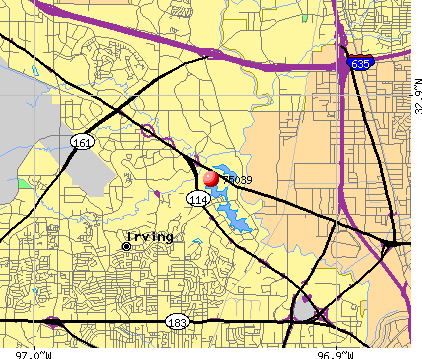
OSM Map
General Map
Google Map
MSN Map
OSM Map
General Map
Google Map
MSN Map
OSM Map
General Map
Google Map
MSN Map
Please wait while loading the map...
Real estate property taxes paid for housing units in 2022:
This zip code:
1.6% ($10,460)
Texas:
1.5% ($4,050)
Median real estate property taxes paid for housing units with mortgages in 2022: $10,505 (1.6%) Median real estate property taxes paid for housing units with no mortgage in 2022: $10,700 (1.6%)
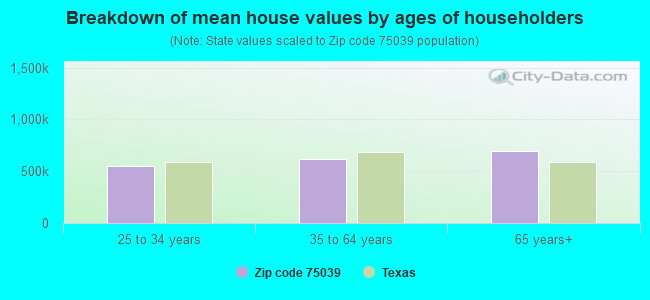
Estimated median house/condo value in 2022: $664,316
75039:
$664,316
Texas:
$275,400
According to our research of Texas and other state lists, there was 1 registered sex offender living in 75039 zip code as of April 18, 2024. The ratio of all residents to sex offenders in zip code 75039 is 16,318 to 1. The ratio of registered sex offenders to all residents in this zip code is much lower than the state average.
Median resident age:
This zip code:
33.1 years
Texas median age:
35.6 years
Average household size:
This zip code:
1.9 people
Texas:
2.6 people
Averages for the 2020 tax year for zip code 75039, filed in 2021:
Average Adjusted Gross Income (AGI) in 2020: $112,040 (Individual Income Tax Returns)
Here:
$112,040
State:
$77,054
Salary/wage: $98,103 (reported on 93.4% of returns)
Here:
$98,103
State:
$62,766
(% of AGI for various income ranges: 1455.6% for AGIs below $25k, 4259.4% for AGIs $25k-50k, 7487.8% for AGIs $50k-75k, 10875.2% for AGIs $75k-100k, 20170.8% for AGIs $100k-200k, 88096.9% for AGIs over 200k)
Taxable interest for individuals: $2,442 (reported on 26.9% of returns)
This zip code:
$2,442
Texas:
$2,665
(% of AGI for various income ranges: 13.7% for AGIs below $25k, 5.9% for AGIs $25k-50k, 20.1% for AGIs $50k-75k, 25.7% for AGIs $75k-100k, 84.0% for AGIs $100k-200k, 1239.8% for AGIs over 200k)
Ordinary dividends: $5,712 (reported on 25.1% of returns)
Here:
$5,712
State:
$10,044
(% of AGI for various income ranges: 12.2% for AGIs below $25k, 16.8% for AGIs $25k-50k, 27.9% for AGIs $50k-75k, 35.1% for AGIs $75k-100k, 153.6% for AGIs $100k-200k, 2986.1% for AGIs over 200k)
Net capital gain/loss in AGI: +$24,123 (reported on 28.4% of returns)
Here:
+$24,123
State:
+$39,590
(% of AGI for various income ranges: 8.8% for AGIs below $25k, 22.6% for AGIs $25k-50k, 59.1% for AGIs $50k-75k, 79.1% for AGIs $75k-100k, 436.9% for AGIs $100k-200k, 16342.2% for AGIs over 200k)
Profit/loss from business: +$7,828 (reported on 17.6% of returns)
Here:
+$7,828
State:
+$10,888
(% of AGI for various income ranges: 44.9% for AGIs below $25k, 18.5% for AGIs $75k-100k, 222.3% for AGIs $100k-200k, 2931.2% for AGIs over 200k)
Taxable individual retirement arrangement distribution: $27,380 (reported on 3.3% of returns)
75039:
$27,380
Texas:
$24,740
(% of AGI for various income ranges: 14.5% for AGIs below $25k, 32.6% for AGIs $25k-50k, 36.1% for AGIs $50k-75k, 40.1% for AGIs $75k-100k, 187.6% for AGIs $100k-200k, 1318.8% for AGIs over 200k)
Self-employed (Keogh) retirement plans: $31,038 (reported on 0.6% of returns)
75039:
$31,038
Texas:
$29,298
(% of AGI for various income ranges: 20.1% for AGIs $50k-75k, 423.1% for AGIs over 200k)
Total itemized deductions: $42,174 (reported on 9.1% of returns)
Here:
$42,174
State:
$40,428
(% of AGI for various income ranges: 35.6% for AGIs below $25k, 101.9% for AGIs $25k-50k, 133.1% for AGIs $50k-75k, 238.8% for AGIs $75k-100k, 595.9% for AGIs $100k-200k, 6418.4% for AGIs over 200k)
Charity contributions: $15,844 (reported on 7.2% of returns)
Here:
$15,844
State:
$18,201
(% of AGI for various income ranges: 19.1% for AGIs $25k-50k, 33.0% for AGIs $50k-75k, 60.9% for AGIs $75k-100k, 152.1% for AGIs $100k-200k, 2144.1% for AGIs over 200k)
Taxes paid: $7,955 (reported on 8.9% of returns)
75039:
$7,955
State:
$7,821
(% of AGI for various income ranges: 8.5% for AGIs below $25k, 17.1% for AGIs $25k-50k, 29.1% for AGIs $50k-75k, 55.9% for AGIs $75k-100k, 165.2% for AGIs $100k-200k, 920.0% for AGIs over 200k)
Earned income credit: $1,579 (reported on 6.8% of returns)
Here:
$1,579
State:
$2,584
(% of AGI for various income ranges: 61.4% for AGIs below $25k, 24.0% for AGIs $25k-50k)
Percentage of individuals using paid preparers for their 2020 taxes: 93.9%
Here:
94%
State:
92%
(% for various income ranges: 93.0% for AGIs below $25k, 94.1% for AGIs $25k-50k, 95.0% for AGIs $50k-75k, 93.9% for AGIs $75k-100k, 93.5% for AGIs $100k-200k, 93.8% for AGIs over 200k)
Averages for the 2012 tax year for zip code 75039, filed in 2013:
Average Adjusted Gross Income (AGI) in 2012: $112,504 (Individual Income Tax Returns)
Here:
$112,504
State:
$65,384
Salary/wage: $90,106 (reported on 94.2% of returns)
Here:
$90,106
State:
$52,524
(% of AGI for various income ranges: 96.0% for AGIs below $25k, 96.2% for AGIs $25k-50k, 95.8% for AGIs $50k-75k, 94.9% for AGIs $75k-100k, 90.8% for AGIs $100k-200k, 55.2% for AGIs over 200k)
Taxable interest for individuals: $1,814 (reported on 30.2% of returns)
This zip code:
$1,814
Texas:
$2,372
(% of AGI for various income ranges: 0.7% for AGIs below $25k, 0.3% for AGIs $25k-50k, 0.3% for AGIs $50k-75k, 0.1% for AGIs $75k-100k, 0.5% for AGIs $100k-200k, 0.6% for AGIs over 200k)
Ordinary dividends: $8,561 (reported on 18.6% of returns)
Here:
$8,561
State:
$9,721
(% of AGI for various income ranges: 1.3% for AGIs below $25k, 0.4% for AGIs $25k-50k, 0.4% for AGIs $50k-75k, 0.2% for AGIs $75k-100k, 0.7% for AGIs $100k-200k, 2.4% for AGIs over 200k)
Net capital gain/loss in AGI: +$49,724 (reported on 17.7% of returns)
Here:
+$49,724
State:
+$35,319
(% of AGI for various income ranges: 0.2% for AGIs $25k-50k, 0.5% for AGIs $100k-200k, 16.3% for AGIs over 200k)
Profit/loss from business: +$19,755 (reported on 15.0% of returns)
Here:
+$19,755
State:
+$13,732
(% of AGI for various income ranges: 6.0% for AGIs below $25k, 1.3% for AGIs $25k-50k, 1.2% for AGIs $50k-75k, 1.7% for AGIs $75k-100k, 2.9% for AGIs $100k-200k, 3.1% for AGIs over 200k)
Taxable individual retirement arrangement distribution: $24,426 (reported on 3.9% of returns)
75039:
$24,426
Texas:
$19,511
(% of AGI for various income ranges: 0.8% for AGIs below $25k, 0.4% for AGIs $25k-50k, 1.0% for AGIs $50k-75k, 0.6% for AGIs $75k-100k, 1.4% for AGIs $100k-200k, 0.7% for AGIs over 200k)
Self-employment retirement plans: $25,262 (reported on 1.0% of returns)
75039:
$25,262
Texas:
$23,938
Total itemized deductions: $28,141 (12% of AGI, reported on 29.4% of returns)
Here:
$28,141
State:
$24,724
Here:
12.0% of AGI
State:
15.9% of AGI
(% of AGI for various income ranges: 8.2% for AGIs below $25k, 5.6% for AGIs $25k-50k, 6.8% for AGIs $50k-75k, 6.7% for AGIs $75k-100k, 9.3% for AGIs $100k-200k, 7.0% for AGIs over 200k)
Charity contributions: $5,419 (reported on 22.1% of returns)
Here:
$5,419
State:
$6,808
(% of AGI for various income ranges: 0.6% for AGIs below $25k, 0.7% for AGIs $25k-50k, 0.9% for AGIs $50k-75k, 1.0% for AGIs $75k-100k, 1.3% for AGIs $100k-200k, 1.1% for AGIs over 200k)
Taxes paid: $9,175 (reported on 28.4% of returns)
75039:
$9,175
State:
$6,921
(% of AGI for various income ranges: 1.2% for AGIs below $25k, 1.1% for AGIs $25k-50k, 1.4% for AGIs $50k-75k, 1.8% for AGIs $75k-100k, 3.1% for AGIs $100k-200k, 2.5% for AGIs over 200k)
Earned income credit: $1,571 (reported on 7.4% of returns)
Here:
$1,571
State:
$2,570
(% of AGI for various income ranges: 3.8% for AGIs below $25k, 0.3% for AGIs $25k-50k)
Percentage of individuals using paid preparers for their 2012 taxes: 43.2%
Here:
43%
State:
51%
(% for various income ranges: 42.6% for AGIs below $25k, 35.6% for AGIs $25k-50k, 39.3% for AGIs $50k-75k, 40.4% for AGIs $75k-100k, 47.6% for AGIs $100k-200k, 67.6% for AGIs over 200k)
Averages for the 2004 tax year for zip code 75039, filed in 2005:
Average Adjusted Gross Income (AGI) in 2004: $97,644 (Individual Income Tax Returns)
Here:
$97,644
State:
$47,881
Salary/wage: $67,679 (reported on 94.0% of returns)
Here:
$67,679
State:
$41,947
(% of AGI for various income ranges: 223.1% for AGIs below $10k, 93.6% for AGIs $10k-25k, 98.2% for AGIs $25k-50k, 96.7% for AGIs $50k-75k, 95.5% for AGIs $75k-100k, 46.9% for AGIs over 100k)
Taxable interest for individuals: $2,092 (reported on 35.3% of returns)
This zip code:
$2,092
Texas:
$2,255
(% of AGI for various income ranges: 5.4% for AGIs below $10k, 0.2% for AGIs $10k-25k, 0.2% for AGIs $25k-50k, 0.4% for AGIs $50k-75k, 0.4% for AGIs $75k-100k, 1.0% for AGIs over 100k)
Taxable dividends: $4,154 (reported on 18.4% of returns)
Here:
$4,154
State:
$4,261
(% of AGI for various income ranges: 2.9% for AGIs below $10k, 0.1% for AGIs $10k-25k, 0.2% for AGIs $25k-50k, 0.5% for AGIs $50k-75k, 0.3% for AGIs $75k-100k, 1.0% for AGIs over 100k)
Net capital gain/loss: +$140,298 (reported on 16.0% of returns)
Here:
+$140,298
State:
+$16,110
(% of AGI for various income ranges: 17.0% for AGIs below $10k, -0.3% for AGIs $10k-25k, -0.3% for AGIs $25k-50k, -0.2% for AGIs $50k-75k, -0.1% for AGIs $75k-100k, 36.2% for AGIs over 100k)
Profit/loss from business: +$16,791 (reported on 14.1% of returns)
Here:
+$16,791
State:
+$11,013
(% of AGI for various income ranges: 10.4% for AGIs below $10k, 4.1% for AGIs $10k-25k, 2.1% for AGIs $25k-50k, 1.4% for AGIs $50k-75k, 0.1% for AGIs $75k-100k, 2.9% for AGIs over 100k)
IRA payment deduction: $2,450 (reported on 1.6% of returns)
75039:
$2,450
Texas:
$3,120
Self-employed pension: $23,071 (reported on 0.6% of returns)
Here:
$23,071
Texas:
$16,401
Total itemized deductions: $31,235 (11% of AGI, reported on 19.2% of returns)
Here:
$31,235
State:
$19,631
Here:
11.2% of AGI
State:
18.9% of AGI
(% of AGI for various income ranges: 15.9% for AGIs below $10k, 5.3% for AGIs $10k-25k, 5.0% for AGIs $25k-50k, 4.4% for AGIs $50k-75k, 4.2% for AGIs $75k-100k, 7.0% for AGIs over 100k)
Charity contributions deductions: $21,358 (7% of AGI, reported on 14.9% of returns)
Here:
$21,358
State:
$4,753
Here:
6.6% of AGI
State:
4.2% of AGI
(% of AGI for various income ranges: 0.9% for AGIs $10k-25k, 0.9% for AGIs $25k-50k, 0.8% for AGIs $50k-75k, 0.7% for AGIs $75k-100k, 4.7% for AGIs over 100k)
Total tax: $25,238 (reported on 89.1% of returns)
75039:
$25,238
State:
$9,058
(% of AGI for various income ranges: 8.8% for AGIs below $10k, 5.4% for AGIs $10k-25k, 9.9% for AGIs $25k-50k, 13.2% for AGIs $50k-75k, 14.7% for AGIs $75k-100k, 29.4% for AGIs over 100k)
Earned income credit: $1,312 (reported on 5.8% of returns)
Here:
$1,312
State:
$2,024
Percentage of individuals using paid preparers for their 2004 taxes: 42.9%
Here:
43%
State:
57%
(% for various income ranges: 42.0% for AGIs below $10k, 48.1% for AGIs $10k-25k, 37.0% for AGIs $25k-50k, 36.9% for AGIs $50k-75k, 44.9% for AGIs $75k-100k, 59.7% for AGIs over 100k)
Likely homosexual households (counted as self-reported same-sex unmarried-partner households)
Lesbian couples: 0.0% of all households
Gay men: 0.3% of all households
Household received Food Stamps/SNAP in the past 12 months: 75 Household did not receive Food Stamps/SNAP in the past 12 months: 11,809
Women who had a birth in the past 12 months: 255 (260 now married, 0 unmarried) Women who did not have a birth in the past 12 months: 6,881 (3,709 now married, 3,150 unmarried)
Housing units in zip code 75039 with a mortgage: 1,314 (73 second mortgage, 56 both second mortgage and home equity loan) Houses without a mortgage: 27
Median monthly owner costs for units with a mortgage: $3,447 Median monthly owner costs for units without a mortgage: $1,537
Residents with income below the poverty level in 2022:
This zip code:
6.5%
Whole state:
14.0%
Residents with income below 50% of the poverty level in 2022:
This zip code:
1.2%
Whole state:
7.4%
Median number of rooms in houses and condos:
Here:
6.9
State:
6.3
Median number of rooms in apartments:
Here:
2.9
State:
4.0
Notable locations in this zip code not listed on our city pages
2,969 married couples with children.
444 single-parent households (324 men, 120 women).
54.3% of residents of 75039 zip code speak English at home.
8.9% of residents speak Spanish at home (63% very well, 17% well, 11% not well, 9% not at all).
13.2% of residents speak other Indo-European language at home (92% very well, 5% well, 2% not well).
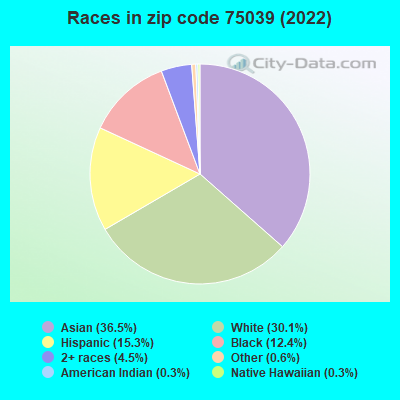
22.4% of residents speak Asian or Pacific Island language at home (88% very well, 9% well, 3% not well).
3.0% of residents speak other language at home (100% very well).
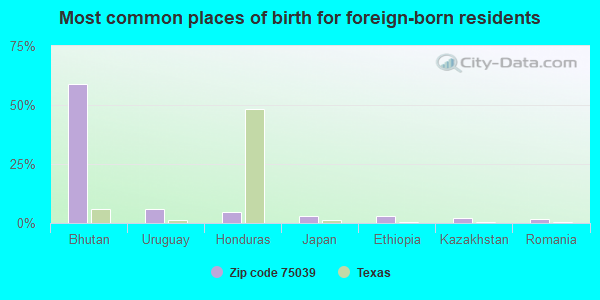
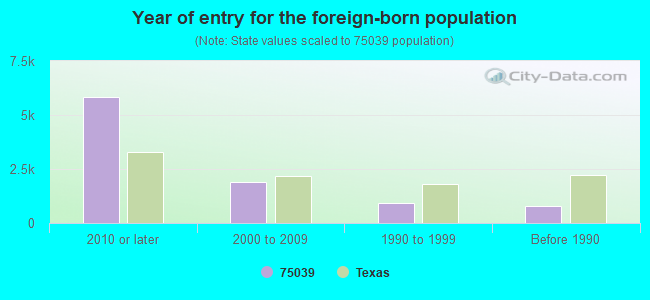
Foreign born population: 8,357 (37.3%) (32.8% of them are naturalized citizens)
Housing units lacking complete plumbing facilities: 0.7% Housing units lacking complete kitchen facilities: 0.9%
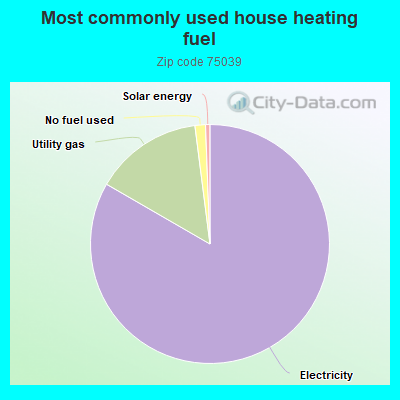
83.1%Electricity
14.6%Utility gas
1.4%No fuel used
0.6%Solar energy
Population in 1990: 598. Population change in the 1990s: +2,218 (+370.9%).
Place of birth for U.S.-born residents:
This state: 7,404
Northeast: 741
Midwest: 1,772
South: 2,267
West: 1,539
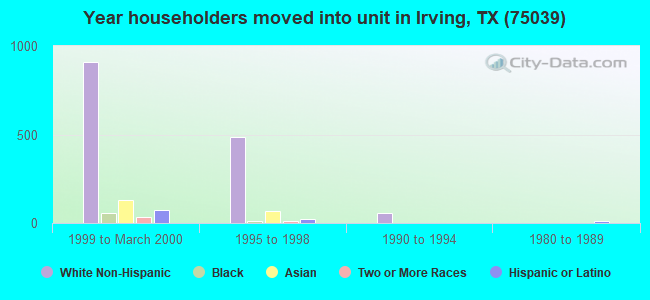
9% of the 75039 zip code residents lived in the same house 5 years ago. Out of people who lived in different houses, 36% lived in this county. Out of people who lived in different counties, 50% lived in Texas.
73% of the 75039 zip code residents lived in the same house 1 year ago. Out of people who lived in different houses, 44% moved from this county. Out of people who lived in different houses, 24% moved from different county within same state. Out of people who lived in different houses, 25% moved from different state. Out of people who lived in different houses, 7% moved from abroad.
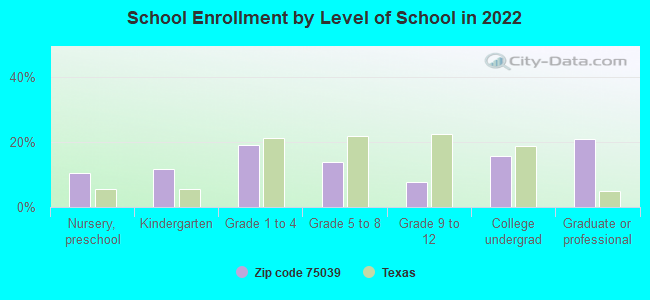
Private vs. public school enrollment:
Students in private schools in grades 1 to 8 (elementary and middle school): 185
Here:
16.8%
Texas:
8.8%
Students in private schools in grades 9 to 12 (high school): 98
Here:
37.1%
Texas:
8.0%
Students in private undergraduate colleges: 66
Here:
12.7%
Texas:
16.2%
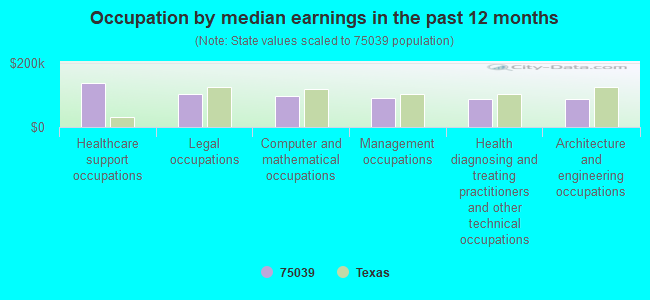
Occupation by median earnings in the past 12 months ($)
138,348Healthcare support occupations
104,440Legal occupations
96,598Computer and mathematical occupations
91,174Management occupations
89,341Health diagnosing and treating practitioners and other technical occupations
87,302Architecture and engineering occupations
Companies with biggest federal contracts located in this zip code (IRVING, TX):
THOMAS GROUP, INC. (5221 N O CONNOR BLVD # 50) : $55,562,334 in 30 contractsfrom 2002 to 2006
Contracts for Other Management Support Services, Non-nuclear Ship Repair (West) Ship repair (including overhauls and conversions) performed on. non-nuclear propelled and nonpropelled ships west of the 108th meridian, Program Management/Support Services, Other Special Studies and Analyses, and moreby Navy, Army Signed by year:2000: $0; 2001: $0; 2002: $8,085,660; 2003: $12,814,982; 2004: $12,666,459; 2005: $14,457,935; 2006: $7,537,298.
Biggest contracts:
$9,178,352 with Navy for Other Management Support Services. Taking place in CA. Signed on 2003-08-21. Completion date: 2003-09-30.
$9,087,070, same as above.Signed on 2004-09-14. Completion date: 2003-09-30.
$5,890,175 with Navy for Non-nuclear Ship Repair (West) Ship repair (including overhauls and conversions) performed on. non-nuclear propelled and nonpropelled ships west of the 108th meridian. Taking place in CA. Signed on 2005-09-12. Completion date: 2003-09-30.
$5,411,891 with Navy for Program Management/Support Services. Signed on 2005-09-20. Completion date: 2005-09-30.
VERIZON SELECT SERVICES INC (6665) : $4,665,048 in 32 contractsfrom 2000 to 2006
Contracts for ADP Telecommunications and Transmission Services, Maintenance, Repair and Rebuilding of Equipment -- Communication, Detection, and Coherent Radiation Equipment, Telephone and/or Communications Services (includes Telegraph, Telex, and Cablevision Services) by Defense Information Systems Agency, Department of Defense, Department of Veterans Affairs, Research and Innovative Technology Administration, and others Signed by year:2000: $29,000; 2001: $0; 2002: $0; 2003: $86,090; 2004: $967,612; 2005: $3,025,305; 2006: $557,041.
Biggest contracts:
$813,678 with Defense Information Systems Agency for ADP Telecommunications and Transmission Services. Signed on 2005-12-31. Completion date: 2008-06-06.
$456,262 with Department of Defense for ADP Telecommunications and Transmission Services. Signed on 2004-10-31. Completion date: 2007-10-08.
$432,368, same as above.Signed on 2005-08-31. Completion date: 2008-06-28.
$428,891, same as above.Signed on 2005-06-30. Completion date: 2008-06-20.
NOKIA INC (6000 CONNECTION DR) : $2,282,803 in 2 contractsfrom 2005 to 2006
$2,222,803 with Army for Defense Electronics and Communication Equipment -- Basic Research (R&D). Signed on 2005-09-12. Completion date: 2010-12-31.
$60,000, same as above.Signed on 2006-01-06. Completion date: 2010-12-31.
WILLETTE ACQUISITION CORP (350 E ROYAL LANE; small business) : $1,277,144 in 15 contractsfrom 2001 to 2005
Contracts for Film/Video Tape Production Services, Maintenance, Repair and Rebuilding of Equipment -- Communication, Detection, and Coherent Radiation Equipment, Medical and Surgical Instruments, Equipment, and Supplies, Miscellaneous Items by Air Force, Army, Department of State, Animal and Plant Health Inspection Service, and others Signed by year:2000: $0; 2001: $264,545; 2002: $555,477; 2003: $359,963; 2004: $291,769; 2005: -$194,610; 2006: $0.
Biggest contracts:
$359,963 with Air Force for Film/Video Tape Production Services. Signed on 2003-10-01. Completion date: 2004-09-30.
$345,877 with Air Force for Maintenance, Repair and Rebuilding of Equipment -- Communication, Detection, and Coherent Radiation Equipment. Signed on 2002-10-01. Completion date: 2003-09-30.
$312,052 with Air Force for Film/Video Tape Production Services. Signed on 2004-10-01. Completion date: 2005-09-30.
$191,945 with Air Force for Maintenance, Repair and Rebuilding of Equipment -- Communication, Detection, and Coherent Radiation Equipment. Signed on 2001-10-01. Completion date: 2002-09-30.
CONFERENCE USA (5201 NORTH O'CONNOR BLVD) : $293,346 in 2 contractsfrom 2003 to 2004
$149,818 with Army for Other Education and Training Services. Taking place in IL. Signed on 2003-07-16. Completion date: 2004-06-30.
$143,528 with Army for Other Education and Training Services. Taking place in NY. Signed on 2004-07-28. Completion date: 2005-06-30.
VALUE INC. (5221 N OCONNOR BLVD 830; small business) 6 employees, $440000 revenue. : $293,119 in 14 contractsfrom 2002 to 2006
Contracts for Engineering and Technical Services, Expert Witness, Real Property Appraisals Services (SIC 6531) by Internal Revenue Service Signed by year:2000: $0; 2001: $0; 2002: $43,300; 2003: $146,400; 2004: $0; 2005: $62,062; 2006: $41,357.
Biggest contracts:
$76,600 with Internal Revenue Service for Engineering and Technical Services. Signed on 2003-09-15. Completion date: 2004-02-15.
$52,367 with Internal Revenue Service for Expert Witness. Signed on 2006-05-03. Completion date: 2006-12-31.
$50,000 with Internal Revenue Service for Real Property Appraisals Services (SIC 6531). Taking place in OK. Signed on 2005-09-08. Completion date: 2006-12-31.
$43,300 with Internal Revenue Service for Expert Witness. Signed on 2002-10-15. Completion date: 2003-09-15.
FLOWSERVE US CORPORATION (222 LAS COLINAS BLVD W; small business) 1000 employees, $0 revenue. : $155,830 in 2 contractsin 2001
$135,830 with Navy for Non-nuclear Ship Repair (West) Ship repair (including overhauls and conversions) performed on. non-nuclear propelled and nonpropelled ships west of the 108th meridian. Signed on 2001-05-02. Completion date: 2001-05-12.
$20,000, same as above.Signed on 2001-11-16. Completion date: 2001-05-12.
RESEARCH IN MOTION CORPORATION (122 WEST JOHN CARPENTER PA) : $144,939 in 13 contractsin 2006
Contracts for ADP Software, Office Information System Equipment, ADP Support Equipment, , and moreby EPA, Forest Service, Army, Federal Trade Commission, and others Signed by year:2000: $0; 2001: $0; 2002: $0; 2003: $0; 2004: $0; 2005: $0; 2006: $144,939.
Biggest contracts:
$70,399 with EPA for ADP Software. Taking place in NC. Signed on 2006-09-13. Completion date: 2007-09-30.
$23,996 with Forest Service for Office Information System Equipment. Signed on 2006-07-17. Completion date: 2006-09-30.
$9,260 with Army for ADP Support Equipment. Taking place in GA. Signed on 2006-04-11. Completion date: 2007-04-30.
$6,413 with Federal Trade Commission for ADP Software. Taking place in DC. Signed on 2006-09-18. Completion date: 2007-09-14.
N E C BUSINESS NETWORK SOLUTIO (6555 N STATE HWY 161 8TH F; small business) : $99,438 in 2 contractsfrom 2003 to 2004
$96,000 with HOUSING AND URBAN DEVELOPMENT, Department of for ADP Facility Operation and Maintenance Services. Taking place in CO. Signed on 2003-09-15. Completion date: 2004-01-15.
$3,438 with Navy for Office Information System Equipment. Signed on 2004-02-09. Completion date: 2004-02-17.
STERLING SOFTWARE INC (5215 OCNNOR BLVD STE 1500)
$75,000 with Offices, Boards and Divisions (includes Attorney General, Deputy Attorney General, etc.) for Maintenance, Repair and Rebuilding of Equipment -- Automatic Data Processing Equipment (Including Firmware), Software, Supplies and Support Equipment. Signed on 2000-10-15. Completion date: 2001-09-15.
Top industries in this zip code by the number of employees in 2005:
Administrative and Support and Waste Management and Remediation Services: Temporary Help Services (100-249: 3, 50-99: 5, 20-49: 4, 10-19: 1, 5-9: 2, 1-4: 3)
Wholesale Trade: Other Electronic Parts and Equipment Merchant Wholesalers (250-499: 1, 100-249: 3, 1-4: 1)
People in group quarters in 2010:
28 people in other noninstitutional facilities
People in group quarters in 2000:
21 people in religious group quarters
Fatal accident statistics in 2014:
Fatal accident count: 1
Vehicles involved in fatal accidents: 1
Fatal accidents caused by drunken drivers: 0
Fatalities: 1
Persons involved in fatal accidents: 1
Pedestrians involved in fatal accidents: 0
Fatal accident statistics in 2013:
Fatal accident count: 2
Vehicles involved in fatal accidents: 2
Fatal accidents caused by drunken drivers: 1
Fatalities: 2
Persons involved in fatal accidents: 2
Pedestrians involved in fatal accidents: 0
Home Mortgage Disclosure Act Aggregated Statistics For Year 2009 (Based on 6 partial tracts)
A) FHA, FSA/RHS & VA Home Purchase Loans
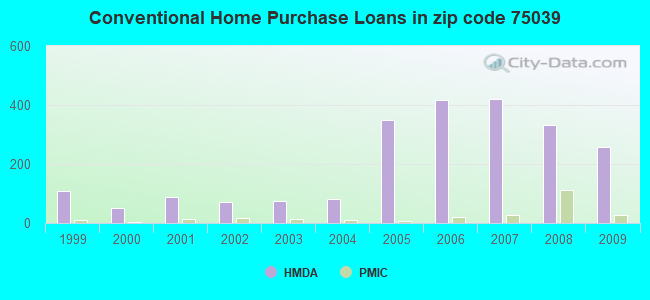
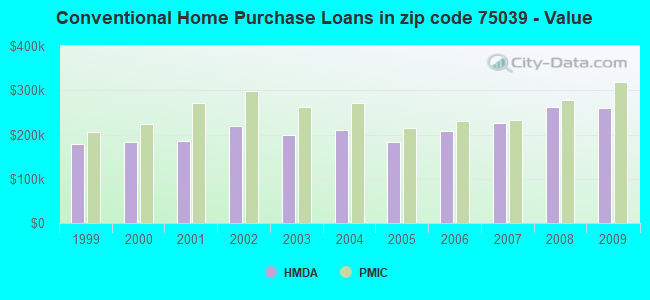
B) Conventional Home Purchase Loans
C) Refinancings
D) Home Improvement Loans
F) Non-occupant Loans on < 5 Family Dwellings (A B C & D)
Number
Average Value
Number
Average Value
Number
Average Value
Number
Average Value
Number
Average Value
LOANS ORIGINATED
32
$245,684
258
$259,100
232
$270,639
2
$40,000
18
$226,313
APPLICATIONS APPROVED, NOT ACCEPTED
2
$173,395
37
$175,557
27
$255,496
2
$32,895
0
$0
APPLICATIONS DENIED
4
$197,558
40
$247,335
74
$262,519
5
$72,252
7
$209,283
APPLICATIONS WITHDRAWN
5
$276,114
58
$250,734
45
$245,873
0
$0
10
$174,337
FILES CLOSED FOR INCOMPLETENESS
3
$191,597
16
$310,245
14
$284,527
0
$0
0
$0
Aggregated Statistics For Year 2008 (Based on 6 partial tracts)
A) FHA, FSA/RHS & VA Home Purchase Loans
B) Conventional Home Purchase Loans
C) Refinancings
D) Home Improvement Loans
E) Loans on Dwellings For 5+ Families
F) Non-occupant Loans on < 5 Family Dwellings (A B C & D)
G) Loans On Manufactured Home Dwelling (A B C & D)
Number
Average Value
Number
Average Value
Number
Average Value
Number
Average Value
Number
Average Value
Number
Average Value
Number
Average Value
LOANS ORIGINATED
19
$242,658
331
$262,908
69
$264,504
7
$47,324
6
$15,236,788
18
$302,204
2
$17,340
APPLICATIONS APPROVED, NOT ACCEPTED
7
$225,534
50
$265,566
16
$290,676
3
$51,847
0
$0
3
$195,707
0
$0
APPLICATIONS DENIED
3
$210,137
45
$181,545
33
$298,973
5
$17,158
0
$0
6
$230,920
3
$61,600
APPLICATIONS WITHDRAWN
3
$195,373
83
$264,044
12
$253,754
1
$125,660
0
$0
6
$237,082
0
$0
FILES CLOSED FOR INCOMPLETENESS
0
$0
16
$266,235
7
$368,070
0
$0
0
$0
2
$204,775
0
$0
Aggregated Statistics For Year 2007 (Based on 6 partial tracts)
A) FHA, FSA/RHS & VA Home Purchase Loans
B) Conventional Home Purchase Loans
C) Refinancings
D) Home Improvement Loans
F) Non-occupant Loans on < 5 Family Dwellings (A B C & D)
G) Loans On Manufactured Home Dwelling (A B C & D)
Number
Average Value
Number
Average Value
Number
Average Value
Number
Average Value
Number
Average Value
Number
Average Value
LOANS ORIGINATED
1
$74,000
420
$226,881
45
$283,901
6
$68,298
36
$207,447
2
$27,250
APPLICATIONS APPROVED, NOT ACCEPTED
0
$0
87
$161,595
11
$253,880
1
$43,000
21
$104,872
0
$0
APPLICATIONS DENIED
3
$165,200
56
$166,695
38
$328,582
11
$30,515
9
$183,662
2
$33,855
APPLICATIONS WITHDRAWN
0
$0
85
$248,647
19
$332,987
0
$0
6
$205,090
0
$0
FILES CLOSED FOR INCOMPLETENESS
0
$0
11
$187,825
10
$313,658
1
$72,000
0
$0
0
$0
Aggregated Statistics For Year 2006 (Based on 6 partial tracts)
A) FHA, FSA/RHS & VA Home Purchase Loans
B) Conventional Home Purchase Loans
C) Refinancings
D) Home Improvement Loans
E) Loans on Dwellings For 5+ Families
F) Non-occupant Loans on < 5 Family Dwellings (A B C & D)
G) Loans On Manufactured Home Dwelling (A B C & D)
Number
Average Value
Number
Average Value
Number
Average Value
Number
Average Value
Number
Average Value
Number
Average Value
Number
Average Value
LOANS ORIGINATED
3
$148,333
417
$208,856
26
$204,297
12
$44,528
1
$29,250,000
48
$163,777
0
$0
APPLICATIONS APPROVED, NOT ACCEPTED
1
$203,000
83
$196,185
1
$200,640
0
$0
0
$0
10
$96,619
3
$60,513
APPLICATIONS DENIED
2
$121,380
64
$176,773
20
$207,232
10
$77,146
0
$0
11
$106,551
0
$0
APPLICATIONS WITHDRAWN
1
$148,000
90
$228,943
18
$199,414
1
$20,590
0
$0
6
$134,833
0
$0
FILES CLOSED FOR INCOMPLETENESS
0
$0
10
$194,066
9
$235,726
0
$0
0
$0
0
$0
0
$0
Aggregated Statistics For Year 2005 (Based on 6 partial tracts)
A) FHA, FSA/RHS & VA Home Purchase Loans
B) Conventional Home Purchase Loans
C) Refinancings
D) Home Improvement Loans
E) Loans on Dwellings For 5+ Families
F) Non-occupant Loans on < 5 Family Dwellings (A B C & D)
G) Loans On Manufactured Home Dwelling (A B C & D)
Number
Average Value
Number
Average Value
Number
Average Value
Number
Average Value
Number
Average Value
Number
Average Value
Number
Average Value
LOANS ORIGINATED
2
$176,785
348
$182,308
45
$244,229
6
$61,843
1
$1,180,000
42
$153,018
2
$379,820
APPLICATIONS APPROVED, NOT ACCEPTED
0
$0
49
$198,625
5
$297,800
3
$41,107
0
$0
3
$115,667
0
$0
APPLICATIONS DENIED
0
$0
58
$198,318
22
$206,637
9
$67,902
0
$0
10
$152,171
1
$33,000
APPLICATIONS WITHDRAWN
0
$0
80
$198,520
21
$216,850
4
$475,500
0
$0
5
$153,600
0
$0
FILES CLOSED FOR INCOMPLETENESS
0
$0
7
$189,786
14
$224,456
1
$37,000
0
$0
0
$0
0
$0
Aggregated Statistics For Year 2004 (Based on 6 partial tracts)
A) FHA, FSA/RHS & VA Home Purchase Loans
B) Conventional Home Purchase Loans
C) Refinancings
D) Home Improvement Loans
E) Loans on Dwellings For 5+ Families
F) Non-occupant Loans on < 5 Family Dwellings (A B C & D)
G) Loans On Manufactured Home Dwelling (A B C & D)
Number
Average Value
Number
Average Value
Number
Average Value
Number
Average Value
Number
Average Value
Number
Average Value
Number
Average Value
LOANS ORIGINATED
2
$88,350
80
$210,237
57
$220,461
3
$217,333
2
$18,165,400
6
$157,890
2
$18,990
APPLICATIONS APPROVED, NOT ACCEPTED
1
$86,000
18
$208,236
7
$210,993
1
$6,000
0
$0
0
$0
0
$0
APPLICATIONS DENIED
2
$70,185
14
$95,744
33
$184,721
6
$69,343
0
$0
1
$40,130
5
$32,368
APPLICATIONS WITHDRAWN
5
$125,836
8
$512,440
16
$221,353
0
$0
0
$0
1
$204,000
0
$0
FILES CLOSED FOR INCOMPLETENESS
2
$73,485
3
$215,583
9
$236,250
1
$40,000
0
$0
0
$0
0
$0
Aggregated Statistics For Year 2003 (Based on 6 partial tracts)
A) FHA, FSA/RHS & VA Home Purchase Loans
B) Conventional Home Purchase Loans
C) Refinancings
D) Home Improvement Loans
E) Loans on Dwellings For 5+ Families
F) Non-occupant Loans on < 5 Family Dwellings (A B C & D)
Number
Average Value
Number
Average Value
Number
Average Value
Number
Average Value
Number
Average Value
Number
Average Value
LOANS ORIGINATED
4
$126,800
73
$199,123
148
$211,181
10
$88,162
1
$28,324,000
5
$189,414
APPLICATIONS APPROVED, NOT ACCEPTED
0
$0
8
$89,535
18
$162,313
1
$47,000
0
$0
1
$40,000
APPLICATIONS DENIED
0
$0
25
$149,213
44
$168,794
2
$91,460
0
$0
2
$260,560
APPLICATIONS WITHDRAWN
0
$0
12
$256,737
30
$218,233
0
$0
0
$0
3
$50,233
FILES CLOSED FOR INCOMPLETENESS
0
$0
4
$157,425
11
$198,988
0
$0
0
$0
1
$22,700
Aggregated Statistics For Year 2002 (Based on 2 partial tracts)
A) FHA, FSA/RHS & VA Home Purchase Loans
B) Conventional Home Purchase Loans
C) Refinancings
D) Home Improvement Loans
F) Non-occupant Loans on < 5 Family Dwellings (A B C & D)
Number
Average Value
Number
Average Value
Number
Average Value
Number
Average Value
Number
Average Value
LOANS ORIGINATED
3
$79,667
71
$218,549
108
$229,352
6
$48,333
4
$202,000
APPLICATIONS APPROVED, NOT ACCEPTED
0
$0
9
$271,333
11
$194,727
2
$70,000
1
$225,000
APPLICATIONS DENIED
0
$0
9
$142,778
17
$190,294
2
$182,500
0
$0
APPLICATIONS WITHDRAWN
0
$0
14
$243,714
11
$299,273
0
$0
0
$0
FILES CLOSED FOR INCOMPLETENESS
0
$0
7
$175,429
6
$250,167
0
$0
0
$0
Aggregated Statistics For Year 2001 (Based on 2 partial tracts)
A) FHA, FSA/RHS & VA Home Purchase Loans
B) Conventional Home Purchase Loans
C) Refinancings
D) Home Improvement Loans
F) Non-occupant Loans on < 5 Family Dwellings (A B C & D)
Number
Average Value
Number
Average Value
Number
Average Value
Number
Average Value
Number
Average Value
LOANS ORIGINATED
3
$78,000
88
$184,920
78
$185,269
6
$35,500
32
$77,656
APPLICATIONS APPROVED, NOT ACCEPTED
0
$0
12
$229,833
6
$237,000
0
$0
1
$300,000
APPLICATIONS DENIED
1
$253,000
7
$237,143
13
$220,538
1
$25,000
0
$0
APPLICATIONS WITHDRAWN
0
$0
7
$235,143
5
$158,200
1
$75,000
0
$0
FILES CLOSED FOR INCOMPLETENESS
0
$0
4
$153,500
0
$0
1
$100,000
0
$0
Aggregated Statistics For Year 2000 (Based on 2 partial tracts)
A) FHA, FSA/RHS & VA Home Purchase Loans
B) Conventional Home Purchase Loans
C) Refinancings
D) Home Improvement Loans
F) Non-occupant Loans on < 5 Family Dwellings (A B C & D)
Number
Average Value
Number
Average Value
Number
Average Value
Number
Average Value
Number
Average Value
LOANS ORIGINATED
8
$72,750
50
$183,840
4
$247,750
11
$25,000
2
$55,500
APPLICATIONS APPROVED, NOT ACCEPTED
0
$0
6
$143,667
3
$422,333
4
$30,000
1
$46,000
APPLICATIONS DENIED
0
$0
14
$178,000
10
$282,700
3
$23,000
1
$3,000
APPLICATIONS WITHDRAWN
0
$0
11
$194,455
2
$308,000
0
$0
0
$0
FILES CLOSED FOR INCOMPLETENESS
0
$0
2
$143,000
0
$0
0
$0
0
$0
Aggregated Statistics For Year 1999 (Based on 3 partial tracts)
A) FHA, FSA/RHS & VA Home Purchase Loans
B) Conventional Home Purchase Loans
C) Refinancings
D) Home Improvement Loans
E) Loans on Dwellings For 5+ Families
F) Non-occupant Loans on < 5 Family Dwellings (A B C & D)
2002 - 2018 National Fire Incident Reporting System (NFIRS) incidents
Based on the data from the years 2002 - 2018 the average number of fire incidents per year is 27. The highest number of fire incidents - 43 took place in 2006, and the least - 12 in 2005. The data has a decreasing trend.
When looking into fire subcategories, the most reports belonged to: Outside Fires (39.7%), and Mobile Property/Vehicle Fires (25.9%).
Fire incident types reported to NFIRS in Zip Code 75039


 Nearest zip codes: 75062, 75038, 75063, 75234, 75061, 75220.


 : $55,562,334 in 30 contracts from 2002 to 2006
 Based on the data from the years 2002 - 2018 the average number of fire incidents per year is 27. The highest number of fire incidents - 43 took place in 2006, and the least - 12 in 2005. The data has a decreasing trend.
 When looking into fire subcategories, the most reports belonged to: Outside Fires (39.7%), and Mobile Property/Vehicle Fires (25.9%).