Estimated zip code population in 2022: 38,944 Zip code population in 2010: 37,881 Zip code population in 2000: 38,888
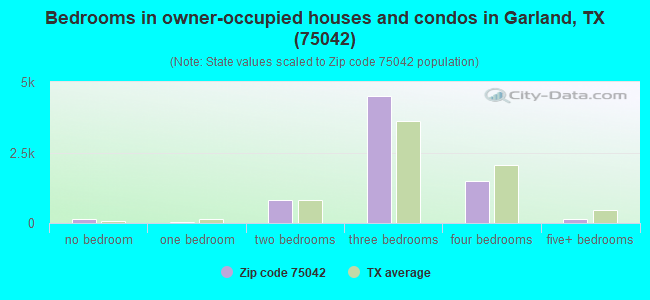
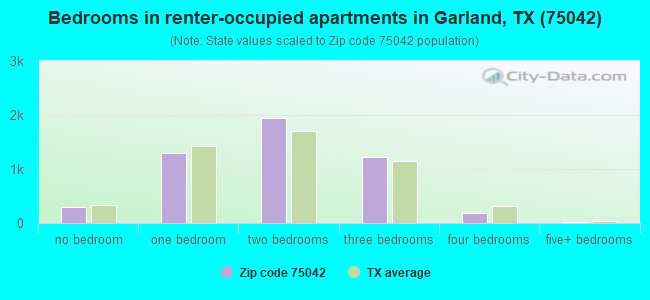
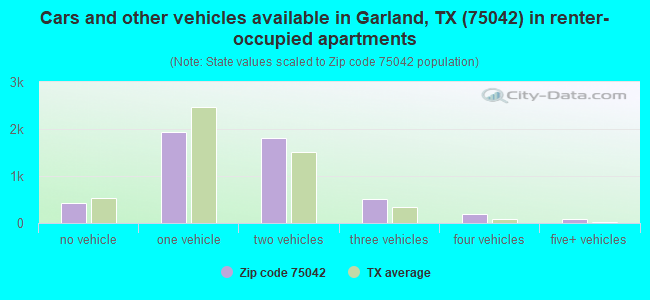
Houses and condos: 12,398 Renter-occupied apartments: 4,995
% of renters here:
41%
State:
38%
March 2022 cost of living index in zip code 75042: 94.6 (less than average, U.S. average is 100)
Land area: 7.5 sq. mi. Water area: 0.0 sq. mi.
Population density: 5,205 people per square mile
(average).
OSM Map
General Map
Google Map
MSN Map
OSM Map
General Map
Google Map
MSN Map
OSM Map
General Map
Google Map
MSN Map
OSM Map
General Map
Google Map
MSN Map
Please wait while loading the map...
Real estate property taxes paid for housing units in 2022:
This zip code:
1.5% ($3,592)
Texas:
1.5% ($4,050)
Median real estate property taxes paid for housing units with mortgages in 2022: $3,632 (1.6%) Median real estate property taxes paid for housing units with no mortgage in 2022: $3,622 (1.6%)
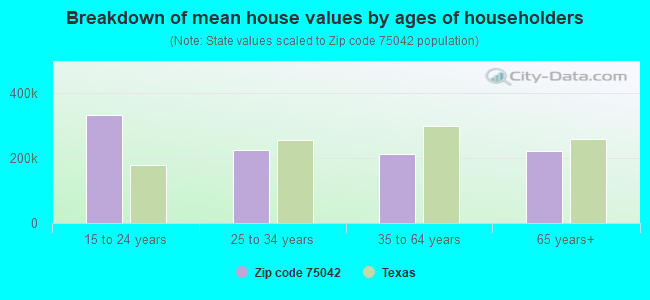
Estimated median house/condo value in 2022: $232,123
75042:
$232,123
Texas:
$275,400
According to our research of Texas and other state lists, there were 78 registered sex offenders living in 75042 zip code as of April 19, 2024. The ratio of all residents to sex offenders in zip code 75042 is 512 to 1. The ratio of registered sex offenders to all residents in this zip code is near the state average.
Median resident age:
This zip code:
33.3 years
Texas median age:
35.6 years
Average household size:
This zip code:
3.2 people
Texas:
2.6 people
Averages for the 2020 tax year for zip code 75042, filed in 2021:
Average Adjusted Gross Income (AGI) in 2020: $37,963 (Individual Income Tax Returns)
Here:
$37,963
State:
$77,054
Salary/wage: $36,302 (reported on 81.5% of returns)
Here:
$36,302
State:
$62,766
(% of AGI for various income ranges: 1274.3% for AGIs below $25k, 3763.8% for AGIs $25k-50k, 6863.7% for AGIs $50k-75k, 10144.9% for AGIs $75k-100k, 17174.6% for AGIs $100k-200k, 51316.7% for AGIs over 200k)
Taxable interest for individuals: $915 (reported on 10.5% of returns)
This zip code:
$915
Texas:
$2,665
(% of AGI for various income ranges: 5.0% for AGIs below $25k, 6.4% for AGIs $25k-50k, 14.1% for AGIs $50k-75k, 31.6% for AGIs $75k-100k, 87.6% for AGIs $100k-200k, 886.7% for AGIs over 200k)
Ordinary dividends: $3,105 (reported on 6.1% of returns)
Here:
$3,105
State:
$10,044
(% of AGI for various income ranges: 5.0% for AGIs below $25k, 8.6% for AGIs $25k-50k, 18.0% for AGIs $50k-75k, 54.0% for AGIs $75k-100k, 166.7% for AGIs $100k-200k, 4110.0% for AGIs over 200k)
Net capital gain/loss in AGI: +$5,808 (reported on 6.8% of returns)
Here:
+$5,808
State:
+$39,590
(% of AGI for various income ranges: 4.0% for AGIs below $25k, 10.5% for AGIs $25k-50k, 32.7% for AGIs $50k-75k, 114.0% for AGIs $75k-100k, 547.8% for AGIs $100k-200k, 7996.7% for AGIs over 200k)
Profit/loss from business: +$10,103 (reported on 26.1% of returns)
Here:
+$10,103
State:
+$10,888
(% of AGI for various income ranges: 343.4% for AGIs below $25k, 321.7% for AGIs $25k-50k, 384.7% for AGIs $50k-75k, 336.0% for AGIs $75k-100k, 926.5% for AGIs $100k-200k)
Taxable individual retirement arrangement distribution: $16,169 (reported on 3.9% of returns)
75042:
$16,169
Texas:
$24,740
(% of AGI for various income ranges: 24.0% for AGIs below $25k, 49.1% for AGIs $25k-50k, 104.4% for AGIs $50k-75k, 272.8% for AGIs $75k-100k, 885.7% for AGIs $100k-200k)
Total itemized deductions: $31,283 (reported on 2.6% of returns)
Here:
$31,283
State:
$40,428
(% of AGI for various income ranges: 15.3% for AGIs below $25k, 67.7% for AGIs $25k-50k, 180.4% for AGIs $50k-75k, 298.7% for AGIs $75k-100k, 625.2% for AGIs $100k-200k, 8990.0% for AGIs over 200k)
Charity contributions: $9,803 (reported on 2.0% of returns)
Here:
$9,803
State:
$18,201
(% of AGI for various income ranges: 1.7% for AGIs below $25k, 13.0% for AGIs $25k-50k, 36.2% for AGIs $50k-75k, 72.8% for AGIs $75k-100k, 180.4% for AGIs $100k-200k, 2613.3% for AGIs over 200k)
Taxes paid: $6,173 (reported on 2.5% of returns)
75042:
$6,173
State:
$7,821
(% of AGI for various income ranges: 2.9% for AGIs below $25k, 14.5% for AGIs $25k-50k, 39.4% for AGIs $50k-75k, 48.8% for AGIs $75k-100k, 137.8% for AGIs $100k-200k, 783.3% for AGIs over 200k)
Earned income credit: $2,569 (reported on 24.8% of returns)
Here:
$2,569
State:
$2,584
(% of AGI for various income ranges: 130.1% for AGIs below $25k, 90.0% for AGIs $25k-50k, 2.5% for AGIs $50k-75k)
Percentage of individuals using paid preparers for their 2020 taxes: 87.6%
Here:
88%
State:
92%
(% for various income ranges: 85.2% for AGIs below $25k, 88.5% for AGIs $25k-50k, 89.6% for AGIs $50k-75k, 91.9% for AGIs $75k-100k, 91.2% for AGIs $100k-200k, 90.0% for AGIs over 200k)
Averages for the 2012 tax year for zip code 75042, filed in 2013:
Average Adjusted Gross Income (AGI) in 2012: $32,744 (Individual Income Tax Returns)
Here:
$32,744
State:
$65,384
Salary/wage: $30,858 (reported on 84.3% of returns)
Here:
$30,858
State:
$52,524
(% of AGI for various income ranges: 76.2% for AGIs below $25k, 88.1% for AGIs $25k-50k, 84.4% for AGIs $50k-75k, 81.3% for AGIs $75k-100k, 74.9% for AGIs $100k-200k, 33.3% for AGIs over 200k)
Taxable interest for individuals: $872 (reported on 13.4% of returns)
This zip code:
$872
Texas:
$2,372
(% of AGI for various income ranges: 0.3% for AGIs below $25k, 0.2% for AGIs $25k-50k, 0.3% for AGIs $50k-75k, 0.4% for AGIs $75k-100k, 0.5% for AGIs $100k-200k, 0.6% for AGIs over 200k)
Ordinary dividends: $4,486 (reported on 6.5% of returns)
Here:
$4,486
State:
$9,721
(% of AGI for various income ranges: 0.3% for AGIs below $25k, 0.3% for AGIs $25k-50k, 0.6% for AGIs $50k-75k, 0.5% for AGIs $75k-100k, 1.1% for AGIs $100k-200k, 7.2% for AGIs over 200k)
Net capital gain/loss in AGI: +$2,262 (reported on 4.8% of returns)
Here:
+$2,262
State:
+$35,319
(% of AGI for various income ranges: 0.2% for AGIs $50k-75k, 0.5% for AGIs $75k-100k, 1.2% for AGIs $100k-200k, 3.1% for AGIs over 200k)
Profit/loss from business: +$9,464 (reported on 22.0% of returns)
Here:
+$9,464
State:
+$13,732
(% of AGI for various income ranges: 17.0% for AGIs below $25k, 4.9% for AGIs $25k-50k, 2.6% for AGIs $50k-75k, 1.7% for AGIs $75k-100k, 3.6% for AGIs $100k-200k)
Taxable individual retirement arrangement distribution: $13,557 (reported on 5.4% of returns)
75042:
$13,557
Texas:
$19,511
(% of AGI for various income ranges: 1.7% for AGIs below $25k, 1.4% for AGIs $25k-50k, 2.3% for AGIs $50k-75k, 2.9% for AGIs $75k-100k, 6.4% for AGIs $100k-200k)
Total itemized deductions: $15,645 (24% of AGI, reported on 11.6% of returns)
Here:
$15,645
State:
$24,724
Here:
24.2% of AGI
State:
15.9% of AGI
(% of AGI for various income ranges: 3.4% for AGIs below $25k, 5.6% for AGIs $25k-50k, 7.1% for AGIs $50k-75k, 6.4% for AGIs $75k-100k, 6.9% for AGIs $100k-200k, 4.1% for AGIs over 200k)
Charity contributions: $3,793 (reported on 8.4% of returns)
Here:
$3,793
State:
$6,808
(% of AGI for various income ranges: 0.3% for AGIs below $25k, 0.8% for AGIs $25k-50k, 1.2% for AGIs $50k-75k, 1.5% for AGIs $75k-100k, 2.1% for AGIs $100k-200k, 0.7% for AGIs over 200k)
Taxes paid: $3,661 (reported on 11.2% of returns)
75042:
$3,661
State:
$6,921
(% of AGI for various income ranges: 0.7% for AGIs below $25k, 1.3% for AGIs $25k-50k, 1.5% for AGIs $50k-75k, 1.5% for AGIs $75k-100k, 1.8% for AGIs $100k-200k, 1.1% for AGIs over 200k)
Earned income credit: $2,605 (reported on 29.4% of returns)
Here:
$2,605
State:
$2,570
(% of AGI for various income ranges: 8.3% for AGIs below $25k, 1.6% for AGIs $25k-50k)
Percentage of individuals using paid preparers for their 2012 taxes: 59.7%
Here:
60%
State:
51%
(% for various income ranges: 61.8% for AGIs below $25k, 60.0% for AGIs $25k-50k, 55.0% for AGIs $50k-75k, 49.3% for AGIs $75k-100k, 46.7% for AGIs $100k-200k, 66.7% for AGIs over 200k)
Averages for the 2004 tax year for zip code 75042, filed in 2005:
Average Adjusted Gross Income (AGI) in 2004: $31,506 (Individual Income Tax Returns)
Here:
$31,506
State:
$47,881
Salary/wage: $30,454 (reported on 85.5% of returns)
Here:
$30,454
State:
$41,947
(% of AGI for various income ranges: 82.9% for AGIs below $10k, 82.2% for AGIs $10k-25k, 89.0% for AGIs $25k-50k, 85.3% for AGIs $50k-75k, 79.8% for AGIs $75k-100k, 65.6% for AGIs over 100k)
Taxable interest for individuals: $1,502 (reported on 26.1% of returns)
This zip code:
$1,502
Texas:
$2,255
(% of AGI for various income ranges: 2.3% for AGIs below $10k, 1.0% for AGIs $10k-25k, 0.6% for AGIs $25k-50k, 0.9% for AGIs $50k-75k, 1.4% for AGIs $75k-100k, 3.3% for AGIs over 100k)
Taxable dividends: $1,654 (reported on 10.8% of returns)
Here:
$1,654
State:
$4,261
(% of AGI for various income ranges: 1.1% for AGIs below $10k, 0.5% for AGIs $10k-25k, 0.3% for AGIs $25k-50k, 0.6% for AGIs $50k-75k, 0.6% for AGIs $75k-100k, 1.2% for AGIs over 100k)
Net capital gain/loss: +$4,431 (reported on 8.3% of returns)
Here:
+$4,431
State:
+$16,110
(% of AGI for various income ranges: -0.8% for AGIs below $10k, 0.0% for AGIs $10k-25k, -0.1% for AGIs $25k-50k, 0.3% for AGIs $50k-75k, 1.2% for AGIs $75k-100k, 7.7% for AGIs over 100k)
Profit/loss from business: +$7,845 (reported on 18.1% of returns)
Here:
+$7,845
State:
+$11,013
(% of AGI for various income ranges: 20.2% for AGIs below $10k, 8.8% for AGIs $10k-25k, 3.1% for AGIs $25k-50k, 2.0% for AGIs $50k-75k, 1.8% for AGIs $75k-100k, 4.9% for AGIs over 100k)
IRA payment deduction: $2,811 (reported on 1.5% of returns)
75042:
$2,811
Texas:
$3,120
(% of AGI for various income ranges: 0.1% for AGIs $10k-25k, 0.1% for AGIs $25k-50k, 0.1% for AGIs $50k-75k, 0.2% for AGIs $75k-100k, 0.1% for AGIs over 100k)
Self-employed pension: $10,900 (reported on 0.1% of returns)
Here:
$10,900
Texas:
$16,401
Total itemized deductions: $13,415 (25% of AGI, reported on 19.2% of returns)
Here:
$13,415
State:
$19,631
Here:
24.6% of AGI
State:
18.9% of AGI
(% of AGI for various income ranges: 6.7% for AGIs below $10k, 5.7% for AGIs $10k-25k, 8.6% for AGIs $25k-50k, 9.6% for AGIs $50k-75k, 9.6% for AGIs $75k-100k, 7.5% for AGIs over 100k)
Charity contributions deductions: $3,065 (5% of AGI, reported on 14.7% of returns)
Here:
$3,065
State:
$4,753
Here:
5.2% of AGI
State:
4.2% of AGI
(% of AGI for various income ranges: 0.5% for AGIs below $10k, 0.6% for AGIs $10k-25k, 1.2% for AGIs $25k-50k, 1.9% for AGIs $50k-75k, 2.2% for AGIs $75k-100k, 2.1% for AGIs over 100k)
Total tax: $4,035 (reported on 64.8% of returns)
75042:
$4,035
State:
$9,058
(% of AGI for various income ranges: 4.4% for AGIs below $10k, 3.6% for AGIs $10k-25k, 5.5% for AGIs $25k-50k, 9.0% for AGIs $50k-75k, 11.7% for AGIs $75k-100k, 18.6% for AGIs over 100k)
Earned income credit: $1,939 (reported on 25.5% of returns)
Here:
$1,939
State:
$2,024
Percentage of individuals using paid preparers for their 2004 taxes: 59.1%
Here:
59%
State:
57%
(% for various income ranges: 55.9% for AGIs below $10k, 66.5% for AGIs $10k-25k, 57.9% for AGIs $25k-50k, 49.5% for AGIs $50k-75k, 49.7% for AGIs $75k-100k, 58.0% for AGIs over 100k)
Likely homosexual households (counted as self-reported same-sex unmarried-partner households)
Lesbian couples: 0.0% of all households
Gay men: 0.3% of all households
Household received Food Stamps/SNAP in the past 12 months: 1,354 Household did not receive Food Stamps/SNAP in the past 12 months: 10,764
Women who had a birth in the past 12 months: 573 (305 now married, 262 unmarried) Women who did not have a birth in the past 12 months: 9,445 (3,876 now married, 5,577 unmarried)
Housing units in zip code 75042 with a mortgage: 3,843 (131 second mortgage, 122 both second mortgage and home equity loan) Houses without a mortgage: 68
Median monthly owner costs for units with a mortgage: $1,524 Median monthly owner costs for units without a mortgage: $711
Residents with income below the poverty level in 2022:
This zip code:
14.6%
Whole state:
14.0%
Residents with income below 50% of the poverty level in 2022:
This zip code:
8.5%
Whole state:
7.4%
Median number of rooms in houses and condos:
Here:
5.7
State:
6.3
Median number of rooms in apartments:
Here:
3.8
State:
4.0
Notable locations in this zip code not listed on our city pages
Churches in zip code 75042 include: Saint Pauls United Methodist Church (A), Garland Bible Chapel Church (B), Shiloh Baptist Church (C), Walnut Village Church of Christ (D), Iglesia Ni Cristo Church (E), Ascension Lutheran Church (F), Saint Barnabas Episcopal Church (G), Walnut Park Assembly of God Church (H), Maple Drive Baptist Church (I). Display/hide their locations on the map
6,179 married couples with children.
3,281 single-parent households (1,197 men, 2,084 women).
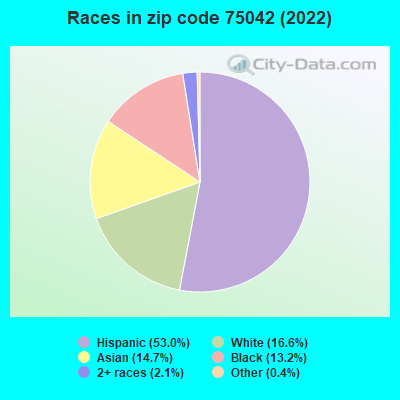
34.2% of residents of 75042 zip code speak English at home.
45.3% of residents speak Spanish at home (51% very well, 27% well, 18% not well, 4% not at all).
3.3% of residents speak other Indo-European language at home (50% very well, 37% well, 11% not well, 2% not at all).
11.1% of residents speak Asian or Pacific Island language at home (42% very well, 32% well, 22% not well, 5% not at all).
5.0% of residents speak other language at home (77% very well, 14% well, 6% not well, 3% not at all).
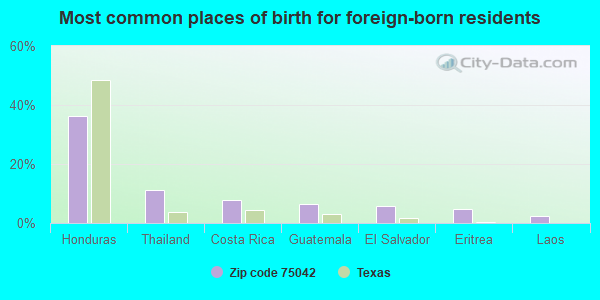
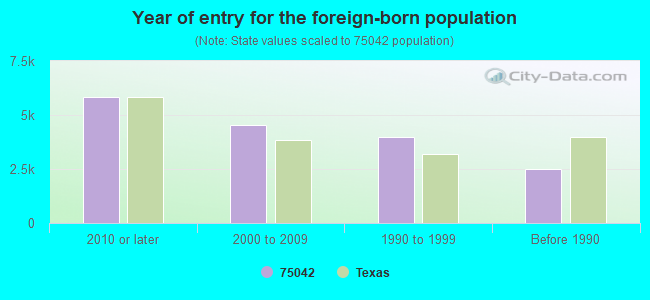
Foreign born population: 16,234 (41.7%) (36.8% of them are naturalized citizens)
Facilities with environmental interests located in this zip code:
AMPCO METAL INCORPORATED AMPCO DALLAS (630 S. JUPITER RD. in GARLAND, TX)
(Integrated Compliance Information System) - ICIS-06-1995-0114, FORMAL ENFORCEMENT ACTION COMPLIANCE ACTIVITY (Tracking inspections of insecticide, fungicide, and rodenticide, and toxic substances) TRI REPORTER (Tracking of toxic chemicals releasing facilities) Business SIC classification: ALUMINUM FOUNDRIES; COPPER FOUNDRIES
ATOMIZED PRODUCTS GROUP INC (3838 MILLER PARK DR. in GARLAND, TX)
CRITERIA AND HAZARDOUS AIR POLLUTANT INVENTORY (Inventory of air pollution sources) (Resource Conservation and Recovery Act (tracking hazardous waste)) TRI REPORTER (Tracking of toxic chemicals releasing facilities) Business SIC classification: PRIMARY METAL PRODUCTS Business NAICS classification: OTHER FABRICATED WIRE PRODUCT MANUFACTURING. Alternative names: ATOMIZED PRODS. GROUP INC., GNB TECHNOLOGIES INCORPORATED
ARMSTRONG CONTAINERS INCORPORATED (3737 MILLER DRIVE in GARLAND, TX)
(Resource Conservation and Recovery Act (tracking hazardous waste)) TRI REPORTER (Tracking of toxic chemicals releasing facilities) Business SIC classification: METAL CANS Business NAICS classification: METAL CAN MANUFACTURING. Organizations: BWAY MANUFACTURING INC (CONTACT/OPERATOR)
Alternative names: BROCKWAY STANDARD
AUTOMATIC PLATING TECHNOLOGY (1917 SILVER ST. in GARLAND, TX)
AIR MINOR (AIRS/AFS) (Resource Conservation and Recovery Act (tracking hazardous waste)) Business SIC and NAICS classification: ELECTROPLATING, PLATING, POLISHING, ANODIZING, AND COLORING Organizations: WILLIAM L RENSHAW (CONTACT/OPERATOR)
, AUTOMATIC PLATING TECHNOLOGY INC (CONTACT/OWNER)
ACCURATE AUTOMATIC MANUFACTURING CORP (707 SHEPHERD DR STE 101 in GARLAND, TX)
(Resource Conservation and Recovery Act (tracking hazardous waste)) Business NAICS classification: PRECISION TURNED PRODUCT MANUFACTURING.
ASHLAND CHEMICAL FRP SUPPLY (3322 RIBELIN WAY in GARLAND, TX)
(Resource Conservation and Recovery Act (tracking hazardous waste)) Alternative names: ASHLAND CHEMICAL INC FRP SUPPLY
AUTOMATIC PRODUCTS CORP (209 N INTERNATIONAL RD in GARLAND, TX)
(Resource Conservation and Recovery Act (tracking hazardous waste)) Business NAICS classification: PRECISION TURNED PRODUCT MANUFACTURING.
Housing units lacking complete plumbing facilities: 0.7% Housing units lacking complete kitchen facilities: 0.4%
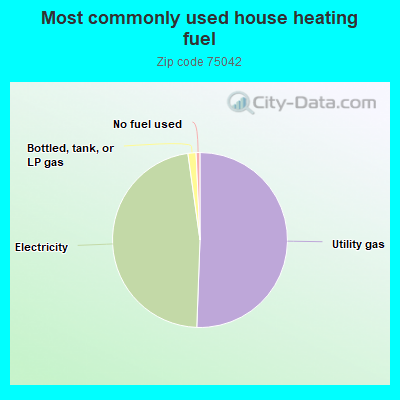
50.6%Utility gas
47.2%Electricity
1.5%Bottled, tank, or LP gas
0.7%No fuel used
Population in 1990: 31,807. Population change in the 1990s: +7,081 (+22.3%).
Place of birth for U.S.-born residents:
This state: 18,063
Northeast: 401
Midwest: 1,183
South: 1,530
West: 1,004
49% of the 75042 zip code residents lived in the same house 5 years ago. Out of people who lived in different houses, 71% lived in this county. Out of people who lived in different counties, 50% lived in Texas.
90% of the 75042 zip code residents lived in the same house 1 year ago. Out of people who lived in different houses, 67% moved from this county. Out of people who lived in different houses, 13% moved from different county within same state. Out of people who lived in different houses, 10% moved from different state. Out of people who lived in different houses, 9% moved from abroad.
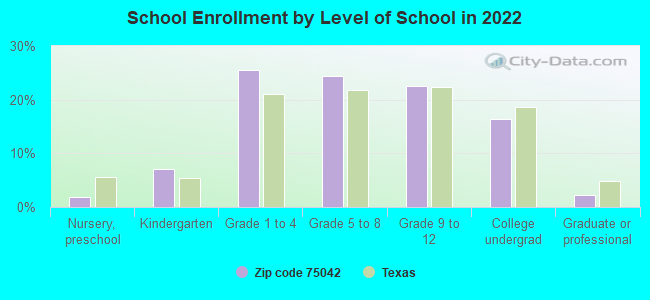
Private vs. public school enrollment:
Students in private schools in grades 1 to 8 (elementary and middle school): 104
Here:
1.9%
Texas:
8.8%
Students in private schools in grades 9 to 12 (high school): 60
Here:
2.4%
Texas:
8.0%
Students in private undergraduate colleges: 65
Here:
3.6%
Texas:
16.2%
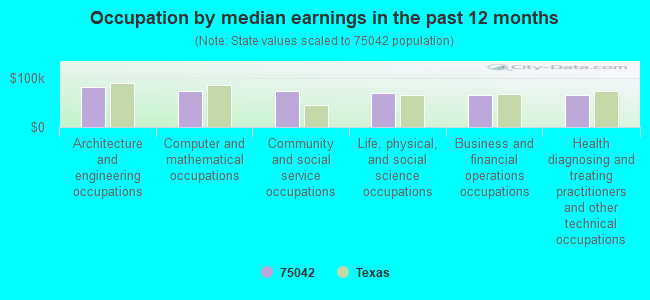
Occupation by median earnings in the past 12 months ($)
80,709Architecture and engineering occupations
74,483Computer and mathematical occupations
72,915Community and social service occupations
69,811Life, physical, and social science occupations
64,549Business and financial operations occupations
64,497Health diagnosing and treating practitioners and other technical occupations
Companies with biggest federal contracts located in this zip code (GARLAND, TX):
RAYTHEON E-SYSTEMS INC (1200 S JUPITER RD) : $403,578,517 in 341 contractsfrom 1999 to 2006
Contracts for Systems Engineering Services, Other Professional Services, Other ADP and Telecommunications Services (includes data storage on tapes, compact disks, etc.), Defense Electronics and Communication Equipment -- Advanced Development (R&D), and moreby National Geospatial-Intelligence Agency, Air Force, Army, Department of Defense, and others Signed by year:2000: $52,721,531; 2001: $32,399,148; 2002: $49,604,314; 2003: $52,367,150; 2004: $64,677,557; 2005: $98,531,715; 2006: $46,863,290.
Biggest contracts:
$24,661,156 with National Geospatial-Intelligence Agency for Systems Engineering Services. Signed on 2006-04-21. Completion date: 2008-12-31.
$20,054,469 with Air Force for Other Professional Services. Signed on 2003-12-19. Completion date: 2004-12-03.
$17,001,610 with Army for Other ADP and Telecommunications Services (includes data storage on tapes, compact disks, etc.). Taking place in MD. Signed on 2000-05-22. Completion date: 2003-05-07.
$16,613,318 with Air Force for Other Professional Services. Signed on 2003-10-03. Completion date: 2004-12-03.
RAYTHEON E-SYSTEMS, INC (1200 S JUPITER RD) : $61,564,693 in 28 contractsfrom 1999 to 2001
Contracts for Engineering and Technical Services, Fire Control Systems, Complete, Other Professional Services, Defense Electronics and Communication Equipment -- Operational Systems Development (R&D), and moreby Navy, Department of Defense, Air Force, Federal Energy Regulatory Commission (disused code), and others Signed by year:2000: $48,763,134; 2001: $1,115,849; 2002: $0; 2003: $0; 2004: $0; 2005: $0; 2006: $0.
Biggest contracts:
$20,467,959 with Navy for Engineering and Technical Services. Taking place in FL. Signed on 2000-04-03. Completion date: 2002-09-30.
$10,233,980, same as above.Signed on 1999-11-10. Completion date: 2002-09-30.
$9,648,008 with Navy for Fire Control Systems, Complete. Taking place in FL. Signed on 2000-06-13. Completion date: 2000-08-30.
$6,316,404 with Navy for Engineering and Technical Services. Taking place in FL. Signed on 2000-02-29. Completion date: 2002-09-30.
LITTON SYSTEMS INC (2203 W WALNUT ST) : $2,820,611 in 6 contractsfrom 2001 to 2002
Contracts for Night Vision Equipment, Emitted and Reflected Radiation, Optical Sighting and Ranging Equipment, Stimulated Coherent Radiation Devices, Components and Accessories, Miscellaneous Construction Equipment by Navy Signed by year:2000: $0; 2001: $161,690; 2002: $2,658,921; 2003: $0; 2004: $0; 2005: $0; 2006: $0.
Biggest contracts:
$1,105,902 with Navy for Night Vision Equipment, Emitted and Reflected Radiation. Signed on 2002-02-20. Completion date: 2002-10-03.
$808,906, same as above.Signed on 2002-02-20. Completion date: 2002-10-03.
$662,938, same as above.Signed on 2002-07-23. Completion date: 2003-03-31.
$99,950 with Navy for Optical Sighting and Ranging Equipment. Signed on 2001-09-19. Completion date: 2002-02-15.
TUCKER ELECTRONICS COMPANY (1717 RESERVE ST; small business) : $2,634,409 in 109 contractsfrom 2000 to 2006
Contracts for Electrical and Electronic Properties Measuring and Testing Instruments, Radio and Television Communication Equipment, Except Airborne, Aircraft Launching Equipment, Optical Instruments, Test Equipment, Components and Accessories, and moreby Navy, Army, Air Force, Federal Technology Service, and others Signed by year:2000: $360,000; 2001: $442,059; 2002: $569,457; 2003: $255,112; 2004: $452,455; 2005: $375,453; 2006: $179,873.
Biggest contracts:
$360,000 with Navy for Electrical and Electronic Properties Measuring and Testing Instruments. Signed on 2000-08-25. Completion date: 2000-09-25.
$186,684 with Navy for Radio and Television Communication Equipment, Except Airborne. Signed on 2002-09-30. Completion date: 2002-10-14.
$186,684, same as above.Signed on 2002-10-01. Completion date: 2002-10-14.
$173,745 with Navy for Aircraft Launching Equipment. Signed on 2001-09-24. Completion date: 2002-01-24.
U.S. FOODSERVICE (950 SHILOH) : $2,382,000 in 14 contractsfrom 1999 to 2001
Contracts for Meat, Poultry, and Fish by Department of Veterans Affairs Signed by year:2000: $1,172,000; 2001: $978,000; 2002: $0; 2003: $0; 2004: $0; 2005: $0; 2006: $0.
Biggest contracts:
$268,000 with Department of Veterans Affairs for Meat, Poultry, and Fish. Signed on 2001-12-15. Completion date: 2001-12-15.
$254,000, same as above.Signed on 2001-07-15. Completion date: 2001-12-15.
$249,000, same as above.Signed on 2001-04-15. Completion date: 2001-12-15.
$242,000, same as above.Signed on 2000-10-15. Completion date: 2000-12-15.
THE TRANSIT POINT,LLC (3612 DIVIDEND DRIVE; small business) : $1,417,889 in 62 contractsfrom 2002 to 2005
Contracts for ADP Supplies, Fiber Optic Switches, Electrical and Electronic Properties Measuring and Testing Instruments, ADP Support Equipment, and moreby Farm Service Agency, Navy, Defense Logistics Agency, Army, and others Signed by year:2000: $0; 2001: $0; 2002: $774,836; 2003: $634,109; 2004: $23,684; 2005: -$14,740; 2006: $0.
Biggest contracts:
$299,863 with Farm Service Agency for ADP Supplies. Taking place in MO. Signed on 2002-12-15. Completion date: 2003-01-15.
$104,831 with Navy for Fiber Optic Switches. Signed on 2003-09-24. Completion date: 2003-10-08.
$85,476 with Defense Logistics Agency for Electrical and Electronic Properties Measuring and Testing Instruments. Signed on 2002-02-14. Completion date: 2002-03-22.
$83,932 with Army for ADP Support Equipment. Signed on 2004-09-23. Completion date: 2004-09-27.
RACKMOUNT SOLUTIONS, LTD (4109 GLENHAVEN, #202; small business) : $540,268 in 25 contractsfrom 2003 to 2006
Contracts for ADP Components, Mini and Micro Computer Control Devices, ADP Supplies, Office Devices and Accessories, and moreby Air Force, Army, Bureau of Reclamation, U.S. Coast Guard, and others Signed by year:2000: $0; 2001: $0; 2002: $0; 2003: $9,236; 2004: $45,676; 2005: $295,131; 2006: $190,225.
Biggest contracts:
$152,608 with Air Force for ADP Components. Signed on 2005-09-23. Completion date: 2005-09-30.
$124,539 with Air Force for Mini and Micro Computer Control Devices. Signed on 2006-01-04. Completion date: 2006-01-31.
$111,873 with Air Force for ADP Supplies. Signed on 2005-06-30. Completion date: 2005-07-30.
$27,008 with Army for Office Devices and Accessories. Taking place in MO. Signed on 2004-09-24. Completion date: 2004-11-01.
PRIOR REMANUFACTURING INC (315 INTERNATIONAL RD; small business)
$476,408 with Defense Logistics Agency for Maintenance, Repair and Rebuilding of Equipment -- Miscellaneous. Signed on 2001-02-06. Completion date: 2001-09-24.
SYSTEMS & COMPONENTS, INC (1131 S JUPITER RD; small business) : $472,480 in 34 contractsfrom 2004 to 2005
Contracts for Electrical and Electronic Properties Measuring and Testing Instruments, Miscellaneous Office Machines, Indoor and Outdoor Electric Lighting Fixtures, Cable, Cord, and Wire Assemblies: Communications Equipment, and moreby Navy, Air Force, Defense Logistics Agency Signed by year:2000: $0; 2001: $0; 2002: $0; 2003: $0; 2004: $169,085; 2005: $303,395; 2006: $0.
Biggest contracts:
$217,462 with Navy for Electrical and Electronic Properties Measuring and Testing Instruments. Signed on 2005-03-03. Completion date: 2005-07-01.
$37,693 with Air Force for Miscellaneous Office Machines. Signed on 2004-09-28. Completion date: 2004-10-28.
$20,475 with Defense Logistics Agency for Indoor and Outdoor Electric Lighting Fixtures. Taking place in VA. Signed on 2005-01-26. Completion date: 2005-03-13.
$18,986 with Defense Logistics Agency for Cable, Cord, and Wire Assemblies: Communications Equipment. Taking place in NC. Signed on 2004-11-18. Completion date: 2004-12-05.
CMI RUBBER COMPANY INC (202 S INTERNATIONAL RD; small business) : $310,948 in 11 contractsfrom 2002 to 2006
Contracts for Optical Instruments, Test Equipment, Components and Accessories, Night Vision Equipment, Emitted and Reflected Radiation, Airframe Structural Components by Defense Logistics Agency Signed by year:2000: $0; 2001: $0; 2002: $36,182; 2003: $0; 2004: $0; 2005: $210,480; 2006: $64,286.
Biggest contracts:
$123,990 with Defense Logistics Agency for Optical Instruments, Test Equipment, Components and Accessories. Signed on 2005-03-23. Completion date: 2005-05-23.
$60,986, same as above.Signed on 2006-04-28. Completion date: 2006-06-28.
$46,760, same as above.Signed on 2005-11-01. Completion date: 2006-01-01.
$36,182 with Defense Logistics Agency for Night Vision Equipment, Emitted and Reflected Radiation. Signed on 2002-04-02. Completion date: 2002-06-01.
Top industries in this zip code by the number of employees in 2005:
Health Care and Social Assistance: General Medical and Surgical Hospitals (over 1000 employees: 1 establishment, 50-99 employees: 1 establishment)
Health Care and Social Assistance: Home Health Care Services (500-999: 1, 50-99: 1, 20-49: 1, 10-19: 1, 5-9: 2, 1-4: 1)
Administrative and Support and Waste Management and Remediation Services: Janitorial Services (500-999: 1, 20-49: 1, 10-19: 2, 5-9: 2, 1-4: 2)
2002 - 2018 National Fire Incident Reporting System (NFIRS) incidents
According to the data from the years 2002 - 2018 the average number of fire incidents per year is 98. The highest number of fire incidents - 142 took place in 2002, and the least - 41 in 2009. The data has a decreasing trend.
When looking into fire subcategories, the most incidents belonged to: Structure Fires (44.7%), and Outside Fires (34.2%).
Fire incident types reported to NFIRS in Zip Code 75042


 Nearest zip codes: 75041, 75238, 75081, 75040, 75044, 75243.


 According to the data from the years 2002 - 2018 the average number of fire incidents per year is 98. The highest number of fire incidents - 142 took place in 2002, and the least - 41 in 2009. The data has a decreasing trend.
 When looking into fire subcategories, the most incidents belonged to: Structure Fires (44.7%), and Outside Fires (34.2%).