Estimated zip code population in 2022: 6,308 Zip code population in 2010: 5,842 Zip code population in 2000: 5,849
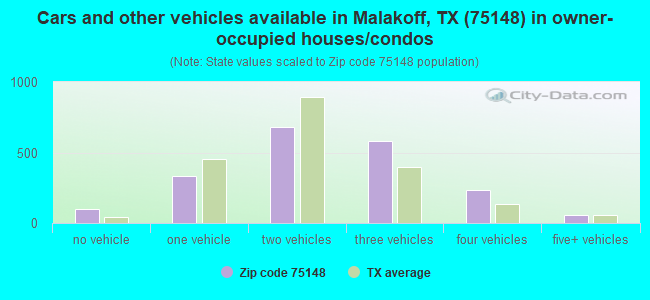
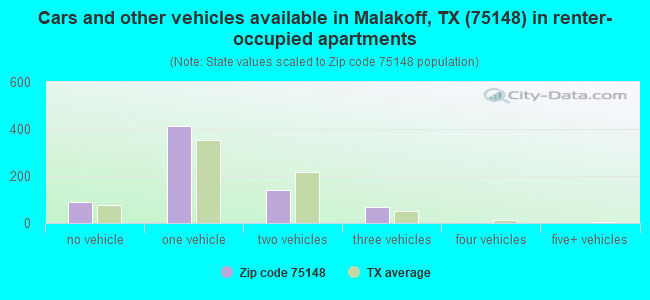
Houses and condos: 3,702 Renter-occupied apartments: 709
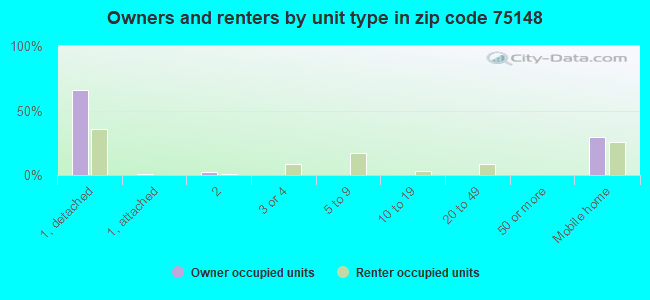
% of renters here:
26%
State:
38%
March 2022 cost of living index in zip code 75148: 88.1 (less than average, U.S. average is 100)
Land area: 87.5 sq. mi. Water area: 6.1 sq. mi.
Population density: 72 people per square mile
(very low).
OSM Map
General Map
Google Map
MSN Map
OSM Map
General Map
Google Map
MSN Map
OSM Map
General Map
Google Map
MSN Map
OSM Map
General Map
Google Map
MSN Map
Please wait while loading the map...
Real estate property taxes paid for housing units in 2022:
This zip code:
1.0% ($1,847)
Texas:
1.5% ($4,050)
Median real estate property taxes paid for housing units with mortgages in 2022: $3,036 (1.1%) Median real estate property taxes paid for housing units with no mortgage in 2022: $1,191 (1.3%)
Business Search- 14 Million verified businesses
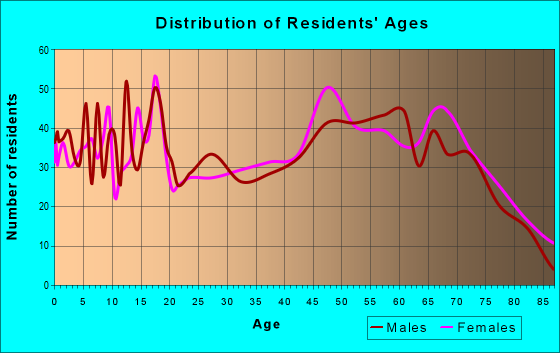
Males: 3,436
(54.5%)
Females: 2,871
(45.5%)
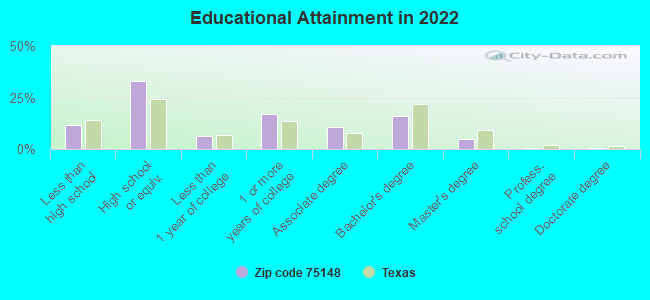
For population 25 years and over in 75148:
High school or higher: 87.4%
Bachelor's degree or higher: 21.3%
Graduate or professional degree: 5.4%
Unemployed: 3.3%
Mean travel time to work (commute): 31.7 minutes
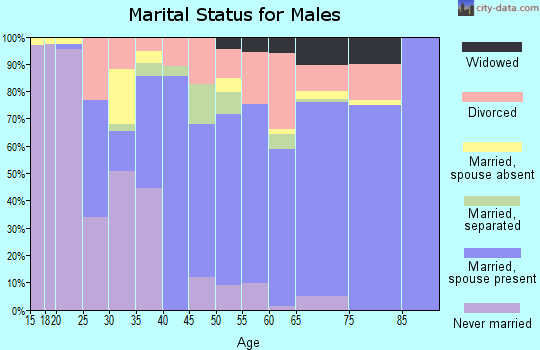
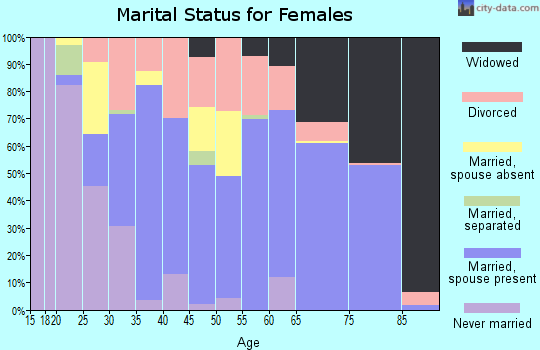
For population 15 years and over in 75148:
Never married: 24.9%
Now married: 55.3%
Separated: 1.1%
Widowed: 7.2%
Divorced: 11.5%
Zip code 75148 compared to state average:
Median house value below state average.
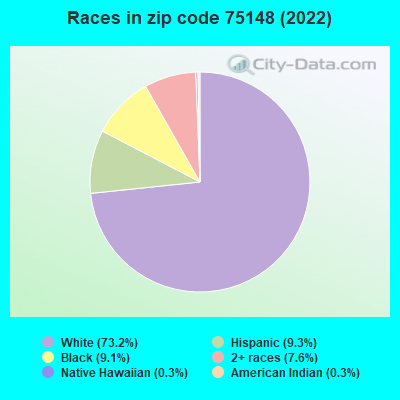
Hispanic race population percentage significantly below state average.
Median age significantly above state average.
Foreign-born population percentage significantly below state average.
Length of stay since moving in above state average.
Averages for the 2020 tax year for zip code 75148, filed in 2021:
Average Adjusted Gross Income (AGI) in 2020: $57,646 (Individual Income Tax Returns)
Here:
$57,646
State:
$77,054
Salary/wage: $46,302 (reported on 77.2% of returns)
Here:
$46,302
State:
$62,766
(% of AGI for various income ranges: 1187.7% for AGIs below $25k, 3258.9% for AGIs $25k-50k, 6397.0% for AGIs $50k-75k, 8120.0% for AGIs $75k-100k, 15410.0% for AGIs $100k-200k, 88630.0% for AGIs over 200k)
Taxable interest for individuals: $1,478 (reported on 20.8% of returns)
This zip code:
$1,478
Texas:
$2,665
(% of AGI for various income ranges: 14.4% for AGIs below $25k, 9.5% for AGIs $25k-50k, 37.4% for AGIs $50k-75k, 58.3% for AGIs $75k-100k, 168.7% for AGIs $100k-200k, 1115.0% for AGIs over 200k)
Ordinary dividends: $11,486 (reported on 11.2% of returns)
Here:
$11,486
State:
$10,044
(% of AGI for various income ranges: 14.6% for AGIs below $25k, 29.6% for AGIs $25k-50k, 61.7% for AGIs $50k-75k, 132.5% for AGIs $75k-100k, 296.0% for AGIs $100k-200k, 11540.0% for AGIs over 200k)
Net capital gain/loss in AGI: +$19,085 (reported on 12.7% of returns)
Here:
+$19,085
State:
+$39,590
(% of AGI for various income ranges: 0.3% for AGIs below $25k, 37.1% for AGIs $25k-50k, 113.5% for AGIs $50k-75k, 172.5% for AGIs $75k-100k, 850.0% for AGIs $100k-200k, 21745.0% for AGIs over 200k)
Profit/loss from business: +$7,809 (reported on 21.6% of returns)
Here:
+$7,809
State:
+$10,888
(% of AGI for various income ranges: 177.7% for AGIs below $25k, 156.9% for AGIs $25k-50k, 171.3% for AGIs $50k-75k, 225.0% for AGIs $75k-100k, 961.3% for AGIs $100k-200k)
Taxable individual retirement arrangement distribution: $27,422 (reported on 8.9% of returns)
75148:
$27,422
Texas:
$24,740
(% of AGI for various income ranges: 32.7% for AGIs below $25k, 87.1% for AGIs $25k-50k, 279.1% for AGIs $50k-75k, 638.3% for AGIs $75k-100k, 1359.3% for AGIs $100k-200k, 10615.0% for AGIs over 200k)
Total itemized deductions: $40,627 (reported on 4.2% of returns)
Here:
$40,627
State:
$40,428
(% of AGI for various income ranges: 70.9% for AGIs below $25k, 405.2% for AGIs $50k-75k, 722.0% for AGIs $100k-200k, 9470.0% for AGIs over 200k)
Charity contributions: $14,290 (reported on 3.9% of returns)
Here:
$14,290
State:
$18,201
(% of AGI for various income ranges: 105.2% for AGIs $50k-75k, 180.0% for AGIs $100k-200k, 4585.0% for AGIs over 200k)
Taxes paid: $7,109 (reported on 4.2% of returns)
75148:
$7,109
State:
$7,821
(% of AGI for various income ranges: 6.8% for AGIs below $25k, 86.1% for AGIs $50k-75k, 160.7% for AGIs $100k-200k, 1445.0% for AGIs over 200k)
Earned income credit: $2,531 (reported on 24.7% of returns)
Here:
$2,531
State:
$2,584
(% of AGI for various income ranges: 134.2% for AGIs below $25k, 101.8% for AGIs $25k-50k)
Percentage of individuals using paid preparers for their 2020 taxes: 93.1%
Here:
93%
State:
92%
(% for various income ranges: 93.4% for AGIs below $25k, 92.6% for AGIs $25k-50k, 90.9% for AGIs $50k-75k, 88.9% for AGIs $75k-100k, 96.2% for AGIs $100k-200k, 100.0% for AGIs over 200k)
Averages for the 2012 tax year for zip code 75148, filed in 2013:
Average Adjusted Gross Income (AGI) in 2012: $46,413 (Individual Income Tax Returns)
Here:
$46,413
State:
$65,384
Salary/wage: $39,705 (reported on 79.1% of returns)
Here:
$39,705
State:
$52,524
(% of AGI for various income ranges: 73.6% for AGIs below $25k, 76.0% for AGIs $25k-50k, 73.5% for AGIs $50k-75k, 71.5% for AGIs $75k-100k, 64.9% for AGIs $100k-200k, 52.4% for AGIs over 200k)
Taxable interest for individuals: $1,647 (reported on 25.2% of returns)
This zip code:
$1,647
Texas:
$2,372
(% of AGI for various income ranges: 0.8% for AGIs below $25k, 0.9% for AGIs $25k-50k, 0.9% for AGIs $50k-75k, 0.9% for AGIs $75k-100k, 1.5% for AGIs $100k-200k, 0.4% for AGIs over 200k)
Ordinary dividends: $5,041 (reported on 11.7% of returns)
Here:
$5,041
State:
$9,721
(% of AGI for various income ranges: 0.6% for AGIs below $25k, 0.5% for AGIs $25k-50k, 0.7% for AGIs $50k-75k, 0.5% for AGIs $75k-100k, 2.2% for AGIs $100k-200k, 2.3% for AGIs over 200k)
Net capital gain/loss in AGI: +$19,800 (reported on 9.1% of returns)
Here:
+$19,800
State:
+$35,319
(% of AGI for various income ranges: 0.4% for AGIs $50k-75k, 0.6% for AGIs $75k-100k, 2.7% for AGIs $100k-200k, 15.9% for AGIs over 200k)
Profit/loss from business: +$10,638 (reported on 20.4% of returns)
Here:
+$10,638
State:
+$13,732
(% of AGI for various income ranges: 9.4% for AGIs below $25k, 4.8% for AGIs $25k-50k, 3.1% for AGIs $50k-75k, 2.1% for AGIs $75k-100k, 8.6% for AGIs $100k-200k)
Taxable individual retirement arrangement distribution: $14,483 (reported on 10.0% of returns)
75148:
$14,483
Texas:
$19,511
(% of AGI for various income ranges: 2.7% for AGIs below $25k, 2.6% for AGIs $25k-50k, 4.0% for AGIs $50k-75k, 4.6% for AGIs $75k-100k, 5.3% for AGIs $100k-200k)
Total itemized deductions: $22,814 (22% of AGI, reported on 18.7% of returns)
Here:
$22,814
State:
$24,724
Here:
21.5% of AGI
State:
15.9% of AGI
(% of AGI for various income ranges: 5.2% for AGIs below $25k, 10.1% for AGIs $25k-50k, 9.5% for AGIs $50k-75k, 9.6% for AGIs $75k-100k, 11.6% for AGIs $100k-200k, 8.1% for AGIs over 200k)
Charity contributions: $4,973 (reported on 13.0% of returns)
Here:
$4,973
State:
$6,808
(% of AGI for various income ranges: 0.5% for AGIs below $25k, 1.1% for AGIs $25k-50k, 1.5% for AGIs $50k-75k, 1.0% for AGIs $75k-100k, 2.4% for AGIs $100k-200k, 1.5% for AGIs over 200k)
Taxes paid: $5,298 (reported on 17.8% of returns)
75148:
$5,298
State:
$6,921
(% of AGI for various income ranges: 0.8% for AGIs below $25k, 1.4% for AGIs $25k-50k, 1.4% for AGIs $50k-75k, 2.2% for AGIs $75k-100k, 3.0% for AGIs $100k-200k, 2.8% for AGIs over 200k)
Earned income credit: $2,529 (reported on 28.3% of returns)
Here:
$2,529
State:
$2,570
(% of AGI for various income ranges: 8.9% for AGIs below $25k, 1.7% for AGIs $25k-50k)
Percentage of individuals using paid preparers for their 2012 taxes: 60.0%
Here:
60%
State:
51%
(% for various income ranges: 58.9% for AGIs below $25k, 58.2% for AGIs $25k-50k, 61.5% for AGIs $50k-75k, 60.0% for AGIs $75k-100k, 64.7% for AGIs $100k-200k, 80.0% for AGIs over 200k)
Averages for the 2004 tax year for zip code 75148, filed in 2005:
Average Adjusted Gross Income (AGI) in 2004: $34,967 (Individual Income Tax Returns)
Here:
$34,967
State:
$47,881
Salary/wage: $29,559 (reported on 78.5% of returns)
Here:
$29,559
State:
$41,947
(% of AGI for various income ranges: 122.0% for AGIs below $10k, 73.7% for AGIs $10k-25k, 76.6% for AGIs $25k-50k, 69.4% for AGIs $50k-75k, 68.4% for AGIs $75k-100k, 46.3% for AGIs over 100k)
Taxable interest for individuals: $2,967 (reported on 31.4% of returns)
This zip code:
$2,967
Texas:
$2,255
(% of AGI for various income ranges: 5.1% for AGIs below $10k, 2.0% for AGIs $10k-25k, 2.1% for AGIs $25k-50k, 2.2% for AGIs $50k-75k, 2.7% for AGIs $75k-100k, 3.7% for AGIs over 100k)
Taxable dividends: $3,239 (reported on 14.5% of returns)
Here:
$3,239
State:
$4,261
(% of AGI for various income ranges: 2.2% for AGIs below $10k, 0.7% for AGIs $10k-25k, 0.7% for AGIs $25k-50k, 0.6% for AGIs $50k-75k, 1.0% for AGIs $75k-100k, 2.9% for AGIs over 100k)
Net capital gain/loss: +$11,433 (reported on 13.1% of returns)
Here:
+$11,433
State:
+$16,110
(% of AGI for various income ranges: -0.8% for AGIs below $10k, -0.5% for AGIs $10k-25k, 0.5% for AGIs $25k-50k, 0.6% for AGIs $50k-75k, -0.2% for AGIs $75k-100k, 15.1% for AGIs over 100k)
Profit/loss from business: +$7,703 (reported on 20.6% of returns)
Here:
+$7,703
State:
+$11,013
(% of AGI for various income ranges: 2.1% for AGIs below $10k, 8.8% for AGIs $10k-25k, 3.2% for AGIs $25k-50k, 5.8% for AGIs $50k-75k, 2.1% for AGIs $75k-100k, 3.5% for AGIs over 100k)
IRA payment deduction: $3,200 (reported on 1.4% of returns)
75148:
$3,200
Texas:
$3,120
Total itemized deductions: $18,209 (22% of AGI, reported on 16.1% of returns)
Here:
$18,209
State:
$19,631
Here:
21.9% of AGI
State:
18.9% of AGI
(% of AGI for various income ranges: 7.2% for AGIs below $10k, 5.7% for AGIs $10k-25k, 8.0% for AGIs $25k-50k, 9.6% for AGIs $50k-75k, 10.8% for AGIs $75k-100k, 8.4% for AGIs over 100k)
Charity contributions deductions: $3,875 (4% of AGI, reported on 12.9% of returns)
Here:
$3,875
State:
$4,753
Here:
4.3% of AGI
State:
4.2% of AGI
(% of AGI for various income ranges: 0.6% for AGIs $10k-25k, 1.5% for AGIs $25k-50k, 1.9% for AGIs $50k-75k, 1.9% for AGIs $75k-100k, 1.4% for AGIs over 100k)
Total tax: $5,478 (reported on 66.2% of returns)
75148:
$5,478
State:
$9,058
(% of AGI for various income ranges: 6.2% for AGIs below $10k, 3.8% for AGIs $10k-25k, 6.2% for AGIs $25k-50k, 9.2% for AGIs $50k-75k, 11.7% for AGIs $75k-100k, 18.2% for AGIs over 100k)
Earned income credit: $1,971 (reported on 28.1% of returns)
Here:
$1,971
State:
$2,024
Percentage of individuals using paid preparers for their 2004 taxes: 63.7%
Here:
64%
State:
57%
(% for various income ranges: 60.8% for AGIs below $10k, 66.3% for AGIs $10k-25k, 66.3% for AGIs $25k-50k, 60.2% for AGIs $50k-75k, 52.7% for AGIs $75k-100k, 68.1% for AGIs over 100k)
Likely homosexual households (counted as self-reported same-sex unmarried-partner households)
Lesbian couples: 0.0% of all households
Gay men: 0.2% of all households
Household received Food Stamps/SNAP in the past 12 months: 313 Household did not receive Food Stamps/SNAP in the past 12 months: 2,381
Women who had a birth in the past 12 months: 24 (25 now married, 0 unmarried) Women who did not have a birth in the past 12 months: 1,070 (432 now married, 639 unmarried)
Housing units in zip code 75148 with a mortgage: 861 (1 second mortgage, 2 both second mortgage and home equity loan) Median monthly owner costs for units with a mortgage: $1,461 Median monthly owner costs for units without a mortgage: $452
Residents with income below the poverty level in 2022:
This zip code:
16.3%
Whole state:
14.0%
Residents with income below 50% of the poverty level in 2022:
This zip code:
10.0%
Whole state:
7.4%
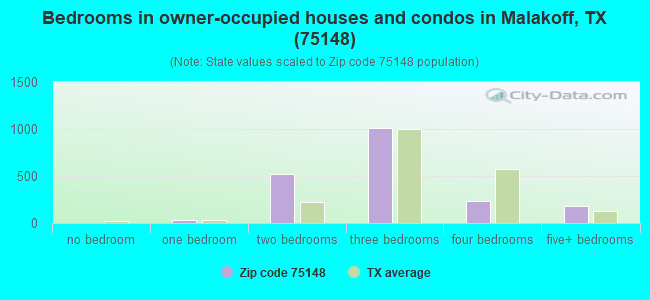
Median number of rooms in houses and condos:
Here:
5.3
State:
6.3
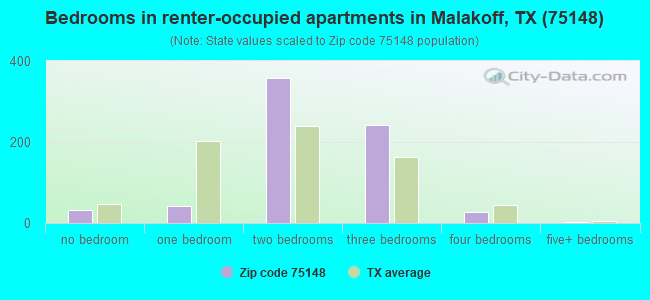
Median number of rooms in apartments:
Here:
4.3
State:
4.0
Notable locations in this zip code not listed on our city pages
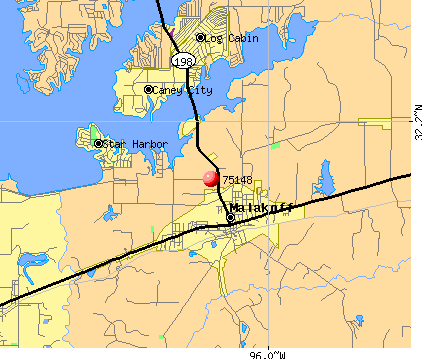
Notable locations in zip code 75148: Log Cabin Volunteer Fire Department (A), Caney City Volunteer Fire Department (B), Malakoff Volunteer Fire Department (C). Display/hide their locations on the map
Churches in zip code 75148 include: Church of Christ - Malakoff (A), Mary Queen of Heaven Catholic Church (B), First Baptist Church (C), Crescent Heights Baptist Church (D), First Assembly of God Church (E), New Hope Church (F). Display/hide their locations on the map
Lakes and reservoirs: Jackson Lake (A), Morrison Lake (B), Long Lake (C), Dodd Lake (D), Stephens Lake (E), Round Lake (F), Hall Lake (G), Barnes Lake (H). Display/hide their locations on the map
Streams, rivers, and creeks: Walnut Creek (A), Turkey Creek (B), Tick Branch (C), McAllister Slough (D), Clear Creek (E), Caney Creek (F). Display/hide their locations on the map
732 married couples with children.
342 single-parent households (105 men, 237 women).
91.9% of residents of 75148 zip code speak English at home.
8.2% of residents speak Spanish at home (71% very well, 11% well, 15% not well, 3% not at all).
0.1% of residents speak Asian or Pacific Island language at home (100% very well).
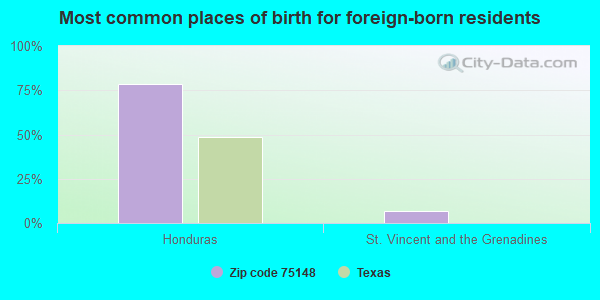
Foreign born population: 313 (5.0%) (27.4% of them are naturalized citizens)
This zip code:
5.0%
Whole state:
17.2%
78%Honduras
7%St. Vincent and the Grenadines
0%Guyana
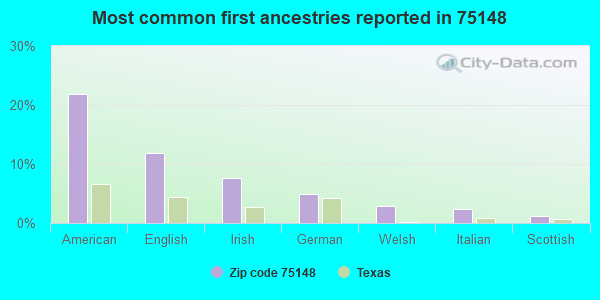
22%American
12%English
8%Irish
5%German
3%Welsh
2%Italian
1%Scottish
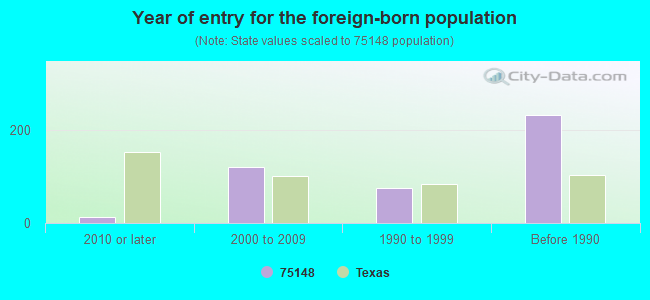
Year of entry for the foreign-born population
142010 or later
1202000 to 2009
751990 to 1999
233Before 1990
Facilities with environmental interests located in this zip code:
ACME BRICK COMPANY (700 WEST BARTLETT STREET in MALAKOFF, TX)
AIR MINOR (AIRS/AFS) (Resource Conservation and Recovery Act (tracking hazardous waste)) TRI REPORTER (Tracking of toxic chemicals releasing facilities) Business SIC and NAICS classification: BRICK AND STRUCTURAL CLAY TILE Organizations: TEXAS CLAY INDUSTRIES (CONTACT/OPERATOR)
, TEMTEX INDUSTRIES (CONTACT/OWNER)
Alternative names: ACME BRICK CO. TEXAS CLAY, ACME BRICK CO. TEXAS CLAY, TEXAS CLAY INDUS
Housing units lacking complete plumbing facilities: 4.0% Housing units lacking complete kitchen facilities: 4.6%
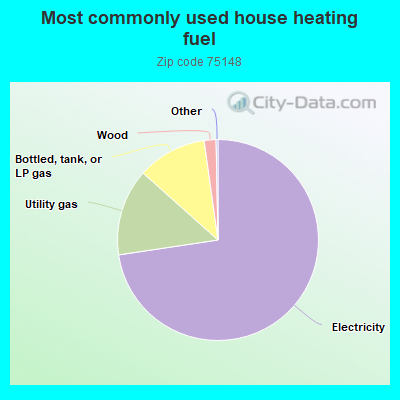
72.7%Electricity
14.0%Utility gas
11.2%Bottled, tank, or LP gas
1.9%Wood
Population in 1990: 4,972. Population change in the 1990s: +877 (+17.6%).
Place of birth for U.S.-born residents:
This state: 4,650
Northeast: 207
Midwest: 272
South: 369
West: 295
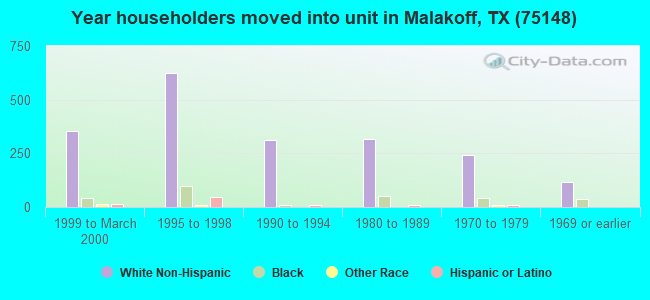
55% of the 75148 zip code residents lived in the same house 5 years ago. Out of people who lived in different houses, 53% lived in this county. Out of people who lived in different counties, 50% lived in Texas.
90% of the 75148 zip code residents lived in the same house 1 year ago. Out of people who lived in different houses, 39% moved from this county. Out of people who lived in different houses, 43% moved from different county within same state. Out of people who lived in different houses, 16% moved from different state. Out of people who lived in different houses, 4% moved from abroad.
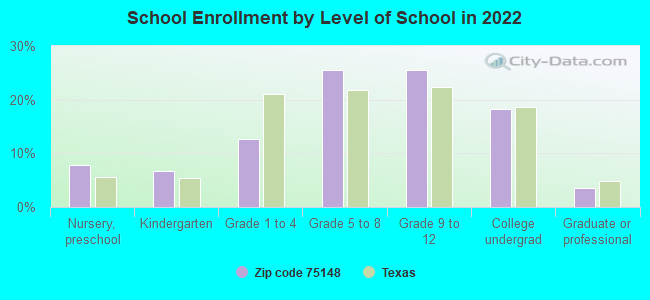
Private vs. public school enrollment:
Students in private schools in grades 1 to 8 (elementary and middle school): 34
Here:
7.5%
Texas:
8.8%
Students in private schools in grades 9 to 12 (high school): 15
Here:
5.0%
Texas:
8.0%
Students in private undergraduate colleges: 70
Here:
32.6%
Texas:
16.2%
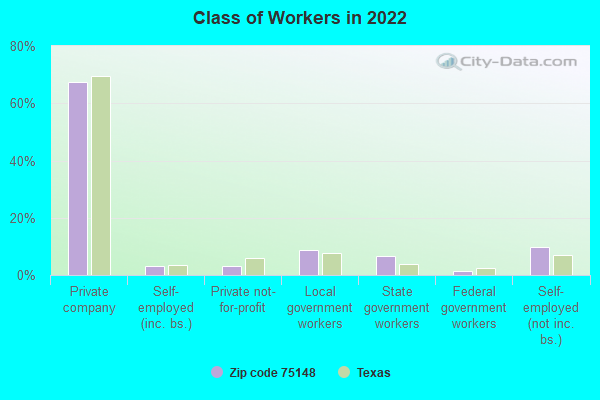
Occupation by median earnings in the past 12 months ($)
67,649Management occupations
66,675Health diagnosing and treating practitioners and other technical occupations
61,877Community and social service occupations
51,100Education, training, and library occupations
50,234Installation, maintenance, and repair occupations
49,522Architecture and engineering occupations
Companies with federal contracts located in this zip code:
HAL JOHNSON (#1 RAINBOW DRIVE in MALAKOFF, TX; small business) : $15,025 in 2 contractsfrom 2004 to 2005
$7,900 with Army for Recreation Site Maintenance Services (non-construction). Signed on 2005-03-25. Completion date: 2005-09-30.
$7,125, same as above.Signed on 2004-06-04. Completion date: 2004-06-03.
Top industries in this zip code by the number of employees in 2005:
Administrative and Support and Waste Management and Remediation Services: Security Guards and Patrol Services (250-499 employees: 1 establishment)
Health Care and Social Assistance: Home Health Care Services (50-99: 1, 10-19: 1)
Health Care and Social Assistance: Nursing Care Facilities (50-99: 1)
Construction: Poured Concrete Foundation and Structure Contractors (20-49: 1, 5-9: 1)
Construction: Power and Communication Line and Related Structures Construction (20-49: 1)
Construction: Residential Remodelers (20-49: 1)
People in group quarters in 2010:
80 people in nursing facilities/skilled-nursing facilities
People in group quarters in 2000:
89 people in nursing homes
Home Mortgage Disclosure Act Aggregated Statistics For Year 2003 (Based on 2 full and 4 partial tracts)
A) FHA, FSA/RHS & VA Home Purchase Loans
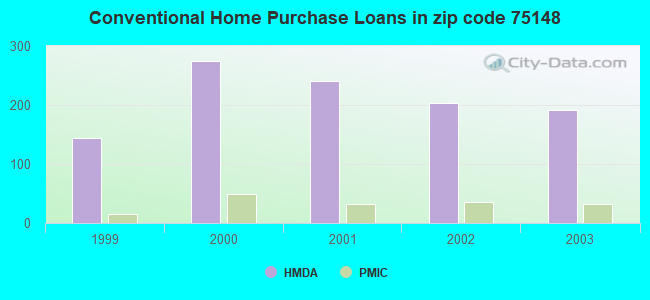
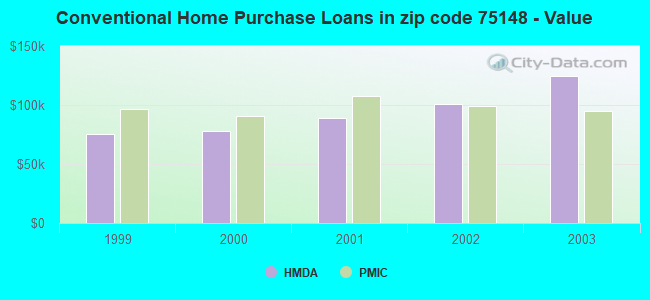
B) Conventional Home Purchase Loans
C) Refinancings
D) Home Improvement Loans
F) Non-occupant Loans on < 5 Family Dwellings (A B C & D)
Number
Average Value
Number
Average Value
Number
Average Value
Number
Average Value
Number
Average Value
LOANS ORIGINATED
15
$88,713
192
$124,869
286
$155,573
29
$25,073
173
$176,014
APPLICATIONS APPROVED, NOT ACCEPTED
1
$27,280
19
$118,656
42
$117,900
9
$28,049
11
$127,965
APPLICATIONS DENIED
3
$54,907
52
$62,844
145
$87,481
20
$22,877
20
$111,258
APPLICATIONS WITHDRAWN
2
$89,750
23
$106,880
81
$77,725
1
$78,130
11
$126,526
FILES CLOSED FOR INCOMPLETENESS
0
$0
9
$126,791
11
$124,922
2
$49,750
3
$200,827
Aggregated Statistics For Year 2002 (Based on 2 full and 4 partial tracts)
A) FHA, FSA/RHS & VA Home Purchase Loans
B) Conventional Home Purchase Loans
C) Refinancings
D) Home Improvement Loans
F) Non-occupant Loans on < 5 Family Dwellings (A B C & D)
Number
Average Value
Number
Average Value
Number
Average Value
Number
Average Value
Number
Average Value
LOANS ORIGINATED
27
$73,549
204
$101,219
193
$135,846
38
$23,483
145
$156,968
APPLICATIONS APPROVED, NOT ACCEPTED
1
$30,400
24
$59,793
35
$94,305
6
$71,440
8
$127,412
APPLICATIONS DENIED
6
$92,990
84
$52,726
69
$85,594
23
$13,092
13
$70,132
APPLICATIONS WITHDRAWN
2
$32,735
20
$91,527
52
$103,187
6
$46,207
12
$158,613
FILES CLOSED FOR INCOMPLETENESS
1
$79,850
6
$159,628
8
$93,182
1
$18,710
1
$671,350
Aggregated Statistics For Year 2001 (Based on 2 full and 4 partial tracts)
A) FHA, FSA/RHS & VA Home Purchase Loans
B) Conventional Home Purchase Loans
C) Refinancings
D) Home Improvement Loans
F) Non-occupant Loans on < 5 Family Dwellings (A B C & D)
Number
Average Value
Number
Average Value
Number
Average Value
Number
Average Value
Number
Average Value
LOANS ORIGINATED
14
$69,953
240
$89,289
149
$128,480
38
$16,832
113
$141,111
APPLICATIONS APPROVED, NOT ACCEPTED
3
$88,520
60
$56,589
20
$60,554
6
$55,835
11
$107,780
APPLICATIONS DENIED
3
$70,717
157
$48,790
65
$68,219
33
$12,647
20
$98,142
APPLICATIONS WITHDRAWN
6
$63,107
26
$83,977
50
$81,092
8
$16,671
7
$115,323
FILES CLOSED FOR INCOMPLETENESS
2
$60,795
7
$137,261
16
$81,083
0
$0
1
$125,400
Aggregated Statistics For Year 2000 (Based on 2 full and 4 partial tracts)
A) FHA, FSA/RHS & VA Home Purchase Loans
B) Conventional Home Purchase Loans
C) Refinancings
D) Home Improvement Loans
F) Non-occupant Loans on < 5 Family Dwellings (A B C & D)
Number
Average Value
Number
Average Value
Number
Average Value
Number
Average Value
Number
Average Value
LOANS ORIGINATED
15
$76,563
274
$77,737
62
$87,345
25
$37,105
72
$100,955
APPLICATIONS APPROVED, NOT ACCEPTED
7
$46,689
54
$59,404
12
$44,387
10
$16,322
10
$92,273
APPLICATIONS DENIED
10
$69,782
249
$41,563
42
$52,862
36
$16,131
17
$58,122
APPLICATIONS WITHDRAWN
7
$59,011
27
$99,094
29
$62,433
1
$690
6
$249,242
FILES CLOSED FOR INCOMPLETENESS
3
$53,853
4
$35,168
3
$84,443
0
$0
1
$158,600
Aggregated Statistics For Year 1999 (Based on 1 full and 2 partial tracts)
A) FHA, FSA/RHS & VA Home Purchase Loans
B) Conventional Home Purchase Loans
C) Refinancings
D) Home Improvement Loans
F) Non-occupant Loans on < 5 Family Dwellings (A B C & D)
2002 - 2018 National Fire Incident Reporting System (NFIRS) incidents
According to the data from the years 2002 - 2018 the average number of fires per year is 63. The highest number of reported fires - 135 took place in 2011, and the least - 6 in 2002. The data has a rising trend.
When looking into fire subcategories, the most reports belonged to: Outside Fires (56.4%), and Structure Fires (31.2%).
Fire incident types reported to NFIRS in Zip Code 75148
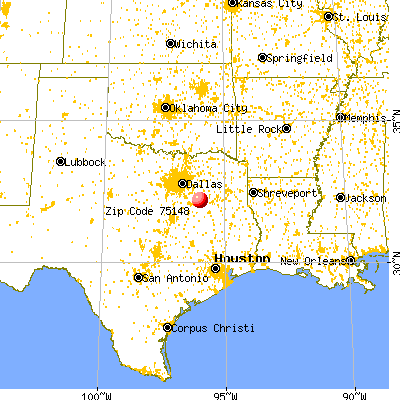


 Nearest zip codes: 75163, 75751, 75156, 75144, 75832, 75124.
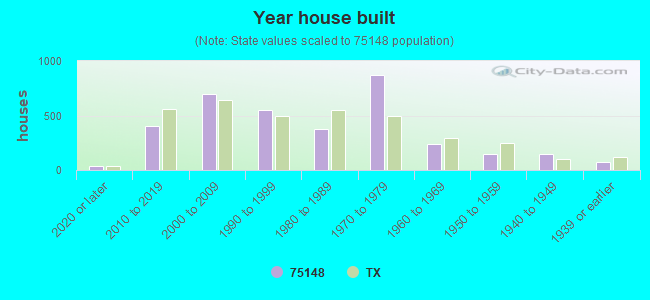


 According to the data from the years 2002 - 2018 the average number of fires per year is 63. The highest number of reported fires - 135 took place in 2011, and the least - 6 in 2002. The data has a rising trend.
 When looking into fire subcategories, the most reports belonged to: Outside Fires (56.4%), and Structure Fires (31.2%).