Estimated zip code population in 2022: 6,641 Zip code population in 2010: 6,165 Zip code population in 2000: 5,807
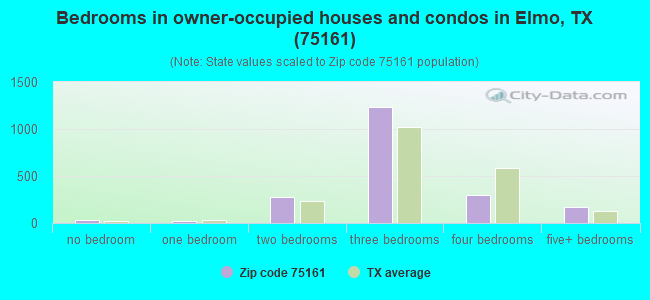
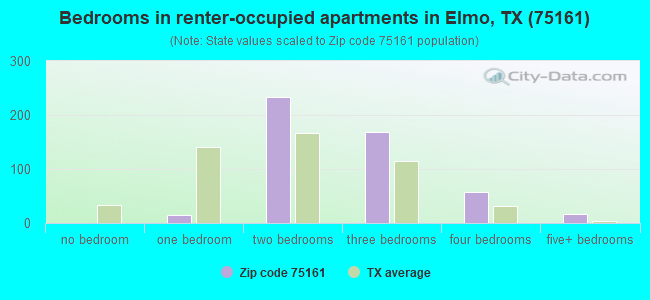
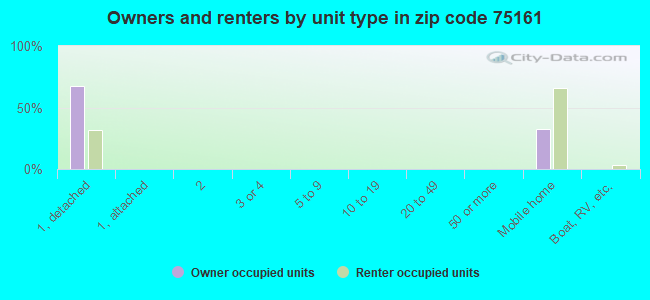
Houses and condos: 2,575 Renter-occupied apartments: 498
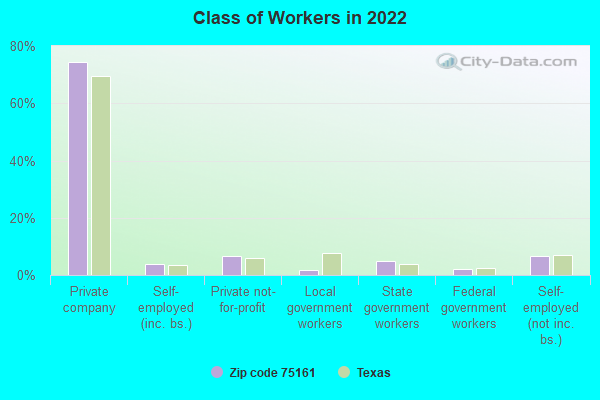
% of renters here:
20%
State:
38%
March 2022 cost of living index in zip code 75161: 84.3 (less than average, U.S. average is 100)
Land area: 113.9 sq. mi. Water area: 2.6 sq. mi.
Population density: 58 people per square mile
(very low).
OSM Map
General Map
Google Map
MSN Map
OSM Map
General Map
Google Map
MSN Map
OSM Map
General Map
Google Map
MSN Map
OSM Map
General Map
Google Map
MSN Map
Please wait while loading the map...
Real estate property taxes paid for housing units in 2022:
This zip code:
1.0% ($2,279)
Texas:
1.5% ($4,050)
Median real estate property taxes paid for housing units with mortgages in 2022: $3,105 (0.9%) Median real estate property taxes paid for housing units with no mortgage in 2022: $1,673 (0.9%)
Business Search- 14 Million verified businesses
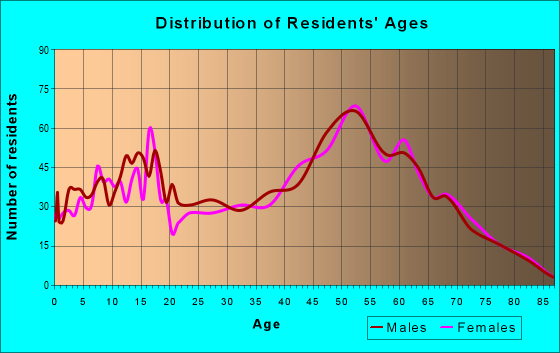
Males: 3,105
(46.8%)
Females: 3,535
(53.2%)
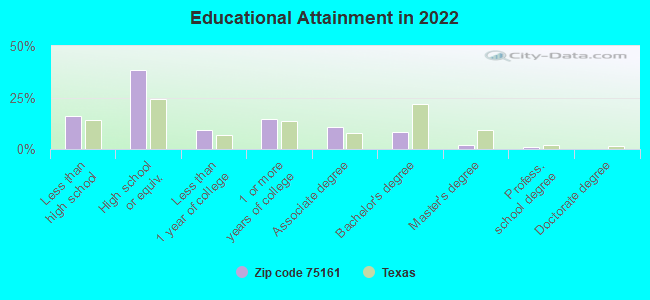
For population 25 years and over in 75161:
High school or higher: 82.8%
Bachelor's degree or higher: 11.3%
Graduate or professional degree: 2.9%
Unemployed: 6.2%
Mean travel time to work (commute): 35.3 minutes
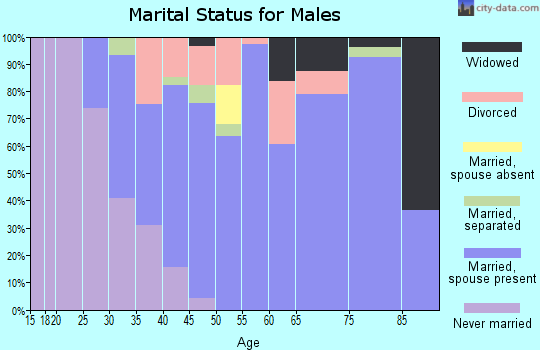
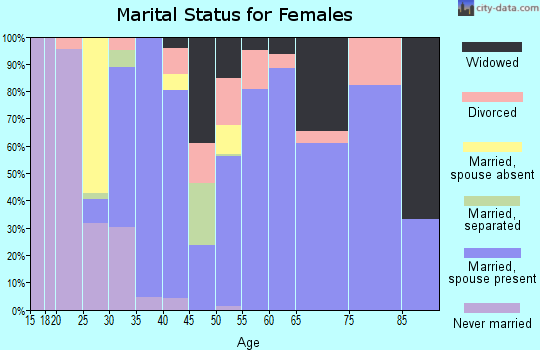
For population 15 years and over in 75161:
Never married: 17.8%
Now married: 54.6%
Separated: 4.7%
Widowed: 6.9%
Divorced: 16.0%
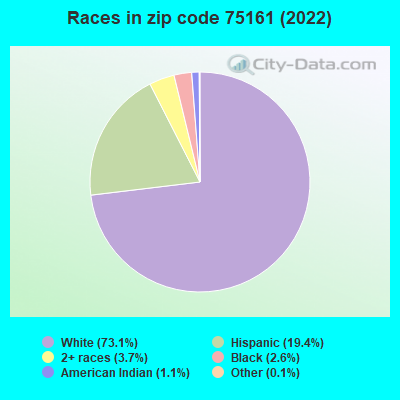
Zip code 75161 compared to state average:
Black race population percentage significantly below state average.
Hispanic race population percentage below state average.
Median age significantly above state average.
Renting percentage below state average.
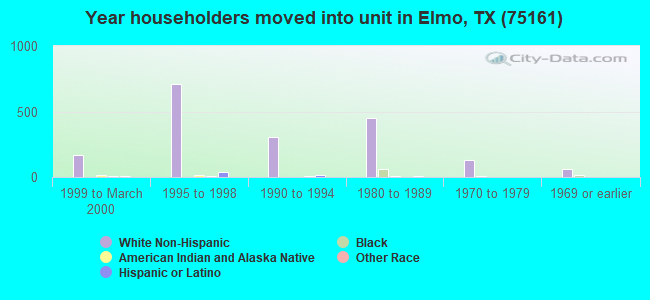
Length of stay since moving in significantly above state average.
Number of college students below state average.
Percentage of population with a bachelor's degree or higher significantly below state average.
Averages for the 2020 tax year for zip code 75161, filed in 2021:
Average Adjusted Gross Income (AGI) in 2020: $57,239 (Individual Income Tax Returns)
Here:
$57,239
State:
$77,054
Salary/wage: $53,884 (reported on 83.0% of returns)
Here:
$53,884
State:
$62,766
(% of AGI for various income ranges: 1178.7% for AGIs below $25k, 3632.1% for AGIs $25k-50k, 6724.6% for AGIs $50k-75k, 9989.2% for AGIs $75k-100k, 17912.1% for AGIs $100k-200k, 54173.3% for AGIs over 200k)
Taxable interest for individuals: $1,638 (reported on 17.6% of returns)
This zip code:
$1,638
Texas:
$2,665
(% of AGI for various income ranges: 15.5% for AGIs below $25k, 19.3% for AGIs $25k-50k, 16.1% for AGIs $50k-75k, 22.1% for AGIs $75k-100k, 145.9% for AGIs $100k-200k, 633.3% for AGIs over 200k)
Ordinary dividends: $2,893 (reported on 8.4% of returns)
Here:
$2,893
State:
$10,044
(% of AGI for various income ranges: 6.1% for AGIs below $25k, 20.9% for AGIs $25k-50k, 24.9% for AGIs $50k-75k, 51.7% for AGIs $75k-100k, 94.8% for AGIs $100k-200k, 466.7% for AGIs over 200k)
Net capital gain/loss in AGI: +$10,374 (reported on 8.9% of returns)
Here:
+$10,374
State:
+$39,590
(% of AGI for various income ranges: 4.2% for AGIs below $25k, 30.7% for AGIs $25k-50k, 53.9% for AGIs $50k-75k, 83.8% for AGIs $75k-100k, 256.2% for AGIs $100k-200k, 6000.0% for AGIs over 200k)
Profit/loss from business: +$7,347 (reported on 21.6% of returns)
Here:
+$7,347
State:
+$10,888
(% of AGI for various income ranges: 194.8% for AGIs below $25k, 216.4% for AGIs $25k-50k, 153.9% for AGIs $50k-75k, 451.2% for AGIs $75k-100k, 310.3% for AGIs $100k-200k)
Taxable individual retirement arrangement distribution: $17,023 (reported on 6.3% of returns)
75161:
$17,023
Texas:
$24,740
(% of AGI for various income ranges: 52.4% for AGIs below $25k, 68.4% for AGIs $25k-50k, 55.9% for AGIs $50k-75k, 248.3% for AGIs $75k-100k, 688.3% for AGIs $100k-200k)
Total itemized deductions: $31,637 (reported on 5.5% of returns)
Here:
$31,637
State:
$40,428
(% of AGI for various income ranges: 102.4% for AGIs $25k-50k, 247.1% for AGIs $50k-75k, 247.1% for AGIs $75k-100k, 946.2% for AGIs $100k-200k, 3146.7% for AGIs over 200k)
Charity contributions: $12,762 (reported on 4.6% of returns)
Here:
$12,762
State:
$18,201
(% of AGI for various income ranges: 23.1% for AGIs below $25k, 107.3% for AGIs $50k-75k, 484.8% for AGIs $100k-200k)
Taxes paid: $6,005 (reported on 5.5% of returns)
75161:
$6,005
State:
$7,821
(% of AGI for various income ranges: 15.1% for AGIs $25k-50k, 45.1% for AGIs $50k-75k, 52.1% for AGIs $75k-100k, 191.4% for AGIs $100k-200k, 566.7% for AGIs over 200k)
Earned income credit: $2,411 (reported on 17.9% of returns)
Here:
$2,411
State:
$2,584
(% of AGI for various income ranges: 109.9% for AGIs below $25k, 80.1% for AGIs $25k-50k)
Percentage of individuals using paid preparers for their 2020 taxes: 92.5%
Here:
93%
State:
92%
(% for various income ranges: 91.3% for AGIs below $25k, 93.1% for AGIs $25k-50k, 92.6% for AGIs $50k-75k, 91.4% for AGIs $75k-100k, 93.9% for AGIs $100k-200k, 100.0% for AGIs over 200k)
Averages for the 2012 tax year for zip code 75161, filed in 2013:
Average Adjusted Gross Income (AGI) in 2012: $46,087 (Individual Income Tax Returns)
Here:
$46,087
State:
$65,384
Salary/wage: $43,736 (reported on 84.7% of returns)
Here:
$43,736
State:
$52,524
(% of AGI for various income ranges: 77.1% for AGIs below $25k, 86.3% for AGIs $25k-50k, 81.7% for AGIs $50k-75k, 83.0% for AGIs $75k-100k, 82.8% for AGIs $100k-200k, 60.5% for AGIs over 200k)
Taxable interest for individuals: $1,064 (reported on 19.2% of returns)
This zip code:
$1,064
Texas:
$2,372
(% of AGI for various income ranges: 0.9% for AGIs below $25k, 0.4% for AGIs $25k-50k, 0.4% for AGIs $50k-75k, 0.1% for AGIs $75k-100k, 0.5% for AGIs $100k-200k, 0.7% for AGIs over 200k)
Ordinary dividends: $2,554 (reported on 10.7% of returns)
Here:
$2,554
State:
$9,721
(% of AGI for various income ranges: 0.7% for AGIs below $25k, 0.3% for AGIs $25k-50k, 0.3% for AGIs $50k-75k, 0.6% for AGIs $75k-100k, 1.4% for AGIs $100k-200k)
Net capital gain/loss in AGI: +$1,804 (reported on 8.8% of returns)
Here:
+$1,804
State:
+$35,319
(% of AGI for various income ranges: 0.1% for AGIs below $25k, 0.2% for AGIs $50k-75k, 1.3% for AGIs $100k-200k)
Profit/loss from business: +$8,134 (reported on 19.2% of returns)
Here:
+$8,134
State:
+$13,732
(% of AGI for various income ranges: 9.1% for AGIs below $25k, 2.1% for AGIs $25k-50k, 2.2% for AGIs $50k-75k, 1.9% for AGIs $75k-100k, 5.8% for AGIs $100k-200k)
Taxable individual retirement arrangement distribution: $13,152 (reported on 8.0% of returns)
75161:
$13,152
Texas:
$19,511
(% of AGI for various income ranges: 3.3% for AGIs below $25k, 1.8% for AGIs $25k-50k, 2.0% for AGIs $50k-75k, 3.8% for AGIs $75k-100k, 2.6% for AGIs $100k-200k)
Total itemized deductions: $20,100 (24% of AGI, reported on 20.3% of returns)
Here:
$20,100
State:
$24,724
Here:
23.9% of AGI
State:
15.9% of AGI
(% of AGI for various income ranges: 8.2% for AGIs below $25k, 8.1% for AGIs $25k-50k, 8.6% for AGIs $50k-75k, 10.0% for AGIs $75k-100k, 10.0% for AGIs $100k-200k, 7.5% for AGIs over 200k)
Charity contributions: $5,376 (reported on 14.2% of returns)
Here:
$5,376
State:
$6,808
(% of AGI for various income ranges: 0.6% for AGIs below $25k, 1.0% for AGIs $25k-50k, 1.4% for AGIs $50k-75k, 1.5% for AGIs $75k-100k, 4.1% for AGIs $100k-200k)
Taxes paid: $4,092 (reported on 19.9% of returns)
75161:
$4,092
State:
$6,921
(% of AGI for various income ranges: 0.9% for AGIs below $25k, 1.4% for AGIs $25k-50k, 1.7% for AGIs $50k-75k, 2.2% for AGIs $75k-100k, 2.5% for AGIs $100k-200k, 1.4% for AGIs over 200k)
Earned income credit: $2,318 (reported on 21.5% of returns)
Here:
$2,318
State:
$2,570
(% of AGI for various income ranges: 7.5% for AGIs below $25k, 1.3% for AGIs $25k-50k)
Percentage of individuals using paid preparers for their 2012 taxes: 55.9%
Here:
56%
State:
51%
(% for various income ranges: 52.4% for AGIs below $25k, 55.9% for AGIs $25k-50k, 57.1% for AGIs $50k-75k, 60.9% for AGIs $75k-100k, 60.0% for AGIs $100k-200k, 100.0% for AGIs over 200k)
Averages for the 2004 tax year for zip code 75161, filed in 2005:
Average Adjusted Gross Income (AGI) in 2004: $37,165 (Individual Income Tax Returns)
Here:
$37,165
State:
$47,881
Salary/wage: $36,544 (reported on 86.5% of returns)
Here:
$36,544
State:
$41,947
(% of AGI for various income ranges: 175.1% for AGIs below $10k, 81.9% for AGIs $10k-25k, 89.1% for AGIs $25k-50k, 85.9% for AGIs $50k-75k, 89.5% for AGIs $75k-100k, 69.4% for AGIs over 100k)
Taxable interest for individuals: $1,518 (reported on 25.2% of returns)
This zip code:
$1,518
Texas:
$2,255
(% of AGI for various income ranges: 9.7% for AGIs below $10k, 1.1% for AGIs $10k-25k, 0.6% for AGIs $25k-50k, 0.3% for AGIs $50k-75k, 0.5% for AGIs $75k-100k, 2.6% for AGIs over 100k)
Taxable dividends: $1,062 (reported on 11.7% of returns)
Here:
$1,062
State:
$4,261
(% of AGI for various income ranges: 2.1% for AGIs below $10k, 0.5% for AGIs $10k-25k, 0.4% for AGIs $25k-50k, 0.2% for AGIs $50k-75k, 0.2% for AGIs $75k-100k, 0.3% for AGIs over 100k)
Net capital gain/loss: +$4,229 (reported on 10.1% of returns)
Here:
+$4,229
State:
+$16,110
(% of AGI for various income ranges: -2.9% for AGIs below $10k, 0.0% for AGIs $10k-25k, 0.6% for AGIs $25k-50k, 0.5% for AGIs $50k-75k, 0.5% for AGIs $75k-100k, 4.6% for AGIs over 100k)
Profit/loss from business: +$4,937 (reported on 19.7% of returns)
Here:
+$4,937
State:
+$11,013
(% of AGI for various income ranges: 9.5% for AGIs below $10k, 7.3% for AGIs $10k-25k, 2.4% for AGIs $25k-50k, 2.0% for AGIs $50k-75k, 0.4% for AGIs $75k-100k, 2.1% for AGIs over 100k)
IRA payment deduction: $3,438 (reported on 1.4% of returns)
75161:
$3,438
Texas:
$3,120
Total itemized deductions: $16,508 (26% of AGI, reported on 25.3% of returns)
Here:
$16,508
State:
$19,631
Here:
25.9% of AGI
State:
18.9% of AGI
(% of AGI for various income ranges: 26.0% for AGIs below $10k, 8.0% for AGIs $10k-25k, 11.1% for AGIs $25k-50k, 10.3% for AGIs $50k-75k, 12.4% for AGIs $75k-100k, 12.8% for AGIs over 100k)
Charity contributions deductions: $3,564 (5% of AGI, reported on 17.7% of returns)
Here:
$3,564
State:
$4,753
Here:
5.1% of AGI
State:
4.2% of AGI
(% of AGI for various income ranges: 0.8% for AGIs below $10k, 0.7% for AGIs $10k-25k, 1.2% for AGIs $25k-50k, 1.4% for AGIs $50k-75k, 2.0% for AGIs $75k-100k, 3.3% for AGIs over 100k)
Total tax: $4,742 (reported on 73.1% of returns)
75161:
$4,742
State:
$9,058
(% of AGI for various income ranges: 6.1% for AGIs below $10k, 4.0% for AGIs $10k-25k, 6.0% for AGIs $25k-50k, 9.1% for AGIs $50k-75k, 10.6% for AGIs $75k-100k, 17.5% for AGIs over 100k)
Earned income credit: $1,693 (reported on 21.3% of returns)
Here:
$1,693
State:
$2,024
Percentage of individuals using paid preparers for their 2004 taxes: 60.9%
Here:
61%
State:
57%
(% for various income ranges: 54.4% for AGIs below $10k, 63.9% for AGIs $10k-25k, 59.2% for AGIs $25k-50k, 61.1% for AGIs $50k-75k, 62.4% for AGIs $75k-100k, 77.7% for AGIs over 100k)
Likely homosexual households (counted as self-reported same-sex unmarried-partner households)
Lesbian couples: 0.5% of all households
Gay men: 0.0% of all households
Household received Food Stamps/SNAP in the past 12 months: 309 Household did not receive Food Stamps/SNAP in the past 12 months: 2,215
Women who had a birth in the past 12 months: 96 (22 now married, 71 unmarried) Women who did not have a birth in the past 12 months: 1,370 (745 now married, 620 unmarried)
Housing units in zip code 75161 with a mortgage: 803 (12 second mortgage, 9 home equity loan, 3 both second mortgage and home equity loan) Median monthly owner costs for units with a mortgage: $1,720 Median monthly owner costs for units without a mortgage: $595
Residents with income below the poverty level in 2022:
This zip code:
12.1%
Whole state:
14.0%
Residents with income below 50% of the poverty level in 2022:
This zip code:
3.1%
Whole state:
7.4%
Median number of rooms in houses and condos:
Here:
6.5
State:
6.3
Median number of rooms in apartments:
Here:
4.5
State:
4.0
Notable locations in this zip code not listed on our city pages
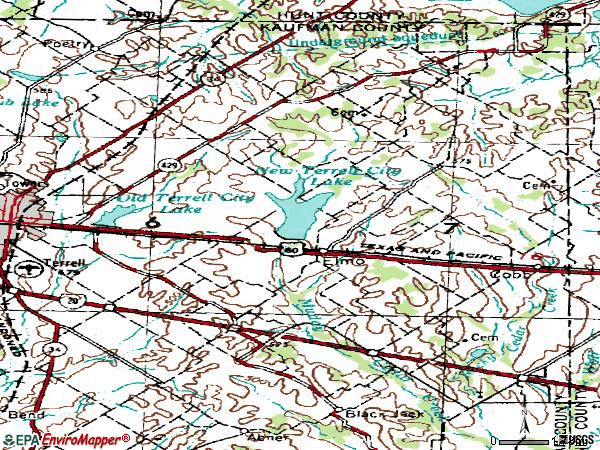
Notable locations in zip code 75161: McCoy (A), College Mound (B), College Mound Volunteer Fire Department (C), Ables Springs Volunteer Fire Department (D), Elmo Volunteer Fire Department (E). Display/hide their locations on the map
Churches in zip code 75161 include: Shady Grove Church (A), Fairview Church (B), College Mound United Methodist Church (C). Display/hide their locations on the map
Cemeteries: Ables Springs Cemetery (1), Henderson Mosley Cemetery (2), Weaver Cemetery (3), New Salem Cemetery (4), Cedar Grove Cemetery (5), State Hospital Cemetery (6), Elmo Cemetery (7). Display/hide their locations on the map
Reservoirs: Tankersley Lake (A), Old Terrell City Lake (B), New Terrell City Lake (C), Soil Conservation Service Site 57 Reservoir (D), Soil Conservation Service Site 87a Reservoir (E), Soil Conservation Service Site 88 Reservoir (F), Soil Conservation Service Site 89 Reservoir (G), Soil Conservation Service Site 90 Reservoir (H). Display/hide their locations on the map
Size of family households: 774 2-persons, 530 3-persons, 269 4-persons, 110 5-persons, 56 6-persons, 106 7-or-more-persons
Size of nonfamily households: 589 1-person, 89 2-persons
417 married couples with children.
247 single-parent households (247 women).
86.1% of residents of 75161 zip code speak English at home.
13.5% of residents speak Spanish at home (53% very well, 11% well, 17% not well, 18% not at all).
0.3% of residents speak Asian or Pacific Island language at home (100% very well).
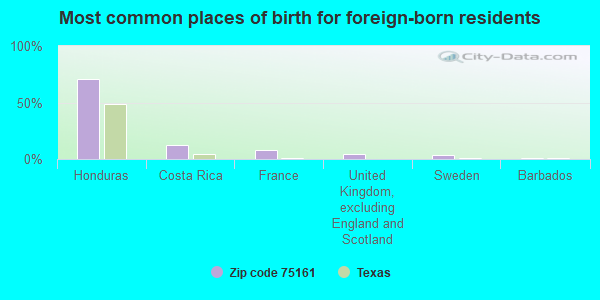
Foreign born population: 903 (13.6%) (18.1% of them are naturalized citizens)
This zip code:
13.6%
Whole state:
17.2%
70%Honduras
12%Costa Rica
8%France
4%United Kingdom, excluding England and Scotland
4%Sweden
1%Barbados
0%St. Vincent and the Grenadines
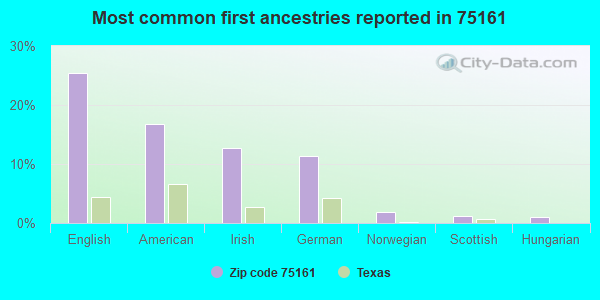
25%English
17%American
13%Irish
11%German
2%Norwegian
1%Scottish
1%Hungarian
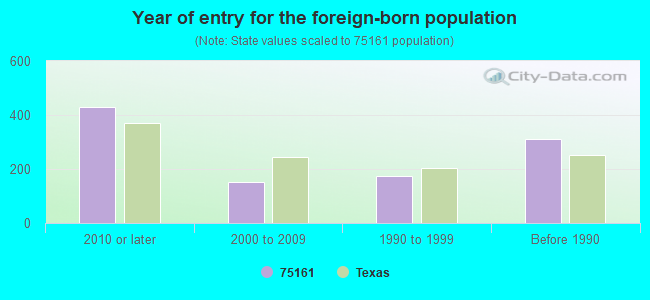
Year of entry for the foreign-born population
4282010 or later
1512000 to 2009
1751990 to 1999
312Before 1990
Housing units lacking complete plumbing facilities: 0.7% Housing units lacking complete kitchen facilities: 0.2%
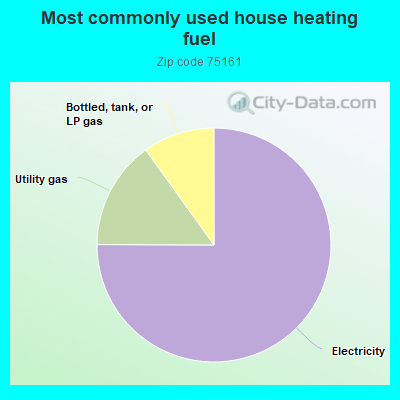
75.0%Electricity
15.0%Utility gas
9.9%Bottled, tank, or LP gas
Place of birth for U.S.-born residents:
This state: 3,537
Northeast: 145
Midwest: 700
South: 747
West: 464
64% of the 75161 zip code residents lived in the same house 5 years ago. Out of people who lived in different houses, 40% lived in this county. Out of people who lived in different counties, 50% lived in Texas.
92% of the 75161 zip code residents lived in the same house 1 year ago. Out of people who lived in different houses, 42% moved from this county. Out of people who lived in different houses, 47% moved from different county within same state. Out of people who lived in different houses, 13% moved from different state.
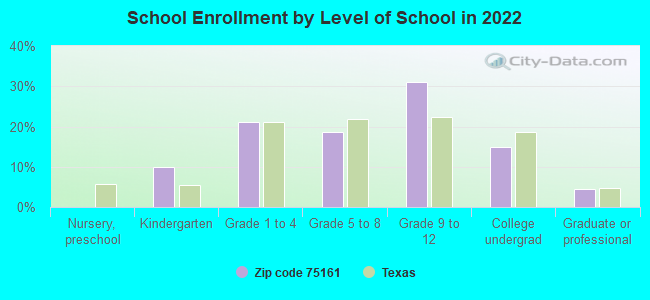
Private vs. public school enrollment:
Students in private schools in grades 1 to 8 (elementary and middle school): 9
Here:
2.6%
Texas:
8.8%
Students in private schools in grades 9 to 12 (high school): 57
Here:
19.2%
Texas:
8.0%
Students in private undergraduate colleges: 61
Here:
42.7%
Texas:
16.2%
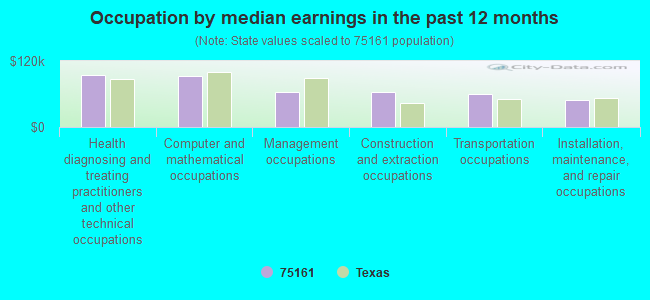
Occupation by median earnings in the past 12 months ($)
95,280Health diagnosing and treating practitioners and other technical occupations
93,574Computer and mathematical occupations
63,660Management occupations
63,321Construction and extraction occupations
59,476Transportation occupations
48,980Installation, maintenance, and repair occupations
Companies with federal contracts located in this zip code:
STORM SHELTERS OF TEXAS (10256 COUNTY ROAD 344 in TERRELL, TX; small business)
$22,000 with Army for Building Components, Prefabricated. Signed on 2004-04-27. Completion date: 2004-05-27.
Top industries in this zip code by the number of employees in 2005:
Administrative and Support and Waste Management and Remediation Services: Septic Tank and Related Services (10-19 employees: 1 establishment)
Construction: Painting and Wall Covering Contractors (10-19: 1)
Utilities: Water Supply and Irrigation Systems (5-9: 1, 1-4: 2)
Construction: Plumbing, Heating, and Air-Conditioning Contractors (5-9: 1, 1-4: 1)
Real Estate and Rental and Leasing: Lessors of Residential Buildings and Dwellings (5-9: 1)
Other Services (except Public Administration): General Automotive Repair (5-9: 1)
Arts, Entertainment, and Recreation: All Other Amusement and Recreation Industries (5-9: 1)
Fatal accident statistics in 2014:
Fatal accident count: 5
Vehicles involved in fatal accidents: 6
Fatal accidents caused by drunken drivers: 3
Fatalities: 6
Persons involved in fatal accidents: 6
Pedestrians involved in fatal accidents: 0
Fatal accident statistics in 2012:
Fatal accident count: 1
Vehicles involved in fatal accidents: 3
Fatal accidents caused by drunken drivers: 0
Fatalities: 2
Persons involved in fatal accidents: 4
Pedestrians involved in fatal accidents: 0
Home Mortgage Disclosure Act Aggregated Statistics For Year 2009 (Based on 6 partial tracts)
A) FHA, FSA/RHS & VA Home Purchase Loans
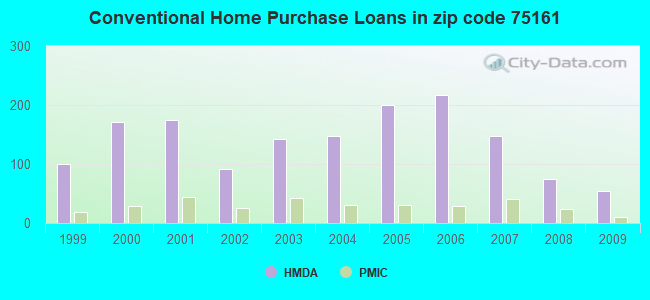
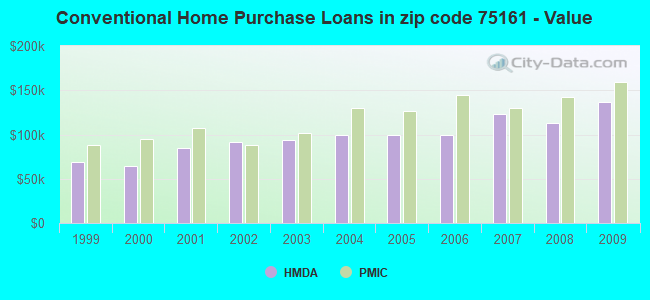
B) Conventional Home Purchase Loans
C) Refinancings
D) Home Improvement Loans
F) Non-occupant Loans on < 5 Family Dwellings (A B C & D)
G) Loans On Manufactured Home Dwelling (A B C & D)
Number
Average Value
Number
Average Value
Number
Average Value
Number
Average Value
Number
Average Value
Number
Average Value
LOANS ORIGINATED
41
$116,602
55
$136,187
109
$121,762
16
$27,058
14
$85,064
19
$70,203
APPLICATIONS APPROVED, NOT ACCEPTED
5
$93,908
2
$67,745
23
$112,157
6
$21,490
0
$0
7
$61,321
APPLICATIONS DENIED
12
$140,257
18
$73,882
105
$145,695
24
$49,345
2
$65,700
22
$72,606
APPLICATIONS WITHDRAWN
11
$94,111
8
$151,020
47
$149,491
0
$0
1
$104,860
5
$113,188
FILES CLOSED FOR INCOMPLETENESS
3
$98,243
5
$151,292
12
$101,652
1
$72,980
1
$38,540
1
$117,810
Aggregated Statistics For Year 2008 (Based on 6 partial tracts)
A) FHA, FSA/RHS & VA Home Purchase Loans
B) Conventional Home Purchase Loans
C) Refinancings
D) Home Improvement Loans
F) Non-occupant Loans on < 5 Family Dwellings (A B C & D)
G) Loans On Manufactured Home Dwelling (A B C & D)
Number
Average Value
Number
Average Value
Number
Average Value
Number
Average Value
Number
Average Value
Number
Average Value
LOANS ORIGINATED
31
$110,175
74
$112,516
100
$125,937
31
$59,594
35
$76,785
20
$61,912
APPLICATIONS APPROVED, NOT ACCEPTED
3
$88,427
14
$93,853
18
$108,293
7
$21,617
4
$44,488
10
$63,936
APPLICATIONS DENIED
8
$86,789
41
$106,617
92
$116,974
47
$27,237
18
$73,846
38
$59,717
APPLICATIONS WITHDRAWN
5
$102,190
13
$136,392
27
$155,797
5
$23,748
1
$80,210
1
$81,530
FILES CLOSED FOR INCOMPLETENESS
1
$186,640
4
$132,722
5
$172,706
2
$131,095
4
$94,260
0
$0
Aggregated Statistics For Year 2007 (Based on 6 partial tracts)
A) FHA, FSA/RHS & VA Home Purchase Loans
B) Conventional Home Purchase Loans
C) Refinancings
D) Home Improvement Loans
F) Non-occupant Loans on < 5 Family Dwellings (A B C & D)
G) Loans On Manufactured Home Dwelling (A B C & D)
Number
Average Value
Number
Average Value
Number
Average Value
Number
Average Value
Number
Average Value
Number
Average Value
LOANS ORIGINATED
39
$120,345
147
$123,623
100
$118,000
33
$42,171
39
$97,650
31
$78,066
APPLICATIONS APPROVED, NOT ACCEPTED
2
$110,325
38
$101,922
18
$108,768
11
$35,770
4
$81,338
20
$57,736
APPLICATIONS DENIED
7
$115,509
77
$98,320
163
$116,937
54
$30,723
11
$75,635
52
$75,167
APPLICATIONS WITHDRAWN
7
$108,339
23
$119,688
62
$107,279
4
$51,105
2
$92,115
16
$104,316
FILES CLOSED FOR INCOMPLETENESS
3
$115,560
9
$140,874
21
$186,804
5
$32,906
1
$44,910
3
$115,560
Aggregated Statistics For Year 2006 (Based on 6 partial tracts)
A) FHA, FSA/RHS & VA Home Purchase Loans
B) Conventional Home Purchase Loans
C) Refinancings
D) Home Improvement Loans
F) Non-occupant Loans on < 5 Family Dwellings (A B C & D)
G) Loans On Manufactured Home Dwelling (A B C & D)
Number
Average Value
Number
Average Value
Number
Average Value
Number
Average Value
Number
Average Value
Number
Average Value
LOANS ORIGINATED
57
$115,733
217
$99,631
122
$96,096
31
$50,467
46
$68,188
56
$81,346
APPLICATIONS APPROVED, NOT ACCEPTED
0
$0
40
$68,072
23
$88,284
11
$43,119
3
$84,927
24
$50,554
APPLICATIONS DENIED
4
$88,275
86
$99,944
150
$103,571
61
$53,612
13
$73,410
33
$55,822
APPLICATIONS WITHDRAWN
7
$94,496
42
$108,504
96
$108,852
11
$65,109
8
$62,102
1
$139,960
FILES CLOSED FOR INCOMPLETENESS
2
$56,535
13
$103,402
23
$104,946
0
$0
4
$51,760
0
$0
Aggregated Statistics For Year 2005 (Based on 6 partial tracts)
A) FHA, FSA/RHS & VA Home Purchase Loans
B) Conventional Home Purchase Loans
C) Refinancings
D) Home Improvement Loans
F) Non-occupant Loans on < 5 Family Dwellings (A B C & D)
G) Loans On Manufactured Home Dwelling (A B C & D)
Number
Average Value
Number
Average Value
Number
Average Value
Number
Average Value
Number
Average Value
Number
Average Value
LOANS ORIGINATED
54
$104,280
200
$99,564
185
$105,169
37
$61,719
47
$105,725
60
$76,578
APPLICATIONS APPROVED, NOT ACCEPTED
7
$69,733
30
$71,868
25
$89,638
5
$23,204
2
$55,590
17
$52,935
APPLICATIONS DENIED
9
$91,152
103
$72,768
185
$95,603
42
$57,651
24
$88,363
58
$61,686
APPLICATIONS WITHDRAWN
10
$96,976
44
$81,520
140
$108,023
23
$235,136
6
$61,503
8
$71,768
FILES CLOSED FOR INCOMPLETENESS
0
$0
6
$86,055
40
$117,818
0
$0
3
$83,420
0
$0
Aggregated Statistics For Year 2004 (Based on 6 partial tracts)
A) FHA, FSA/RHS & VA Home Purchase Loans
B) Conventional Home Purchase Loans
C) Refinancings
D) Home Improvement Loans
F) Non-occupant Loans on < 5 Family Dwellings (A B C & D)
G) Loans On Manufactured Home Dwelling (A B C & D)
Number
Average Value
Number
Average Value
Number
Average Value
Number
Average Value
Number
Average Value
Number
Average Value
LOANS ORIGINATED
68
$91,387
148
$99,777
213
$100,735
31
$43,337
29
$99,750
62
$75,084
APPLICATIONS APPROVED, NOT ACCEPTED
5
$98,166
47
$78,882
42
$105,734
5
$27,924
6
$58,283
14
$61,504
APPLICATIONS DENIED
13
$80,643
69
$85,828
184
$96,793
44
$39,813
17
$69,549
40
$63,981
APPLICATIONS WITHDRAWN
11
$104,590
24
$96,792
121
$93,786
6
$24,800
7
$80,403
12
$92,925
FILES CLOSED FOR INCOMPLETENESS
1
$53,290
10
$84,542
44
$117,873
4
$44,485
1
$41,020
1
$38,520
Aggregated Statistics For Year 2003 (Based on 6 partial tracts)
A) FHA, FSA/RHS & VA Home Purchase Loans
B) Conventional Home Purchase Loans
C) Refinancings
D) Home Improvement Loans
F) Non-occupant Loans on < 5 Family Dwellings (A B C & D)
Number
Average Value
Number
Average Value
Number
Average Value
Number
Average Value
Number
Average Value
LOANS ORIGINATED
46
$102,704
142
$94,188
359
$101,062
29
$36,982
27
$54,279
APPLICATIONS APPROVED, NOT ACCEPTED
5
$91,036
17
$85,496
55
$94,414
8
$41,849
7
$90,707
APPLICATIONS DENIED
5
$75,082
77
$74,769
225
$88,693
32
$27,780
16
$63,255
APPLICATIONS WITHDRAWN
8
$77,479
26
$80,493
125
$89,590
3
$57,997
8
$106,211
FILES CLOSED FOR INCOMPLETENESS
3
$118,670
10
$76,656
15
$103,047
1
$8,190
4
$58,085
Aggregated Statistics For Year 2002 (Based on 4 partial tracts)
A) FHA, FSA/RHS & VA Home Purchase Loans
B) Conventional Home Purchase Loans
C) Refinancings
D) Home Improvement Loans
F) Non-occupant Loans on < 5 Family Dwellings (A B C & D)
Number
Average Value
Number
Average Value
Number
Average Value
Number
Average Value
Number
Average Value
LOANS ORIGINATED
45
$92,285
92
$90,972
243
$94,330
17
$21,767
16
$88,170
APPLICATIONS APPROVED, NOT ACCEPTED
1
$82,260
26
$72,829
39
$100,154
14
$25,279
8
$55,080
APPLICATIONS DENIED
7
$78,869
57
$47,915
86
$78,400
33
$17,611
7
$49,120
APPLICATIONS WITHDRAWN
3
$43,207
12
$76,281
62
$76,415
4
$101,728
2
$107,060
FILES CLOSED FOR INCOMPLETENESS
2
$67,490
13
$109,156
20
$76,064
0
$0
3
$123,720
Aggregated Statistics For Year 2001 (Based on 4 partial tracts)
A) FHA, FSA/RHS & VA Home Purchase Loans
B) Conventional Home Purchase Loans
C) Refinancings
D) Home Improvement Loans
F) Non-occupant Loans on < 5 Family Dwellings (A B C & D)
Number
Average Value
Number
Average Value
Number
Average Value
Number
Average Value
Number
Average Value
LOANS ORIGINATED
36
$90,949
175
$84,239
151
$94,124
30
$14,516
14
$43,861
APPLICATIONS APPROVED, NOT ACCEPTED
1
$98,650
36
$64,190
32
$85,586
5
$38,966
8
$60,065
APPLICATIONS DENIED
5
$58,808
132
$51,305
101
$84,874
24
$21,145
12
$36,654
APPLICATIONS WITHDRAWN
4
$89,315
19
$77,909
50
$78,910
3
$54,317
4
$54,548
FILES CLOSED FOR INCOMPLETENESS
0
$0
3
$82,643
10
$108,067
0
$0
0
$0
Aggregated Statistics For Year 2000 (Based on 4 partial tracts)
A) FHA, FSA/RHS & VA Home Purchase Loans
B) Conventional Home Purchase Loans
C) Refinancings
D) Home Improvement Loans
E) Loans on Dwellings For 5+ Families
F) Non-occupant Loans on < 5 Family Dwellings (A B C & D)
Number
Average Value
Number
Average Value
Number
Average Value
Number
Average Value
Number
Average Value
Number
Average Value
LOANS ORIGINATED
20
$83,451
171
$64,536
75
$68,993
33
$18,650
1
$94,060
16
$37,463
APPLICATIONS APPROVED, NOT ACCEPTED
4
$51,162
52
$68,088
27
$89,412
11
$14,650
0
$0
9
$36,947
APPLICATIONS DENIED
5
$72,508
146
$51,094
50
$65,499
21
$10,671
0
$0
9
$34,797
APPLICATIONS WITHDRAWN
5
$67,078
5
$76,510
34
$59,145
8
$32,930
0
$0
4
$35,612
FILES CLOSED FOR INCOMPLETENESS
0
$0
7
$59,461
17
$86,977
0
$0
0
$0
0
$0
Aggregated Statistics For Year 1999 (Based on 3 partial tracts)
A) FHA, FSA/RHS & VA Home Purchase Loans
B) Conventional Home Purchase Loans
C) Refinancings
D) Home Improvement Loans
F) Non-occupant Loans on < 5 Family Dwellings (A B C & D)
2002 - 2018 National Fire Incident Reporting System (NFIRS) incidents
According to the data from the years 2002 - 2018 the average number of fire incidents per year is 34. The highest number of reported fire incidents - 107 took place in 2003, and the least - 10 in 2002. The data has a rising trend.
When looking into fire subcategories, the most reports belonged to: Outside Fires (60.4%), and Structure Fires (25.4%).
Fire incident types reported to NFIRS in Zip Code 75161
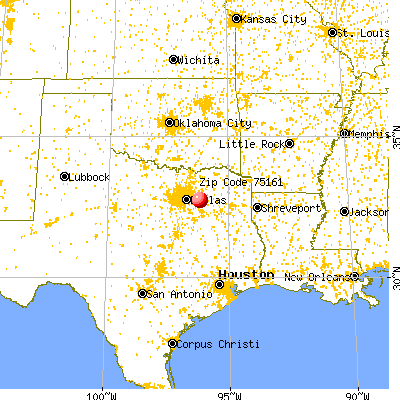


 Nearest zip codes: 75160, 75169, 75142, 75474, 75189, 75126.


 According to the data from the years 2002 - 2018 the average number of fire incidents per year is 34. The highest number of reported fire incidents - 107 took place in 2003, and the least - 10 in 2002. The data has a rising trend.
 When looking into fire subcategories, the most reports belonged to: Outside Fires (60.4%), and Structure Fires (25.4%).