Estimated zip code population in 2022: 27,777
Zip code population in 2010: 23,031
Zip code population in 2000: 19,335
Houses and condos: 9,137
Renter-occupied apartments: 3,303
% of renters here:
39%State:
38%
March 2022 cost of living index in zip code 75180: 94.2
(less than average, U.S. average is 100)
Land area: 7.7
sq. mi.
Water area: 0.0
sq. mi.
Population density: 3,627 people per square mile (average).
OSM Map
General Map
Google Map
MSN Map
OSM Map
General Map
Google Map
MSN Map
OSM Map
General Map
Google Map
MSN Map
OSM Map
General Map
Google Map
MSN Map
Please wait while loading the map...
Real estate property taxes paid for housing units in 2022:
This zip code:
1.2% ($2,604)Texas:
1.5% ($4,050)
Median real estate property taxes paid for housing units with mortgages in 2022: $2,839 (1.4%)
Median real estate property taxes paid for housing units with no mortgage in 2022: $2,460 (1.1%)
Profiles of local businesses
Business Search - 14 Million verified businesses
Males: 13,658 Females: 14,118
For population 25 years and over in 75180:
High school or higher: 69.6%Bachelor's degree or higher: 8.5%Graduate or professional degree: 2.3%Unemployed: 7.4%Mean travel time to work (commute): 37.3 minutes
For population 15 years and over in 75180:
Never married: 39.3%Now married: 44.8%Separated: 1.8%Widowed: 4.8%Divorced: 9.4%
Zip code 75180 compared to state average:
Black race population percentage above state average. Length of stay since moving in significantly above state average. Percentage of population with a bachelor's degree or higher significantly below state average. 15,077 54.3% Hispanic or Latino 7,853 28.3% Black 4,667 16.8% White 129 0.5% Two or more races 32 0.1% American Indian 16 0.06% Asian
Data:
Median household income ($)
Median household income (% change since 2000)
Household income diversity
Ratio of average income to average house value (%)
Ratio of average income to average rent
Median household income ($) - White
Median household income ($) - Black or African American
Median household income ($) - Asian
Median household income ($) - Hispanic or Latino
Median household income ($) - American Indian and Alaska Native
Median household income ($) - Multirace
Median household income ($) - Other Race
Median household income for houses/condos with a mortgage ($)
Median household income for apartments without a mortgage ($)
Races - White alone (%)
Races - White alone (% change since 2000)
Races - Black alone (%)
Races - Black alone (% change since 2000)
Races - American Indian alone (%)
Races - American Indian alone (% change since 2000)
Races - Asian alone (%)
Races - Asian alone (% change since 2000)
Races - Hispanic (%)
Races - Hispanic (% change since 2000)
Races - Native Hawaiian and Other Pacific Islander alone (%)
Races - Native Hawaiian and Other Pacific Islander alone (% change since 2000)
Races - Two or more races (%)
Races - Two or more races (% change since 2000)
Races - Other race alone (%)
Races - Other race alone (% change since 2000)
Racial diversity
Unemployment (%)
Unemployment (% change since 2000)
Unemployment (%) - White
Unemployment (%) - Black or African American
Unemployment (%) - Asian
Unemployment (%) - Hispanic or Latino
Unemployment (%) - American Indian and Alaska Native
Unemployment (%) - Multirace
Unemployment (%) - Other Race
Population density (people per square mile)
Population - Males (%)
Population - Females (%)
Population - Males (%) - White
Population - Males (%) - Black or African American
Population - Males (%) - Asian
Population - Males (%) - Hispanic or Latino
Population - Males (%) - American Indian and Alaska Native
Population - Males (%) - Multirace
Population - Males (%) - Other Race
Population - Females (%) - White
Population - Females (%) - Black or African American
Population - Females (%) - Asian
Population - Females (%) - Hispanic or Latino
Population - Females (%) - American Indian and Alaska Native
Population - Females (%) - Multirace
Population - Females (%) - Other Race
Coronavirus confirmed cases (Apr 23, 2024)
Deaths caused by coronavirus (Apr 23, 2024)
Coronavirus confirmed cases (per 100k population) (Apr 23, 2024)
Deaths caused by coronavirus (per 100k population) (Apr 23, 2024)
Daily increase in number of cases (Apr 23, 2024)
Weekly increase in number of cases (Apr 23, 2024)
Cases doubled (in days) (Apr 23, 2024)
Hospitalized patients (Apr 18, 2022)
Negative test results (Apr 18, 2022)
Total test results (Apr 18, 2022)
COVID Vaccine doses distributed (per 100k population) (Sep 19, 2023)
COVID Vaccine doses administered (per 100k population) (Sep 19, 2023)
COVID Vaccine doses distributed (Sep 19, 2023)
COVID Vaccine doses administered (Sep 19, 2023)
Likely homosexual households (%)
Likely homosexual households (% change since 2000)
Likely homosexual households - Lesbian couples (%)
Likely homosexual households - Lesbian couples (% change since 2000)
Likely homosexual households - Gay men (%)
Likely homosexual households - Gay men (% change since 2000)
Cost of living index
Median gross rent ($)
Median contract rent ($)
Median monthly housing costs ($)
Median house or condo value ($)
Median house or condo value ($ change since 2000)
Mean house or condo value by units in structure - 1, detached ($)
Mean house or condo value by units in structure - 1, attached ($)
Mean house or condo value by units in structure - 2 ($)
Mean house or condo value by units in structure by units in structure - 3 or 4 ($)
Mean house or condo value by units in structure - 5 or more ($)
Mean house or condo value by units in structure - Boat, RV, van, etc. ($)
Mean house or condo value by units in structure - Mobile home ($)
Median house or condo value ($) - White
Median house or condo value ($) - Black or African American
Median house or condo value ($) - Asian
Median house or condo value ($) - Hispanic or Latino
Median house or condo value ($) - American Indian and Alaska Native
Median house or condo value ($) - Multirace
Median house or condo value ($) - Other Race
Median resident age
Resident age diversity
Median resident age - Males
Median resident age - Females
Median resident age - White
Median resident age - Black or African American
Median resident age - Asian
Median resident age - Hispanic or Latino
Median resident age - American Indian and Alaska Native
Median resident age - Multirace
Median resident age - Other Race
Median resident age - Males - White
Median resident age - Males - Black or African American
Median resident age - Males - Asian
Median resident age - Males - Hispanic or Latino
Median resident age - Males - American Indian and Alaska Native
Median resident age - Males - Multirace
Median resident age - Males - Other Race
Median resident age - Females - White
Median resident age - Females - Black or African American
Median resident age - Females - Asian
Median resident age - Females - Hispanic or Latino
Median resident age - Females - American Indian and Alaska Native
Median resident age - Females - Multirace
Median resident age - Females - Other Race
Commute - mean travel time to work (minutes)
Travel time to work - Less than 5 minutes (%)
Travel time to work - Less than 5 minutes (% change since 2000)
Travel time to work - 5 to 9 minutes (%)
Travel time to work - 5 to 9 minutes (% change since 2000)
Travel time to work - 10 to 19 minutes (%)
Travel time to work - 10 to 19 minutes (% change since 2000)
Travel time to work - 20 to 29 minutes (%)
Travel time to work - 20 to 29 minutes (% change since 2000)
Travel time to work - 30 to 39 minutes (%)
Travel time to work - 30 to 39 minutes (% change since 2000)
Travel time to work - 40 to 59 minutes (%)
Travel time to work - 40 to 59 minutes (% change since 2000)
Travel time to work - 60 to 89 minutes (%)
Travel time to work - 60 to 89 minutes (% change since 2000)
Travel time to work - 90 or more minutes (%)
Travel time to work - 90 or more minutes (% change since 2000)
Marital status - Never married (%)
Marital status - Now married (%)
Marital status - Separated (%)
Marital status - Widowed (%)
Marital status - Divorced (%)
Median family income ($)
Median family income (% change since 2000)
Median non-family income ($)
Median non-family income (% change since 2000)
Median per capita income ($)
Median per capita income (% change since 2000)
Median family income ($) - White
Median family income ($) - Black or African American
Median family income ($) - Asian
Median family income ($) - Hispanic or Latino
Median family income ($) - American Indian and Alaska Native
Median family income ($) - Multirace
Median family income ($) - Other Race
Median year house/condo built
Median year apartment built
Year house built - Built 2005 or later (%)
Year house built - Built 2000 to 2004 (%)
Year house built - Built 1990 to 1999 (%)
Year house built - Built 1980 to 1989 (%)
Year house built - Built 1970 to 1979 (%)
Year house built - Built 1960 to 1969 (%)
Year house built - Built 1950 to 1959 (%)
Year house built - Built 1940 to 1949 (%)
Year house built - Built 1939 or earlier (%)
Average household size
Household density (households per square mile)
Average household size - White
Average household size - Black or African American
Average household size - Asian
Average household size - Hispanic or Latino
Average household size - American Indian and Alaska Native
Average household size - Multirace
Average household size - Other Race
Occupied housing units (%)
Vacant housing units (%)
Owner occupied housing units (%)
Renter occupied housing units (%)
Vacancy status - For rent (%)
Vacancy status - For sale only (%)
Vacancy status - Rented or sold, not occupied (%)
Vacancy status - For seasonal, recreational, or occasional use (%)
Vacancy status - For migrant workers (%)
Vacancy status - Other vacant (%)
Residents with income below the poverty level (%)
Residents with income below 50% of the poverty level (%)
Children below poverty level (%)
Poor families by family type - Married-couple family (%)
Poor families by family type - Male, no wife present (%)
Poor families by family type - Female, no husband present (%)
Poverty status for native-born residents (%)
Poverty status for foreign-born residents (%)
Poverty among high school graduates not in families (%)
Poverty among people who did not graduate high school not in families (%)
Residents with income below the poverty level (%) - White
Residents with income below the poverty level (%) - Black or African American
Residents with income below the poverty level (%) - Asian
Residents with income below the poverty level (%) - Hispanic or Latino
Residents with income below the poverty level (%) - American Indian and Alaska Native
Residents with income below the poverty level (%) - Multirace
Residents with income below the poverty level (%) - Other Race
Air pollution - Air Quality Index (AQI)
Air pollution - CO
Air pollution - NO2
Air pollution - SO2
Air pollution - Ozone
Air pollution - PM10
Air pollution - PM25
Air pollution - Pb
Crime - Murders per 100,000 population
Crime - Rapes per 100,000 population
Crime - Robberies per 100,000 population
Crime - Assaults per 100,000 population
Crime - Burglaries per 100,000 population
Crime - Thefts per 100,000 population
Crime - Auto thefts per 100,000 population
Crime - Arson per 100,000 population
Crime - City-data.com crime index
Crime - Violent crime index
Crime - Property crime index
Crime - Murders per 100,000 population (5 year average)
Crime - Rapes per 100,000 population (5 year average)
Crime - Robberies per 100,000 population (5 year average)
Crime - Assaults per 100,000 population (5 year average)
Crime - Burglaries per 100,000 population (5 year average)
Crime - Thefts per 100,000 population (5 year average)
Crime - Auto thefts per 100,000 population (5 year average)
Crime - Arson per 100,000 population (5 year average)
Crime - City-data.com crime index (5 year average)
Crime - Violent crime index (5 year average)
Crime - Property crime index (5 year average)
1996 Presidential Elections Results (%) - Democratic Party (Clinton)
1996 Presidential Elections Results (%) - Republican Party (Dole)
1996 Presidential Elections Results (%) - Other
2000 Presidential Elections Results (%) - Democratic Party (Gore)
2000 Presidential Elections Results (%) - Republican Party (Bush)
2000 Presidential Elections Results (%) - Other
2004 Presidential Elections Results (%) - Democratic Party (Kerry)
2004 Presidential Elections Results (%) - Republican Party (Bush)
2004 Presidential Elections Results (%) - Other
2008 Presidential Elections Results (%) - Democratic Party (Obama)
2008 Presidential Elections Results (%) - Republican Party (McCain)
2008 Presidential Elections Results (%) - Other
2012 Presidential Elections Results (%) - Democratic Party (Obama)
2012 Presidential Elections Results (%) - Republican Party (Romney)
2012 Presidential Elections Results (%) - Other
2016 Presidential Elections Results (%) - Democratic Party (Clinton)
2016 Presidential Elections Results (%) - Republican Party (Trump)
2016 Presidential Elections Results (%) - Other
2020 Presidential Elections Results (%) - Democratic Party (Biden)
2020 Presidential Elections Results (%) - Republican Party (Trump)
2020 Presidential Elections Results (%) - Other
Ancestries Reported - Arab (%)
Ancestries Reported - Czech (%)
Ancestries Reported - Danish (%)
Ancestries Reported - Dutch (%)
Ancestries Reported - English (%)
Ancestries Reported - French (%)
Ancestries Reported - French Canadian (%)
Ancestries Reported - German (%)
Ancestries Reported - Greek (%)
Ancestries Reported - Hungarian (%)
Ancestries Reported - Irish (%)
Ancestries Reported - Italian (%)
Ancestries Reported - Lithuanian (%)
Ancestries Reported - Norwegian (%)
Ancestries Reported - Polish (%)
Ancestries Reported - Portuguese (%)
Ancestries Reported - Russian (%)
Ancestries Reported - Scotch-Irish (%)
Ancestries Reported - Scottish (%)
Ancestries Reported - Slovak (%)
Ancestries Reported - Subsaharan African (%)
Ancestries Reported - Swedish (%)
Ancestries Reported - Swiss (%)
Ancestries Reported - Ukrainian (%)
Ancestries Reported - United States (%)
Ancestries Reported - Welsh (%)
Ancestries Reported - West Indian (%)
Ancestries Reported - Other (%)
Educational Attainment - No schooling completed (%)
Educational Attainment - Less than high school (%)
Educational Attainment - High school or equivalent (%)
Educational Attainment - Less than 1 year of college (%)
Educational Attainment - 1 or more years of college (%)
Educational Attainment - Associate degree (%)
Educational Attainment - Bachelor's degree (%)
Educational Attainment - Master's degree (%)
Educational Attainment - Professional school degree (%)
Educational Attainment - Doctorate degree (%)
School Enrollment - Nursery, preschool (%)
School Enrollment - Kindergarten (%)
School Enrollment - Grade 1 to 4 (%)
School Enrollment - Grade 5 to 8 (%)
School Enrollment - Grade 9 to 12 (%)
School Enrollment - College undergrad (%)
School Enrollment - Graduate or professional (%)
School Enrollment - Not enrolled in school (%)
School enrollment - Public schools (%)
School enrollment - Private schools (%)
School enrollment - Not enrolled (%)
Median number of rooms in houses and condos
Median number of rooms in apartments
Housing units lacking complete plumbing facilities (%)
Housing units lacking complete kitchen facilities (%)
Density of houses
Urban houses (%)
Rural houses (%)
Households with people 60 years and over (%)
Households with people 65 years and over (%)
Households with people 75 years and over (%)
Households with one or more nonrelatives (%)
Households with no nonrelatives (%)
Population in households (%)
Family households (%)
Nonfamily households (%)
Population in families (%)
Family households with own children (%)
Median number of bedrooms in owner occupied houses
Mean number of bedrooms in owner occupied houses
Median number of bedrooms in renter occupied houses
Mean number of bedrooms in renter occupied houses
Median number of vehichles in owner occupied houses
Mean number of vehichles in owner occupied houses
Median number of vehichles in renter occupied houses
Mean number of vehichles in renter occupied houses
Mortgage status - with mortgage (%)
Mortgage status - with second mortgage (%)
Mortgage status - with home equity loan (%)
Mortgage status - with both second mortgage and home equity loan (%)
Mortgage status - without a mortgage (%)
Average family size
Average family size - White
Average family size - Black or African American
Average family size - Asian
Average family size - Hispanic or Latino
Average family size - American Indian and Alaska Native
Average family size - Multirace
Average family size - Other Race
Geographical mobility - Same house 1 year ago (%)
Geographical mobility - Moved within same county (%)
Geographical mobility - Moved from different county within same state (%)
Geographical mobility - Moved from different state (%)
Geographical mobility - Moved from abroad (%)
Place of birth - Born in state of residence (%)
Place of birth - Born in other state (%)
Place of birth - Native, outside of US (%)
Place of birth - Foreign born (%)
Housing units in structures - 1, detached (%)
Housing units in structures - 1, attached (%)
Housing units in structures - 2 (%)
Housing units in structures - 3 or 4 (%)
Housing units in structures - 5 to 9 (%)
Housing units in structures - 10 to 19 (%)
Housing units in structures - 20 to 49 (%)
Housing units in structures - 50 or more (%)
Housing units in structures - Mobile home (%)
Housing units in structures - Boat, RV, van, etc. (%)
House/condo owner moved in on average (years ago)
Renter moved in on average (years ago)
Year householder moved into unit - Moved in 1999 to March 2000 (%)
Year householder moved into unit - Moved in 1995 to 1998 (%)
Year householder moved into unit - Moved in 1990 to 1994 (%)
Year householder moved into unit - Moved in 1980 to 1989 (%)
Year householder moved into unit - Moved in 1970 to 1979 (%)
Year householder moved into unit - Moved in 1969 or earlier (%)
Means of transportation to work - Drove car alone (%)
Means of transportation to work - Carpooled (%)
Means of transportation to work - Public transportation (%)
Means of transportation to work - Bus or trolley bus (%)
Means of transportation to work - Streetcar or trolley car (%)
Means of transportation to work - Subway or elevated (%)
Means of transportation to work - Railroad (%)
Means of transportation to work - Ferryboat (%)
Means of transportation to work - Taxicab (%)
Means of transportation to work - Motorcycle (%)
Means of transportation to work - Bicycle (%)
Means of transportation to work - Walked (%)
Means of transportation to work - Other means (%)
Working at home (%)
Industry diversity
Most Common Industries - Agriculture, forestry, fishing and hunting, and mining (%)
Most Common Industries - Agriculture, forestry, fishing and hunting (%)
Most Common Industries - Mining, quarrying, and oil and gas extraction (%)
Most Common Industries - Construction (%)
Most Common Industries - Manufacturing (%)
Most Common Industries - Wholesale trade (%)
Most Common Industries - Retail trade (%)
Most Common Industries - Transportation and warehousing, and utilities (%)
Most Common Industries - Transportation and warehousing (%)
Most Common Industries - Utilities (%)
Most Common Industries - Information (%)
Most Common Industries - Finance and insurance, and real estate and rental and leasing (%)
Most Common Industries - Finance and insurance (%)
Most Common Industries - Real estate and rental and leasing (%)
Most Common Industries - Professional, scientific, and management, and administrative and waste management services (%)
Most Common Industries - Professional, scientific, and technical services (%)
Most Common Industries - Management of companies and enterprises (%)
Most Common Industries - Administrative and support and waste management services (%)
Most Common Industries - Educational services, and health care and social assistance (%)
Most Common Industries - Educational services (%)
Most Common Industries - Health care and social assistance (%)
Most Common Industries - Arts, entertainment, and recreation, and accommodation and food services (%)
Most Common Industries - Arts, entertainment, and recreation (%)
Most Common Industries - Accommodation and food services (%)
Most Common Industries - Other services, except public administration (%)
Most Common Industries - Public administration (%)
Occupation diversity
Most Common Occupations - Management, business, science, and arts occupations (%)
Most Common Occupations - Management, business, and financial occupations (%)
Most Common Occupations - Management occupations (%)
Most Common Occupations - Business and financial operations occupations (%)
Most Common Occupations - Computer, engineering, and science occupations (%)
Most Common Occupations - Computer and mathematical occupations (%)
Most Common Occupations - Architecture and engineering occupations (%)
Most Common Occupations - Life, physical, and social science occupations (%)
Most Common Occupations - Education, legal, community service, arts, and media occupations (%)
Most Common Occupations - Community and social service occupations (%)
Most Common Occupations - Legal occupations (%)
Most Common Occupations - Education, training, and library occupations (%)
Most Common Occupations - Arts, design, entertainment, sports, and media occupations (%)
Most Common Occupations - Healthcare practitioners and technical occupations (%)
Most Common Occupations - Health diagnosing and treating practitioners and other technical occupations (%)
Most Common Occupations - Health technologists and technicians (%)
Most Common Occupations - Service occupations (%)
Most Common Occupations - Healthcare support occupations (%)
Most Common Occupations - Protective service occupations (%)
Most Common Occupations - Fire fighting and prevention, and other protective service workers including supervisors (%)
Most Common Occupations - Law enforcement workers including supervisors (%)
Most Common Occupations - Food preparation and serving related occupations (%)
Most Common Occupations - Building and grounds cleaning and maintenance occupations (%)
Most Common Occupations - Personal care and service occupations (%)
Most Common Occupations - Sales and office occupations (%)
Most Common Occupations - Sales and related occupations (%)
Most Common Occupations - Office and administrative support occupations (%)
Most Common Occupations - Natural resources, construction, and maintenance occupations (%)
Most Common Occupations - Farming, fishing, and forestry occupations (%)
Most Common Occupations - Construction and extraction occupations (%)
Most Common Occupations - Installation, maintenance, and repair occupations (%)
Most Common Occupations - Production, transportation, and material moving occupations (%)
Most Common Occupations - Production occupations (%)
Most Common Occupations - Transportation occupations (%)
Most Common Occupations - Material moving occupations (%)
People in Group quarters - Institutionalized population (%)
People in Group quarters - Correctional institutions (%)
People in Group quarters - Federal prisons and detention centers (%)
People in Group quarters - Halfway houses (%)
People in Group quarters - Local jails and other confinement facilities (including police lockups) (%)
People in Group quarters - Military disciplinary barracks (%)
People in Group quarters - State prisons (%)
People in Group quarters - Other types of correctional institutions (%)
People in Group quarters - Nursing homes (%)
People in Group quarters - Hospitals/wards, hospices, and schools for the handicapped (%)
People in Group quarters - Hospitals/wards and hospices for chronically ill (%)
People in Group quarters - Hospices or homes for chronically ill (%)
People in Group quarters - Military hospitals or wards for chronically ill (%)
People in Group quarters - Other hospitals or wards for chronically ill (%)
People in Group quarters - Hospitals or wards for drug/alcohol abuse (%)
People in Group quarters - Mental (Psychiatric) hospitals or wards (%)
People in Group quarters - Schools, hospitals, or wards for the mentally retarded (%)
People in Group quarters - Schools, hospitals, or wards for the physically handicapped (%)
People in Group quarters - Institutions for the deaf (%)
People in Group quarters - Institutions for the blind (%)
People in Group quarters - Orthopedic wards and institutions for the physically handicapped (%)
People in Group quarters - Wards in general hospitals for patients who have no usual home elsewhere (%)
People in Group quarters - Wards in military hospitals for patients who have no usual home elsewhere (%)
People in Group quarters - Juvenile institutions (%)
People in Group quarters - Long-term care (%)
People in Group quarters - Homes for abused, dependent, and neglected children (%)
People in Group quarters - Residential treatment centers for emotionally disturbed children (%)
People in Group quarters - Training schools for juvenile delinquents (%)
People in Group quarters - Short-term care, detention or diagnostic centers for delinquent children (%)
People in Group quarters - Type of juvenile institution unknown (%)
People in Group quarters - Noninstitutionalized population (%)
People in Group quarters - College dormitories (includes college quarters off campus) (%)
People in Group quarters - Military quarters (%)
People in Group quarters - On base (%)
People in Group quarters - Barracks, unaccompanied personnel housing (UPH), (Enlisted/Officer), ;and similar group living quarters for military personnel (%)
People in Group quarters - Transient quarters for temporary residents (%)
People in Group quarters - Military ships (%)
People in Group quarters - Group homes (%)
People in Group quarters - Homes or halfway houses for drug/alcohol abuse (%)
People in Group quarters - Homes for the mentally ill (%)
People in Group quarters - Homes for the mentally retarded (%)
People in Group quarters - Homes for the physically handicapped (%)
People in Group quarters - Other group homes (%)
People in Group quarters - Religious group quarters (%)
People in Group quarters - Dormitories (%)
People in Group quarters - Agriculture workers' dormitories on farms (%)
People in Group quarters - Job Corps and vocational training facilities (%)
People in Group quarters - Other workers' dormitories (%)
People in Group quarters - Crews of maritime vessels (%)
People in Group quarters - Other nonhousehold living situations (%)
People in Group quarters - Other noninstitutional group quarters (%)
Residents speaking English at home (%)
Residents speaking English at home - Born in the United States (%)
Residents speaking English at home - Native, born elsewhere (%)
Residents speaking English at home - Foreign born (%)
Residents speaking Spanish at home (%)
Residents speaking Spanish at home - Born in the United States (%)
Residents speaking Spanish at home - Native, born elsewhere (%)
Residents speaking Spanish at home - Foreign born (%)
Residents speaking other language at home (%)
Residents speaking other language at home - Born in the United States (%)
Residents speaking other language at home - Native, born elsewhere (%)
Residents speaking other language at home - Foreign born (%)
Class of Workers - Employee of private company (%)
Class of Workers - Self-employed in own incorporated business (%)
Class of Workers - Private not-for-profit wage and salary workers (%)
Class of Workers - Local government workers (%)
Class of Workers - State government workers (%)
Class of Workers - Federal government workers (%)
Class of Workers - Self-employed workers in own not incorporated business and Unpaid family workers (%)
House heating fuel used in houses and condos - Utility gas (%)
House heating fuel used in houses and condos - Bottled, tank, or LP gas (%)
House heating fuel used in houses and condos - Electricity (%)
House heating fuel used in houses and condos - Fuel oil, kerosene, etc. (%)
House heating fuel used in houses and condos - Coal or coke (%)
House heating fuel used in houses and condos - Wood (%)
House heating fuel used in houses and condos - Solar energy (%)
House heating fuel used in houses and condos - Other fuel (%)
House heating fuel used in houses and condos - No fuel used (%)
House heating fuel used in apartments - Utility gas (%)
House heating fuel used in apartments - Bottled, tank, or LP gas (%)
House heating fuel used in apartments - Electricity (%)
House heating fuel used in apartments - Fuel oil, kerosene, etc. (%)
House heating fuel used in apartments - Coal or coke (%)
House heating fuel used in apartments - Wood (%)
House heating fuel used in apartments - Solar energy (%)
House heating fuel used in apartments - Other fuel (%)
House heating fuel used in apartments - No fuel used (%)
Armed forces status - In Armed Forces (%)
Armed forces status - Civilian (%)
Armed forces status - Civilian - Veteran (%)
Armed forces status - Civilian - Nonveteran (%)
Fatal accidents locations in years 2005-2021
Fatal accidents locations in 2005
Fatal accidents locations in 2006
Fatal accidents locations in 2007
Fatal accidents locations in 2008
Fatal accidents locations in 2009
Fatal accidents locations in 2010
Fatal accidents locations in 2011
Fatal accidents locations in 2012
Fatal accidents locations in 2013
Fatal accidents locations in 2014
Fatal accidents locations in 2015
Fatal accidents locations in 2016
Fatal accidents locations in 2017
Fatal accidents locations in 2018
Fatal accidents locations in 2019
Fatal accidents locations in 2020
Fatal accidents locations in 2021
Alcohol use - People drinking some alcohol every month (%)
Alcohol use - People not drinking at all (%)
Alcohol use - Average days/month drinking alcohol
Alcohol use - Average drinks/week
Alcohol use - Average days/year people drink much
Audiometry - Average condition of hearing (%)
Audiometry - People that can hear a whisper from across a quiet room (%)
Audiometry - People that can hear normal voice from across a quiet room (%)
Audiometry - Ears ringing, roaring, buzzing (%)
Audiometry - Had a job exposure to loud noise (%)
Audiometry - Had off-work exposure to loud noise (%)
Blood Pressure & Cholesterol - Has high blood pressure (%)
Blood Pressure & Cholesterol - Checking blood pressure at home (%)
Blood Pressure & Cholesterol - Frequently checking blood cholesterol (%)
Blood Pressure & Cholesterol - Has high cholesterol level (%)
Consumer Behavior - Money monthly spent on food at supermarket/grocery store
Consumer Behavior - Money monthly spent on food at other stores
Consumer Behavior - Money monthly spent on eating out
Consumer Behavior - Money monthly spent on carryout/delivered foods
Consumer Behavior - Income spent on food at supermarket/grocery store (%)
Consumer Behavior - Income spent on food at other stores (%)
Consumer Behavior - Income spent on eating out (%)
Consumer Behavior - Income spent on carryout/delivered foods (%)
Current Health Status - General health condition (%)
Current Health Status - Blood donors (%)
Current Health Status - Has blood ever tested for HIV virus (%)
Current Health Status - Left-handed people (%)
Dermatology - People using sunscreen (%)
Diabetes - Diabetics (%)
Diabetes - Had a blood test for high blood sugar (%)
Diabetes - People taking insulin (%)
Diet Behavior & Nutrition - Diet health (%)
Diet Behavior & Nutrition - Milk product consumption (# of products/month)
Diet Behavior & Nutrition - Meals not home prepared (#/week)
Diet Behavior & Nutrition - Meals from fast food or pizza place (#/week)
Diet Behavior & Nutrition - Ready-to-eat foods (#/month)
Diet Behavior & Nutrition - Frozen meals/pizza (#/month)
Drug Use - People that ever used marijuana or hashish (%)
Drug Use - Ever used hard drugs (%)
Drug Use - Ever used any form of cocaine (%)
Drug Use - Ever used heroin (%)
Drug Use - Ever used methamphetamine (%)
Health Insurance - People covered by health insurance (%)
Kidney Conditions-Urology - Avg. # of times urinating at night
Medical Conditions - People with asthma (%)
Medical Conditions - People with anemia (%)
Medical Conditions - People with psoriasis (%)
Medical Conditions - People with overweight (%)
Medical Conditions - Elderly people having difficulties in thinking or remembering (%)
Medical Conditions - People who ever received blood transfusion (%)
Medical Conditions - People having trouble seeing even with glass/contacts (%)
Medical Conditions - People with arthritis (%)
Medical Conditions - People with gout (%)
Medical Conditions - People with congestive heart failure (%)
Medical Conditions - People with coronary heart disease (%)
Medical Conditions - People with angina pectoris (%)
Medical Conditions - People who ever had heart attack (%)
Medical Conditions - People who ever had stroke (%)
Medical Conditions - People with emphysema (%)
Medical Conditions - People with thyroid problem (%)
Medical Conditions - People with chronic bronchitis (%)
Medical Conditions - People with any liver condition (%)
Medical Conditions - People who ever had cancer or malignancy (%)
Mental Health - People who have little interest in doing things (%)
Mental Health - People feeling down, depressed, or hopeless (%)
Mental Health - People who have trouble sleeping or sleeping too much (%)
Mental Health - People feeling tired or having little energy (%)
Mental Health - People with poor appetite or overeating (%)
Mental Health - People feeling bad about themself (%)
Mental Health - People who have trouble concentrating on things (%)
Mental Health - People moving or speaking slowly or too fast (%)
Mental Health - People having thoughts they would be better off dead (%)
Oral Health - Average years since last visit a dentist
Oral Health - People embarrassed because of mouth (%)
Oral Health - People with gum disease (%)
Oral Health - General health of teeth and gums (%)
Oral Health - Average days a week using dental floss/device
Oral Health - Average days a week using mouthwash for dental problem
Oral Health - Average number of teeth
Pesticide Use - Households using pesticides to control insects (%)
Pesticide Use - Households using pesticides to kill weeds (%)
Physical Activity - People doing vigorous-intensity work activities (%)
Physical Activity - People doing moderate-intensity work activities (%)
Physical Activity - People walking or bicycling (%)
Physical Activity - People doing vigorous-intensity recreational activities (%)
Physical Activity - People doing moderate-intensity recreational activities (%)
Physical Activity - Average hours a day doing sedentary activities
Physical Activity - Average hours a day watching TV or videos
Physical Activity - Average hours a day using computer
Physical Functioning - People having limitations keeping them from working (%)
Physical Functioning - People limited in amount of work they can do (%)
Physical Functioning - People that need special equipment to walk (%)
Physical Functioning - People experiencing confusion/memory problems (%)
Physical Functioning - People requiring special healthcare equipment (%)
Prescription Medications - Average number of prescription medicines taking
Preventive Aspirin Use - Adults 40+ taking low-dose aspirin (%)
Reproductive Health - Vaginal deliveries (%)
Reproductive Health - Cesarean deliveries (%)
Reproductive Health - Deliveries resulted in a live birth (%)
Reproductive Health - Pregnancies resulted in a delivery (%)
Reproductive Health - Women breastfeeding newborns (%)
Reproductive Health - Women that had a hysterectomy (%)
Reproductive Health - Women that had both ovaries removed (%)
Reproductive Health - Women that have ever taken birth control pills (%)
Reproductive Health - Women taking birth control pills (%)
Reproductive Health - Women that have ever used Depo-Provera or injectables (%)
Reproductive Health - Women that have ever used female hormones (%)
Sexual Behavior - People 18+ that ever had sex (vaginal, anal, or oral) (%)
Sexual Behavior - Males 18+ that ever had vaginal sex with a woman (%)
Sexual Behavior - Males 18+ that ever performed oral sex on a woman (%)
Sexual Behavior - Males 18+ that ever had anal sex with a woman (%)
Sexual Behavior - Males 18+ that ever had any sex with a man (%)
Sexual Behavior - Females 18+ that ever had vaginal sex with a man (%)
Sexual Behavior - Females 18+ that ever performed oral sex on a man (%)
Sexual Behavior - Females 18+ that ever had anal sex with a man (%)
Sexual Behavior - Females 18+ that ever had any kind of sex with a woman (%)
Sexual Behavior - Average age people first had sex
Sexual Behavior - Average number of female sex partners in lifetime (males 18+)
Sexual Behavior - Average number of female vaginal sex partners in lifetime (males 18+)
Sexual Behavior - Average age people first performed oral sex on a woman (18+)
Sexual Behavior - Average number of woman performed oral sex on in lifetime (18+)
Sexual Behavior - Average number of male sex partners in lifetime (males 18+)
Sexual Behavior - Average number of male anal sex partners in lifetime (males 18+)
Sexual Behavior - Average age people first performed oral sex on a man (18+)
Sexual Behavior - Average number of male oral sex partners in lifetime (18+)
Sexual Behavior - People using protection when performing oral sex (%)
Sexual Behavior - Average number of times people have vaginal or anal sex a year
Sexual Behavior - People having sex without condom (%)
Sexual Behavior - Average number of male sex partners in lifetime (females 18+)
Sexual Behavior - Average number of male vaginal sex partners in lifetime (females 18+)
Sexual Behavior - Average number of female sex partners in lifetime (females 18+)
Sexual Behavior - Circumcised males 18+ (%)
Sleep Disorders - Average hours sleeping at night
Sleep Disorders - People that has trouble sleeping (%)
Smoking-Cigarette Use - People smoking cigarettes (%)
Taste & Smell - People 40+ having problems with smell (%)
Taste & Smell - People 40+ having problems with taste (%)
Taste & Smell - People 40+ that ever had wisdom teeth removed (%)
Taste & Smell - People 40+ that ever had tonsils teeth removed (%)
Taste & Smell - People 40+ that ever had a loss of consciousness because of a head injury (%)
Taste & Smell - People 40+ that ever had a broken nose or other serious injury to face or skull (%)
Taste & Smell - People 40+ that ever had two or more sinus infections (%)
Weight - Average height (inches)
Weight - Average weight (pounds)
Weight - Average BMI
Weight - People that are obese (%)
Weight - People that ever were obese (%)
Weight - People trying to lose weight (%)
100%
urban population.
Estimated median house/condo value in 2022: $212,683
75180:
$212,683Texas:
$275,400
According to our research of Texas and other state lists, there were 27 registered sex offenders living in 75180 zip code as of April 23, 2024 . The ratio of all residents to sex offenders in zip code 75180 is 905 to 1.The ratio of registered sex offenders to all residents in this zip code is lower than the state average.
Median resident age: This zip code:
31.7 yearsTexas median age:
35.6 years
Average household size: This zip code:
3.2 peopleTexas:
2.6 people
Averages for the 2020 tax year for zip code 75180, filed in 2021:
Average Adjusted Gross Income (AGI) in 2020: $36,512 (Individual Income Tax Returns) Here:
$36,512State:
$77,054
Salary/wage: $35,787 (reported on 83.9% of returns )Here:
$35,787State:
$62,766
(% of AGI for various income ranges: 1269.7% for AGIs below $25k , 3786.9% for AGIs $25k-50k , 6914.7% for AGIs $50k-75k , 9602.9% for AGIs $75k-100k , 14845.6% for AGIs $100k-200k ) Taxable interest for individuals: $546 (reported on 6.2% of returns )This zip code:
$546Texas:
$2,665
(% of AGI for various income ranges: 1.8% for AGIs below $25k , 2.8% for AGIs $25k-50k , 8.5% for AGIs $50k-75k , 3.3% for AGIs $75k-100k , 40.0% for AGIs $100k-200k ) Ordinary dividends: $992 (reported on 2.3% of returns )(% of AGI for various income ranges: 1.0% for AGIs below $25k , 1.7% for AGIs $25k-50k , 5.4% for AGIs $50k-75k , 3.8% for AGIs $75k-100k , 33.0% for AGIs $100k-200k ) Net capital gain/loss in AGI: +$3,843 (reported on 2.5% of returns )Here:
+$3,843State:
+$39,590
(% of AGI for various income ranges: 0.2% for AGIs below $25k , 2.9% for AGIs $25k-50k , 11.5% for AGIs $50k-75k , 18.9% for AGIs $75k-100k , 281.1% for AGIs $100k-200k ) Profit/loss from business: +$7,821 (reported on 26.3% of returns )Here:
+$7,821State:
+$10,888
(% of AGI for various income ranges: 227.3% for AGIs below $25k , 256.9% for AGIs $25k-50k , 309.0% for AGIs $50k-75k , 342.4% for AGIs $75k-100k , 477.4% for AGIs $100k-200k ) Taxable individual retirement arrangement distribution: $12,832 (reported on 1.7% of returns )75180:
$12,832Texas:
$24,740
(% of AGI for various income ranges: 12.8% for AGIs below $25k , 9.0% for AGIs $25k-50k , 49.0% for AGIs $50k-75k , 66.0% for AGIs $75k-100k , 298.9% for AGIs $100k-200k ) Total itemized deductions: $27,253 (reported on 3.1% of returns )Here:
$27,253State:
$40,428
(% of AGI for various income ranges: 15.4% for AGIs below $25k , 73.5% for AGIs $25k-50k , 252.0% for AGIs $50k-75k , 295.3% for AGIs $75k-100k , 801.1% for AGIs $100k-200k ) Charity contributions: $8,282 (reported on 2.5% of returns )(% of AGI for various income ranges: 2.7% for AGIs below $25k , 16.2% for AGIs $25k-50k , 68.2% for AGIs $50k-75k , 78.4% for AGIs $75k-100k , 211.1% for AGIs $100k-200k ) Taxes paid: $5,721 (reported on 3.0% of returns )(% of AGI for various income ranges: 2.4% for AGIs below $25k , 14.4% for AGIs $25k-50k , 61.9% for AGIs $50k-75k , 63.1% for AGIs $75k-100k , 129.6% for AGIs $100k-200k ) Earned income credit: $2,895 (reported on 30.4% of returns )(% of AGI for various income ranges: 169.8% for AGIs below $25k , 108.4% for AGIs $25k-50k , 2.1% for AGIs $50k-75k ) Percentage of individuals using paid preparers for their 2020 taxes: 89.3%(% for various income ranges: 88.0% for AGIs below $25k , 90.1% for AGIs $25k-50k , 89.5% for AGIs $50k-75k , 91.2% for AGIs $75k-100k , 92.5% for AGIs $100k-200k , 100.0% for AGIs over 200k )
Averages for the 2012 tax year for zip code 75180, filed in 2013:
Average Adjusted Gross Income (AGI) in 2012: $30,377 (Individual Income Tax Returns) Here:
$30,377State:
$65,384
Salary/wage: $29,717 (reported on 87.8% of returns )Here:
$29,717State:
$52,524
(% of AGI for various income ranges: 80.8% for AGIs below $25k , 91.3% for AGIs $25k-50k , 89.7% for AGIs $50k-75k , 88.4% for AGIs $75k-100k , 67.2% for AGIs $100k-200k ) Taxable interest for individuals: $526 (reported on 8.1% of returns )This zip code:
$526Texas:
$2,372
(% of AGI for various income ranges: 0.1% for AGIs $25k-50k , 0.1% for AGIs $50k-75k , 0.1% for AGIs $75k-100k , 0.4% for AGIs $100k-200k ) Ordinary dividends: $2,089 (reported on 2.9% of returns )(% of AGI for various income ranges: 0.2% for AGIs below $25k , 0.2% for AGIs $25k-50k , 0.4% for AGIs $75k-100k , 0.1% for AGIs $100k-200k ) Net capital gain/loss in AGI: +$1,917 (reported on 1.9% of returns )Here:
+$1,917State:
+$35,319
(% of AGI for various income ranges: 0.2% for AGIs $50k-75k , 0.6% for AGIs $100k-200k ) Profit/loss from business: +$6,799 (reported on 21.0% of returns )Here:
+$6,799State:
+$13,732
(% of AGI for various income ranges: 13.0% for AGIs below $25k , 3.0% for AGIs $25k-50k , 1.4% for AGIs $50k-75k , 1.6% for AGIs $75k-100k , 0.8% for AGIs $100k-200k ) Taxable individual retirement arrangement distribution: $9,944 (reported on 2.6% of returns )75180:
$9,944Texas:
$19,511
(% of AGI for various income ranges: 0.7% for AGIs below $25k , 0.6% for AGIs $25k-50k , 0.9% for AGIs $50k-75k , 1.2% for AGIs $75k-100k , 1.8% for AGIs $100k-200k ) Total itemized deductions: $17,045 (32% of AGI, reported on 11.9% of returns )Here:
$17,045State:
$24,724
Here:
32.1% of AGIState:
15.9% of AGI
(% of AGI for various income ranges: 3.6% for AGIs below $25k , 6.4% for AGIs $25k-50k , 9.3% for AGIs $50k-75k , 8.2% for AGIs $75k-100k , 8.1% for AGIs $100k-200k ) Charity contributions: $4,008 (reported on 8.4% of returns )(% of AGI for various income ranges: 0.3% for AGIs below $25k , 1.0% for AGIs $25k-50k , 1.7% for AGIs $50k-75k , 1.8% for AGIs $75k-100k , 1.6% for AGIs $100k-200k ) Taxes paid: $3,396 (reported on 11.4% of returns )(% of AGI for various income ranges: 0.5% for AGIs below $25k , 1.3% for AGIs $25k-50k , 1.8% for AGIs $50k-75k , 1.8% for AGIs $75k-100k , 1.7% for AGIs $100k-200k ) Earned income credit: $2,812 (reported on 38.7% of returns )(% of AGI for various income ranges: 12.1% for AGIs below $25k , 2.0% for AGIs $25k-50k ) Percentage of individuals using paid preparers for their 2012 taxes: 57.2%(% for various income ranges: 58.4% for AGIs below $25k , 55.8% for AGIs $25k-50k , 56.5% for AGIs $50k-75k , 55.9% for AGIs $75k-100k , 57.9% for AGIs $100k-200k )
Averages for the 2004 tax year for zip code 75180, filed in 2005:
Average Adjusted Gross Income (AGI) in 2004: $28,079 (Individual Income Tax Returns) Here:
$28,079State:
$47,881
Salary/wage: $28,162 (reported on 90.0% of returns )Here:
$28,162State:
$41,947
(% of AGI for various income ranges: 93.4% for AGIs below $10k , 87.1% for AGIs $10k-25k , 93.0% for AGIs $25k-50k , 91.2% for AGIs $50k-75k , 90.6% for AGIs $75k-100k , 75.0% for AGIs over 100k ) Taxable interest for individuals: $630 (reported on 14.0% of returns )This zip code:
$630Texas:
$2,255
(% of AGI for various income ranges: 0.8% for AGIs below $10k , 0.4% for AGIs $10k-25k , 0.2% for AGIs $25k-50k , 0.4% for AGIs $50k-75k , 0.2% for AGIs $75k-100k , 0.3% for AGIs over 100k ) Taxable dividends: $838 (reported on 4.2% of returns )(% of AGI for various income ranges: 0.5% for AGIs below $10k , 0.2% for AGIs $10k-25k , 0.0% for AGIs $25k-50k , 0.1% for AGIs $50k-75k , 0.1% for AGIs $75k-100k , 0.2% for AGIs over 100k ) Net capital gain/loss: +$700 (reported on 3.3% of returns )(% of AGI for various income ranges: -0.3% for AGIs below $10k , 0.1% for AGIs $10k-25k , 0.1% for AGIs $25k-50k , 0.0% for AGIs $50k-75k , 0.4% for AGIs $75k-100k , 0.3% for AGIs over 100k ) Profit/loss from business: +$5,293 (reported on 15.2% of returns )Here:
+$5,293State:
+$11,013
(% of AGI for various income ranges: 9.0% for AGIs below $10k , 6.4% for AGIs $10k-25k , 2.0% for AGIs $25k-50k , 1.5% for AGIs $50k-75k , 0.8% for AGIs $75k-100k , 0.9% for AGIs over 100k ) IRA payment deduction: $1,983 (reported on 0.8% of returns )Total itemized deductions: $14,189 (30% of AGI, reported on 16.4% of returns )Here:
$14,189State:
$19,631
Here:
30.0% of AGIState:
18.9% of AGI
(% of AGI for various income ranges: 5.0% for AGIs below $10k , 4.3% for AGIs $10k-25k , 8.9% for AGIs $25k-50k , 10.6% for AGIs $50k-75k , 10.0% for AGIs $75k-100k , 9.5% for AGIs over 100k ) Charity contributions deductions: $3,409 (7% of AGI, reported on 12.3% of returns )Here:
6.9% of AGIState:
4.2% of AGI
(% of AGI for various income ranges: 0.4% for AGIs below $10k , 0.7% for AGIs $10k-25k , 1.5% for AGIs $25k-50k , 2.0% for AGIs $50k-75k , 2.3% for AGIs $75k-100k , 2.6% for AGIs over 100k ) Total tax: $2,926 (reported on 60.3% of returns )(% of AGI for various income ranges: 3.0% for AGIs below $10k , 3.2% for AGIs $10k-25k , 5.2% for AGIs $25k-50k , 8.0% for AGIs $50k-75k , 10.0% for AGIs $75k-100k , 16.0% for AGIs over 100k ) Earned income credit: $1,995 (reported on 33.1% of returns )Percentage of individuals using paid preparers for their 2004 taxes: 61.4%(% for various income ranges: 52.1% for AGIs below $10k , 67.9% for AGIs $10k-25k , 61.5% for AGIs $25k-50k , 59.7% for AGIs $50k-75k , 55.5% for AGIs $75k-100k , 62.8% for AGIs over 100k )
Estimated median household income in 2022: This zip code:
$57,232Texas:
$72,284
Nearest zip codes: 75253 ,
75149 ,
75217 ,
75181 ,
75227 ,
75150 .
Mesquite Zip Code Map
Percentage of family households: This zip code:
55.1%Texas:
50.5%
Percentage of households with unmarried partners: This zip code:
7.9%Texas:
48.7%
Likely homosexual households (counted as self-reported same-sex unmarried-partner households)
Lesbian couples: 0.1% of all households Gay men: 0.4% of all households
Household received Food Stamps/SNAP in the past 12 months: 1,848Household did not receive Food Stamps/SNAP in the past 12 months: 6,764
Women who had a birth in the past 12 months: 485 (334 now married , 151 unmarried) Women who did not have a birth in the past 12 months: 6,278 (2,285 now married , 4,007 unmarried)
Housing units in zip code 75180 with a mortgage: 2,801
Houses without a mortgage: 82
Median monthly owner costs for units with a mortgage: $1,514
Median monthly owner costs for units without a mortgage: $603
Residents with income below the poverty level in 2022:
This zip code:
11.6%Whole state:
14.0%
Residents with income below 50% of the poverty level in 2022:
This zip code:
5.8%Whole state:
7.4%
Median number of rooms in houses and condos: Median number of rooms in apartments: Notable locations in this zip code not listed on our city pages
Click to draw/clear zip code borders Notable locations in zip code 75180: (A) , Texas Lifeline Corporation Ambulance Balch Springs (B) . Display/hide their locations on the map
Churches in zip code 75180 include: (A) , Spence Park Church (B) , Spence Park Baptist Church (C) , Shady Grove Baptist Church (D) , Seagoville Road Baptist Church (E) , Victory Baptist Church (F) , Spring Oaks Baptist Church (G) , Balch Springs Church of Christ (H) , Midway Church of Christ (I) . Display/hide their locations on the map
Parks in zip code 75180 include: (1) , Chiesl Baseball Complex (2) , Cheyenne Park (3) . Display/hide their locations on the map
Year house built (houses)
0 2020 or later970 2010 to 20191,879 2000 to 2009680 1990 to 19991,674 1980 to 19891,075 1970 to 19791,449 1960 to 1969713 1950 to 1959114 1940 to 1949223 1939 or earlier
Zip code 75180 household income distribution in 2022 173 Less than $10,000339 $10,000 to $14,999284 $15,000 to $19,999363 $20,000 to $24,999423 $25,000 to $29,999153 $30,000 to $34,999464 $35,000 to $39,999357 $40,000 to $44,999835 $45,000 to $49,999935 $50,000 to $59,999943 $60,000 to $74,9991,043 $75,000 to $99,999920 $100,000 to $124,999690 $125,000 to $149,999377 $150,000 to $199,999184 $200,000 or moreEstimate of home value of owner-occupied houses/condos in 2022 in zip code 75180 196 Less than $10,000138 $10,000 to $14,99947 $15,000 to $19,99932 $25,000 to $29,99919 $30,000 to $34,99913 $35,000 to $39,99917 $40,000 to $49,9999 $50,000 to $59,999115 $60,000 to $69,99990 $70,000 to $79,999105 $80,000 to $89,999184 $90,000 to $99,999440 $100,000 to $124,999213 $125,000 to $149,999406 $150,000 to $174,999474 $175,000 to $199,9991,303 $200,000 to $249,999350 $250,000 to $299,999309 $300,000 to $399,99915 $400,000 to $499,99934 $500,000 to $749,99976 $750,000 to $999,99970 $1,000,000 to $1,499,99928 $2,000,000 or moreRent paid by renters in 2022 in zip code 75180 12 $100 to $14937 $200 to $24962 $250 to $29941 $350 to $3997 $450 to $499100 $500 to $54969 $550 to $599137 $600 to $649106 $650 to $699101 $700 to $749191 $750 to $799328 $800 to $899202 $900 to $999988 $1,000 to $1,249539 $1,250 to $1,49997 $1,500 to $1,999180 No cash rent
Median gross rent in 2022: $1,202.
Median price asked for vacant for-sale houses and condos in 2022: $164,470.
Estimated median house (or condo) value in 2022 for: White Non-Hispanic householders: $207,806Black or African American householders: $282,826American Indian or Alaska Native householders: $249,442Asian householders: $281,326Some other race householders: $197,303Two or more races householders: $144,789Hispanic or Latino householders: $204,055Estimated median house or condo value in 2022: $212,683
75180:
$212,683Texas:
$275,400
Lower value quartile - upper value quartile: $128,502 - $263,831
Mean price in 2022: Detached houses: $447,693Here:
$447,693State:
$369,058
Townhouses or other attached units: $386,313Here:
$386,313State:
$327,631
In 2-unit structures: $294,897Here:
$294,897State:
$374,947
In 3-to-4-unit structures: $252,964Here:
$252,964State:
$209,652
In 5-or-more-unit structures: $424,654Here:
$424,654State:
$413,944
Mobile homes: $66,551Here:
$66,551State:
$124,413
Occupied boats, RVs, vans, etc.: $358,239Here:
$358,239State:
$73,921
Housing units in structures:
One, detached: 6,154One, attached: 195Two: 1993 or 4: 2675 to 9: 61010 to 19: 67020 to 49: 15650 or more: 458Mobile homes: 384Unemployment : 7.4%
Means of transportation to work in zip code 75180 68.6% 8,335 Drove a car alone20.6% 2,499 Carpooled0.7% 84 Bus or trolley bus0.5% 59 Railroad0.4% 43 Motorcycle0.3% 39 Walked0.1% 15 Other means7.5% 908 Worked at homeTravel time to work (commute) in zip code 75180 111 Less than 5 minutes368 5 to 9 minutes763 10 to 14 minutes1,439 15 to 19 minutes1,231 20 to 24 minutes630 25 to 29 minutes1,855 30 to 34 minutes278 35 to 39 minutes529 40 to 44 minutes1,365 45 to 59 minutes1,936 60 to 89 minutes493 90 or more minutes
Neighborhoods in zip code 75180: Percentage of zip code residents living and working in this county: 82.6%
Household type by relationship:
Households: 27,777
Male householders: 3,500 (630 living alone ), Female householders: 5,086 (1,055 living alone )3,874 spouses (3,836 opposite-sex spouses ), 754 unmarried partners , (674 opposite-sex unmarried partners ), 10,233 children (9,725 natural , 155 adopted , 351 stepchildren ), 1,720 grandchildren , 665 brothers or sisters , 587 parents , 14 foster children , 661 other relatives , 470 non-relatives In group quarters: 120 (-1 institutionalized population )
Size of family households: 1,448 2-persons , 1,656 3-persons , 1,667 4-persons , 802 5-persons , 426 6-persons , 335 7-or-more-persons
Size of nonfamily households: 1,683 1-person , 452 2-persons , 25 3-persons , 19 4-persons
4,118 married couples with children. single-parent households (332 men , 2,402 women ).
52.2% of residents of 75180 zip code speak English at home. of residents speak Spanish at home (53% very well, 16% well, 20% not well, 11% not at all ).of residents speak other Indo-European language at home (100% very well ).of residents speak other language at home (83% very well, 10% well, 7% not well ).
Foreign born population: 6,560 (23.6%)
(24.4%
of them are naturalized citizens )
This zip code:
23.6%Whole state:
17.2%
80% Honduras 8% Costa Rica 3% Liberia 2% Guatemala 1% El Salvador 1% Chile 0% Cabo Verde 5% American 2% English 2% Irish 2% Nigerian 1% European 0% French 0% German
Year of entry for the foreign-born population
1,462 2010 or later 2,350 2000 to 2009 1,621 1990 to 1999 1,249 Before 1990
There are
18 Medical Specialists in Zip Code 75180 .
Facilities with environmental interests located in this zip code:
BABERS GARAGE (2220 W BRUTON RD in MESQUITE, TX)
(Resource Conservation and Recovery Act (tracking hazardous waste)) Business NAICS classification: OTHER AUTOMOTIVE MECHANICAL AND ELECTRICAL REPAIR AND MAINTENANCE.
$1.53 DRY CLEANER (112 BRUTON ROAD in BALCH SPRINGS, TX)
AIR MINOR (AIRS/AFS) Business SIC classification: DRYCLEANING PLANTS, EXCEPT RUG CLEANING
BALCH SPRINGS CLEANERS (11403 EAST LAKE JUNE ROAD in BALCH SPRINGS, TX)
AIR MINOR (AIRS/AFS) Business SIC classification: DRYCLEANING PLANTS, EXCEPT RUG CLEANING
Housing units lacking complete plumbing facilities: 0.9%
Housing units lacking complete kitchen facilities: 0.6%
75.2% Electricity 22.9% Utility gas 1.4% No fuel used
Population in 1990: 18,848. Population change in the 1990s: +487 (+2.6%).
Place of birth for U.S.-born residents:
This state: 17,691Northeast: 98Midwest: 793South: 1,612West: 610
53% of the 75180 zip code residents lived in the same house 5 years ago.
Out of people who lived in different houses, 74% lived in this county.
Out of people who lived in different counties, 50% lived in Texas.
90% of the 75180 zip code residents lived in the same house 1 year ago.
Out of people who lived in different houses, 82% moved from this county.
Out of people who lived in different houses, 5% moved from different county within same state.
Out of people who lived in different houses, 5% moved from different state.
Out of people who lived in different houses, 3% moved from abroad.
Private vs. public school enrollment:
Students in private schools in grades 1 to 8 (elementary and middle school): 279
Students in private schools in grades 9 to 12 (high school): 47
Students in private undergraduate colleges: 235
Occupation by median earnings in the past 12 months ($)
78,302 Business and financial operations occupations 65,688 Health diagnosing and treating practitioners and other technical occupations 65,369 Law enforcement workers including supervisors 57,095 Health technologists and technicians 52,405 Installation, maintenance, and repair occupations 51,440 Computer and mathematical occupations
Companies with federal contracts located in this zip code:
HUGHES BUILDING SERVICES (3207 S PEACHTREE STREET, in BALCH SPRINGS, TX; small business) in 169 contracts from 2000 to 2006
Contracts for Maintenance, Repair or Alteration of Real Property -- Miscellaneous Buildings, Maintenance, Repair or Alteration of Real Property -- Maintenance Buildings, Construction of Structures and Facilities -- Other Warehouse Buildings, Maintenance, Repair or Alteration of Real Property -- Restoration of real property, and more by Department of Veterans Affairs, Air Force, Bureau of Prisoners/Federal Prison SystemSigned by year: 2000: $226,464; 2001: $903,129; 2002: $2,747,742; 2003: $5,527,279; 2004: $4,946,914; 2005: $2,198,020; 2006: $243,539.
Biggest contracts: with Department of Veterans Affairs for Maintenance, Repair or Alteration of Real Property -- Miscellaneous Buildings. Signed on 2004-05-10. Completion date: 2005-03-16.
, same as above. Signed on 2004-05-10. Completion date: 2005-02-17.
with Air Force for Maintenance, Repair or Alteration of Real Property -- Miscellaneous Buildings. Signed on 2005-09-29. Completion date: 2006-04-03.
with Air Force for Maintenance, Repair or Alteration of Real Property -- Maintenance Buildings. Signed on 2003-07-22. Completion date: 2004-05-01.
MITCHELL MACHINE & FABRICATING (3200 BELTLINE AT QUAIL DR in BALCH SPRINGS, TX; small business) in 2 contracts in 2000
$147,825 with Army for Launchers, Rocket and Pyrotechnic. Signed on 2000-04-07. Completion date: 2000-07-12.
with Army for Bushings, Rings, Shims, and Spacers. Signed on 2000-06-02. Completion date: 2000-09-12.
GIBSON & ASSOCIATES, INC (11210 RYLIECREST in BALCH SPRINGS, TX; small business)
$99,925 with U.S. Army Corps of Engineers - civil program financing only for Maintenance, Repair or Alteration of Real Property -- Dams. Signed on 2001-09-17. Completion date: 2001-12-16.
LEFEVERS' PLUMBING INC (5401 S PEACHTREE RD in MESQUITE, TX; small business)
$7,800 with Army for Maintenance, Repair and Rebuilding of Equipment -- Plumbing, Heating, and Waste Disposal Equipment. Signed on 2005-12-19. Completion date: 2005-12-26.
Top industries in this zip code by the number of employees in 2005:
Accommodation and Food Services: Limited-Service Restaurants (50-99 employees: 1 establishment, 20-49 employees: 6 establishments, 10-19 employees: 8 establishments, 1-4 employees: 3 establishments)Construction: Electrical Contractors (100-249: 1, 50-99: 2, 20-49: 2, 1-4: 3)Construction: Highway, Street, and Bridge Construction (100-249: 1, 50-99: 1, 10-19: 1)Construction: Water and Sewer Line and Related Structures Construction (100-249: 1)Construction: Plumbing, Heating, and Air-Conditioning Contractors (20-49: 1, 10-19: 2, 5-9: 3, 1-4: 5)Health Care and Social Assistance: Offices of Dentists (50-99: 1, 10-19: 1, 1-4: 2)
People in group quarters in 2010:
102 people in nursing facilities/skilled-nursing facilities
5 people in group homes intended for adults
People in group quarters in 2000:
77 people in nursing homes
Fatal accident statistics in 2014:
Fatal accident count: 5Vehicles involved in fatal accidents: 9Fatal accidents caused by drunken drivers: 2Fatalities: 6Persons involved in fatal accidents: 15Pedestrians involved in fatal accidents: 1
Fatal accident statistics in 2013:
Fatal accident count: 3Vehicles involved in fatal accidents: 5Fatal accidents caused by drunken drivers: 2Fatalities: 4Persons involved in fatal accidents: 9Pedestrians involved in fatal accidents: 1
Home Mortgage Disclosure Act Aggregated Statistics For Year 2009(Based on 2 full and 10 partial tracts) A) FHA, FSA/RHS & VA B) Conventional C) Refinancings D) Home Improvement Loans E) Loans on Dwellings For 5+ Families F) Non-occupant Loans on G) Loans On Manufactured Number Average Value Number Average Value Number Average Value Number Average Value Number Average Value Number Average Value Number Average Value
LOANS ORIGINATED 96 $87,497 77 $58,704 122 $90,141 15 $27,039 0 $0 89 $55,548 2 $54,985 APPLICATIONS APPROVED, NOT ACCEPTED 10 $94,824 4 $81,318 21 $86,189 6 $28,485 0 $0 8 $57,871 0 $0 APPLICATIONS DENIED 23 $74,287 32 $45,195 99 $84,211 57 $21,620 0 $0 11 $55,374 13 $23,757 APPLICATIONS WITHDRAWN 17 $93,081 11 $64,905 43 $93,675 2 $29,765 1 $2,338,520 14 $72,550 0 $0 FILES CLOSED FOR INCOMPLETENESS 5 $96,176 0 $0 11 $87,783 2 $108,965 0 $0 0 $0 0 $0
Aggregated Statistics For Year 2008(Based on 2 full and 10 partial tracts) A) FHA, FSA/RHS & VA B) Conventional C) Refinancings D) Home Improvement Loans E) Loans on Dwellings For 5+ Families F) Non-occupant Loans on G) Loans On Manufactured Number Average Value Number Average Value Number Average Value Number Average Value Number Average Value Number Average Value Number Average Value
LOANS ORIGINATED 169 $100,667 161 $70,889 140 $78,927 20 $18,850 0 $0 120 $60,562 1 $62,190 APPLICATIONS APPROVED, NOT ACCEPTED 24 $94,412 18 $83,063 25 $66,691 14 $10,970 0 $0 16 $71,275 0 $0 APPLICATIONS DENIED 52 $105,110 73 $79,262 280 $79,390 127 $26,773 0 $0 41 $67,125 7 $56,543 APPLICATIONS WITHDRAWN 29 $96,151 22 $70,648 81 $87,048 10 $37,857 1 $3,224,700 14 $63,686 0 $0 FILES CLOSED FOR INCOMPLETENESS 10 $109,922 12 $66,180 26 $92,545 3 $42,257 0 $0 6 $51,378 0 $0
Aggregated Statistics For Year 2007(Based on 2 full and 10 partial tracts) A) FHA, FSA/RHS & VA B) Conventional C) Refinancings D) Home Improvement Loans E) Loans on Dwellings For 5+ Families F) Non-occupant Loans on G) Loans On Manufactured Number Average Value Number Average Value Number Average Value Number Average Value Number Average Value Number Average Value Number Average Value
LOANS ORIGINATED 138 $96,217 340 $75,238 237 $79,947 79 $29,940 7 $10,579,856 166 $63,598 2 $56,370 APPLICATIONS APPROVED, NOT ACCEPTED 4 $91,942 80 $79,067 89 $82,510 16 $37,467 0 $0 36 $75,812 8 $63,569 APPLICATIONS DENIED 27 $101,373 224 $82,862 550 $88,629 194 $30,385 0 $0 94 $81,449 8 $52,908 APPLICATIONS WITHDRAWN 17 $91,772 73 $107,993 202 $91,395 19 $32,979 1 $3,803,170 20 $62,752 0 $0 FILES CLOSED FOR INCOMPLETENESS 6 $115,313 47 $84,137 69 $97,309 0 $0 0 $0 14 $69,811 0 $0
Aggregated Statistics For Year 2006(Based on 2 full and 10 partial tracts) A) FHA, FSA/RHS & VA B) Conventional C) Refinancings D) Home Improvement Loans E) Loans on Dwellings For 5+ Families F) Non-occupant Loans on G) Loans On Manufactured Number Average Value Number Average Value Number Average Value Number Average Value Number Average Value Number Average Value Number Average Value
LOANS ORIGINATED 101 $95,544 674 $67,789 295 $74,810 65 $31,351 2 $6,738,525 214 $53,363 2 $20,165 APPLICATIONS APPROVED, NOT ACCEPTED 3 $76,827 140 $68,493 99 $71,359 21 $26,661 0 $0 33 $54,954 4 $52,620 APPLICATIONS DENIED 21 $85,656 384 $75,921 572 $87,343 190 $76,003 0 $0 127 $66,012 12 $50,779 APPLICATIONS WITHDRAWN 11 $90,691 142 $73,148 324 $88,647 22 $39,925 0 $0 48 $66,788 1 $52,310 FILES CLOSED FOR INCOMPLETENESS 2 $66,320 17 $66,606 125 $99,688 1 $61,540 0 $0 4 $56,322 0 $0
Aggregated Statistics For Year 2005(Based on 2 full and 10 partial tracts) A) FHA, FSA/RHS & VA B) Conventional C) Refinancings D) Home Improvement Loans F) Non-occupant Loans on G) Loans On Manufactured Number Average Value Number Average Value Number Average Value Number Average Value Number Average Value Number Average Value
LOANS ORIGINATED 114 $96,964 765 $66,953 439 $71,536 73 $72,952 214 $57,568 2 $118,800 APPLICATIONS APPROVED, NOT ACCEPTED 14 $91,477 163 $72,722 89 $72,022 16 $26,624 30 $67,999 3 $70,877 APPLICATIONS DENIED 76 $123,544 422 $72,162 660 $75,017 161 $30,803 132 $65,036 18 $45,053 APPLICATIONS WITHDRAWN 26 $129,017 179 $89,338 380 $93,173 74 $142,904 41 $71,840 0 $0 FILES CLOSED FOR INCOMPLETENESS 13 $104,442 41 $81,420 167 $81,628 1 $26,460 13 $72,357 0 $0
Aggregated Statistics For Year 2004(Based on 2 full and 10 partial tracts) A) FHA, FSA/RHS & VA B) Conventional C) Refinancings D) Home Improvement Loans E) Loans on Dwellings For 5+ Families F) Non-occupant Loans on G) Loans On Manufactured Number Average Value Number Average Value Number Average Value Number Average Value Number Average Value Number Average Value Number Average Value
LOANS ORIGINATED 246 $101,399 558 $72,418 616 $69,072 56 $37,127 0 $0 152 $57,978 0 $0 APPLICATIONS APPROVED, NOT ACCEPTED 10 $88,634 159 $80,313 113 $68,868 15 $39,508 0 $0 29 $74,566 4 $22,018 APPLICATIONS DENIED 136 $120,463 294 $79,851 714 $72,326 154 $30,100 0 $0 73 $58,701 12 $32,635 APPLICATIONS WITHDRAWN 67 $124,054 142 $87,138 341 $75,527 25 $53,208 2 $555,430 33 $70,361 0 $0 FILES CLOSED FOR INCOMPLETENESS 11 $105,136 47 $73,673 239 $81,055 4 $41,562 0 $0 4 $58,975 0 $0
Aggregated Statistics For Year 2003(Based on 2 full and 10 partial tracts) A) FHA, FSA/RHS & VA B) Conventional C) Refinancings D) Home Improvement Loans E) Loans on Dwellings For 5+ Families F) Non-occupant Loans on Number Average Value Number Average Value Number Average Value Number Average Value Number Average Value Number Average Value
LOANS ORIGINATED 332 $106,566 343 $73,552 894 $67,532 26 $20,703 2 $828,170 138 $59,808 APPLICATIONS APPROVED, NOT ACCEPTED 7 $97,516 92 $80,348 121 $64,807 13 $47,168 0 $0 20 $57,850 APPLICATIONS DENIED 169 $129,516 219 $76,202 723 $68,871 102 $18,213 0 $0 57 $65,652 APPLICATIONS WITHDRAWN 127 $123,099 146 $90,667 383 $68,267 5 $75,836 0 $0 27 $55,900 FILES CLOSED FOR INCOMPLETENESS 24 $103,108 78 $82,781 64 $64,085 2 $13,090 0 $0 5 $56,436
Aggregated Statistics For Year 2002(Based on 2 full and 8 partial tracts) A) FHA, FSA/RHS & VA B) Conventional C) Refinancings D) Home Improvement Loans E) Loans on Dwellings For 5+ Families F) Non-occupant Loans on Number Average Value Number Average Value Number Average Value Number Average Value Number Average Value Number Average Value
LOANS ORIGINATED 313 $89,873 200 $72,777 474 $57,985 31 $16,952 5 $7,561,544 83 $51,008 APPLICATIONS APPROVED, NOT ACCEPTED 9 $68,652 51 $57,485 86 $54,338 9 $9,822 0 $0 19 $62,397 APPLICATIONS DENIED 62 $96,400 166 $61,243 309 $54,227 58 $9,611 0 $0 39 $44,882 APPLICATIONS WITHDRAWN 50 $112,156 46 $59,639 270 $60,721 3 $31,550 2 $13,903,990 21 $50,243 FILES CLOSED FOR INCOMPLETENESS 12 $89,188 36 $66,712 57 $64,945 0 $0 4 $2,196,260 3 $46,257
Aggregated Statistics For Year 2001(Based on 2 full and 8 partial tracts) A) FHA, FSA/RHS & VA B) Conventional C) Refinancings D) Home Improvement Loans F) Non-occupant Loans on Number Average Value Number Average Value Number Average Value Number Average Value Number Average Value
LOANS ORIGINATED 245 $78,490 152 $59,046 340 $56,111 43 $13,560 88 $54,770 APPLICATIONS APPROVED, NOT ACCEPTED 8 $76,201 43 $59,639 68 $49,801 15 $16,947 11 $54,750 APPLICATIONS DENIED 26 $74,687 264 $43,591 246 $52,358 96 $13,572 31 $56,813 APPLICATIONS WITHDRAWN 25 $84,789 22 $67,054 205 $54,562 9 $15,626 9 $62,491 FILES CLOSED FOR INCOMPLETENESS 1 $72,460 18 $61,229 28 $57,777 2 $9,950 0 $0
Aggregated Statistics For Year 2000(Based on 2 full and 8 partial tracts) A) FHA, FSA/RHS & VA B) Conventional C) Refinancings D) Home Improvement Loans F) Non-occupant Loans on Number Average Value Number Average Value Number Average Value Number Average Value Number Average Value
LOANS ORIGINATED 286 $68,733 191 $51,189 164 $43,937 34 $10,735 60 $40,856 APPLICATIONS APPROVED, NOT ACCEPTED 20 $60,129 57 $46,925 33 $44,652 22 $18,943 13 $36,412 APPLICATIONS DENIED 37 $64,730 290 $43,588 114 $44,156 117 $12,553 9 $30,372 APPLICATIONS WITHDRAWN 23 $77,324 49 $49,581 103 $54,453 2 $8,230 13 $41,912 FILES CLOSED FOR INCOMPLETENESS 12 $66,062 20 $53,916 48 $61,966 3 $8,147 0 $0
Aggregated Statistics For Year 1999(Based on 1 full and 5 partial tracts) A) FHA, FSA/RHS & VA B) Conventional C) Refinancings D) Home Improvement Loans E) Loans on Dwellings For 5+ Families F) Non-occupant Loans on Number Average Value Number Average Value Number Average Value Number Average Value Number Average Value Number Average Value
LOANS ORIGINATED 130 $63,939 118 $46,676 140 $45,066 26 $15,003 3 $1,291,730 50 $35,962 APPLICATIONS APPROVED, NOT ACCEPTED 7 $73,253 59 $47,225 32 $56,996 15 $109,157 0 $0 8 $45,649 APPLICATIONS DENIED 17 $63,349 248 $46,981 76 $46,936 79 $28,475 0 $0 24 $49,662 APPLICATIONS WITHDRAWN 7 $64,626 29 $49,223 103 $50,634 4 $15,580 0 $0 5 $50,338 FILES CLOSED FOR INCOMPLETENESS 1 $52,690 6 $49,035 26 $46,159 0 $0 0 $0 2 $45,730
Private Mortgage Insurance Companies Aggregated Statistics For Year 2009(Based on 10 partial tracts) A) Conventional B) Refinancings C) Non-occupant Loans on Number Average Value Number Average Value Number Average Value
LOANS ORIGINATED 3 $53,590 2 $82,900 0 $0 APPLICATIONS APPROVED, NOT ACCEPTED 3 $102,797 0 $0 2 $62,175 APPLICATIONS DENIED 0 $0 0 $0 0 $0 APPLICATIONS WITHDRAWN 0 $0 0 $0 0 $0 FILES CLOSED FOR INCOMPLETENESS 6 $69,263 0 $0 5 $76,108
Aggregated Statistics For Year 2008(Based on 2 full and 10 partial tracts) A) Conventional B) Refinancings C) Non-occupant Loans on Number Average Value Number Average Value Number Average Value
LOANS ORIGINATED 84 $89,078 11 $82,211 18 $86,436 APPLICATIONS APPROVED, NOT ACCEPTED 38 $92,022 1 $80,870 5 $85,706 APPLICATIONS DENIED 20 $83,630 0 $0 14 $70,896 APPLICATIONS WITHDRAWN 10 $85,525 0 $0 2 $56,370 FILES CLOSED FOR INCOMPLETENESS 6 $70,310 0 $0 4 $54,408
Aggregated Statistics For Year 2007(Based on 2 full and 10 partial tracts) A) Conventional B) Refinancings C) Non-occupant Loans on Number Average Value Number Average Value Number Average Value
LOANS ORIGINATED 145 $87,510 17 $109,937 17 $58,981 APPLICATIONS APPROVED, NOT ACCEPTED 25 $113,185 12 $107,362 7 $105,607 APPLICATIONS DENIED 16 $119,014 2 $179,695 9 $118,758 APPLICATIONS WITHDRAWN 6 $87,820 5 $87,990 2 $96,010 FILES CLOSED FOR INCOMPLETENESS 5 $92,952 0 $0 2 $53,885
Aggregated Statistics For Year 2006(Based on 2 full and 10 partial tracts) A) Conventional B) Refinancings C) Non-occupant Loans on Number Average Value Number Average Value Number Average Value
LOANS ORIGINATED 90 $79,487 11 $71,759 15 $64,633 APPLICATIONS APPROVED, NOT ACCEPTED 10 $95,372 2 $131,075 1 $54,950 APPLICATIONS DENIED 4 $64,590 1 $43,800 4 $75,540 APPLICATIONS WITHDRAWN 7 $93,237 0 $0 3 $78,283 FILES CLOSED FOR INCOMPLETENESS 5 $78,118 0 $0 0 $0
Aggregated Statistics For Year 2005(Based on 2 full and 10 partial tracts) A) Conventional B) Refinancings C) Non-occupant Loans on Number Average Value Number Average Value Number Average Value
LOANS ORIGINATED 89 $75,600 14 $82,904 17 $61,938 APPLICATIONS APPROVED, NOT ACCEPTED 32 $79,457 8 $95,318 3 $69,810 APPLICATIONS DENIED 0 $0 2 $71,295 0 $0 APPLICATIONS WITHDRAWN 5 $99,638 2 $88,705 2 $95,695 FILES CLOSED FOR INCOMPLETENESS 0 $0 1 $60,400 1 $60,400
Aggregated Statistics For Year 2004(Based on 2 full and 10 partial tracts) A) Conventional B) Refinancings C) Non-occupant Loans on Number Average Value Number Average Value Number Average Value
LOANS ORIGINATED 103 $84,302 21 $82,263 19 $68,259 APPLICATIONS APPROVED, NOT ACCEPTED 13 $76,685 2 $46,805 3 $56,117 APPLICATIONS DENIED 6 $113,178 0 $0 0 $0 APPLICATIONS WITHDRAWN 14 $81,408 6 $62,180 3 $59,257 FILES CLOSED FOR INCOMPLETENESS 3 $65,083 2 $52,225 0 $0
Aggregated Statistics For Year 2003(Based on 2 full and 10 partial tracts) A) Conventional B) Refinancings C) Non-occupant Loans on Number Average Value Number Average Value Number Average Value
LOANS ORIGINATED 107 $89,766 18 $82,213 13 $67,828 APPLICATIONS APPROVED, NOT ACCEPTED 26 $92,435 10 $74,682 3 $57,673 APPLICATIONS DENIED 4 $79,340 0 $0 1 $66,390 APPLICATIONS WITHDRAWN 13 $95,888 3 $82,647 4 $74,058 FILES CLOSED FOR INCOMPLETENESS 0 $0 0 $0 0 $0
Aggregated Statistics For Year 2002(Based on 2 full and 8 partial tracts) A) Conventional B) Refinancings C) Non-occupant Loans on Number Average Value Number Average Value Number Average Value
LOANS ORIGINATED 65 $85,451 19 $84,323 13 $74,124 APPLICATIONS APPROVED, NOT ACCEPTED 12 $73,902 9 $80,364 3 $66,223 APPLICATIONS DENIED 4 $79,088 1 $114,680 2 $36,660 APPLICATIONS WITHDRAWN 14 $96,997 0 $0 3 $64,693 FILES CLOSED FOR INCOMPLETENESS 0 $0 0 $0 0 $0
Aggregated Statistics For Year 2001(Based on 2 full and 8 partial tracts) A) Conventional B) Refinancings C) Non-occupant Loans on Number Average Value Number Average Value Number Average Value
LOANS ORIGINATED 46 $75,740 13 $70,925 7 $48,667 APPLICATIONS APPROVED, NOT ACCEPTED 15 $66,577 2 $43,110 9 $64,326 APPLICATIONS DENIED 2 $44,925 0 $0 2 $44,925 APPLICATIONS WITHDRAWN 0 $0 2 $66,390 0 $0 FILES CLOSED FOR INCOMPLETENESS 0 $0 2 $85,385 0 $0
Aggregated Statistics For Year 2000(Based on 2 full and 8 partial tracts) A) Conventional B) Refinancings C) Non-occupant Loans on Number Average Value Number Average Value Number Average Value
LOANS ORIGINATED 59 $67,893 11 $67,329 12 $49,079 APPLICATIONS APPROVED, NOT ACCEPTED 8 $64,095 0 $0 0 $0 APPLICATIONS DENIED 1 $71,280 0 $0 0 $0 APPLICATIONS WITHDRAWN 2 $54,905 0 $0 0 $0 FILES CLOSED FOR INCOMPLETENESS 3 $50,197 0 $0 0 $0
Aggregated Statistics For Year 1999(Based on 1 full and 5 partial tracts) A) Conventional B) Refinancings C) Non-occupant Loans on Number Average Value Number Average Value Number Average Value
LOANS ORIGINATED 24 $51,953 7 $51,051 10 $39,569 APPLICATIONS APPROVED, NOT ACCEPTED 3 $60,953 2 $42,155 1 $46,710 APPLICATIONS DENIED 2 $66,920 1 $51,200 1 $60,910 APPLICATIONS WITHDRAWN 1 $29,760 2 $42,595 1 $47,310 FILES CLOSED FOR INCOMPLETENESS 1 $21,130 1 $65,850 0 $0
2002 - 2018 National Fire Incident Reporting System (NFIRS) incidents See full 2006 National Fire Incident Reporting System statistics for zip code 75180, Texas
Most common first names in zip code 75180 among deceased individuals Name Count Lived (average)
James 70 70.1 years William 44 68.2 years Mary 44 75.5 years Charles 38 66.9 years John 38 71.1 years Robert 35 66.4 years Dorothy 30 70.5 years George 25 73.7 years Billy 25 62.7 years Ruby 23 78.6 years
Most common last names in zip code 75180 among deceased individuals Last name Count Lived (average)
Smith 35 74.6 years Johnson 26 68.7 years Jones 24 74.0 years Williams 17 74.8 years Baker 16 66.1 years Moore 15 71.7 years Lewis 14 69.5 years Brown 14 73.4 years Davis 13 65.5 years Roberts 13 66.5 years
Businesses in zip code 75180
Name Count Name Count
AT&T 1 La Quinta 1 Arby's 1 McDonald's 2 AutoZone 1 Payless 1 Blockbuster 1 Pizza Hut 1 Burger King 1 Popeyes 1 CVS 1 RadioShack 1 Carl\s Jr. 1 SONIC Drive-In 2 Church's Chicken 1 T-Mobile 2 H&R Block 1 Taco Bell 1 Home Depot 1 U-Haul 3 KFC 1 Walmart 1 Kroger 1

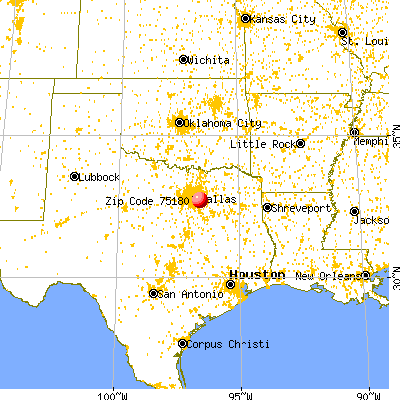


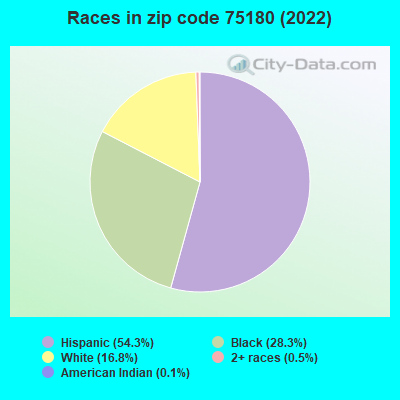


 Nearest zip codes: 75253, 75149, 75217, 75181, 75227, 75150.
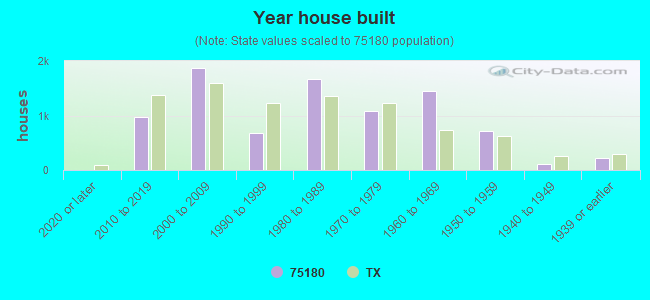

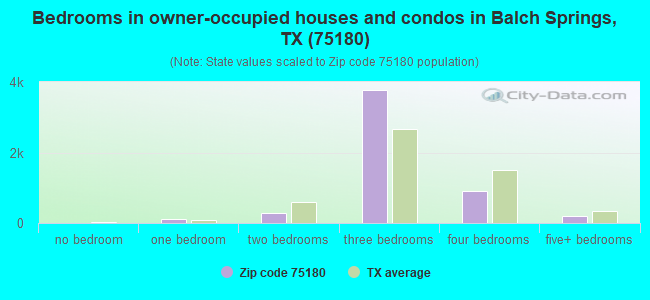
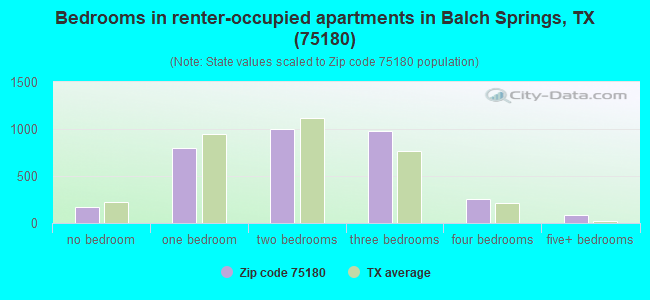
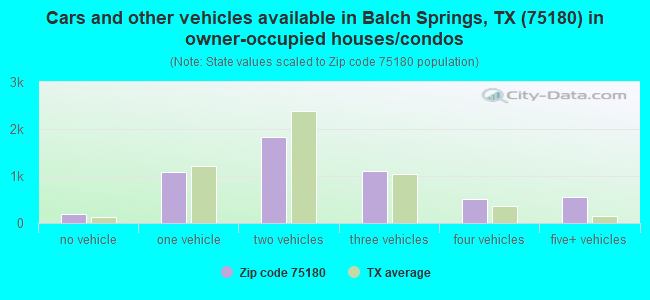
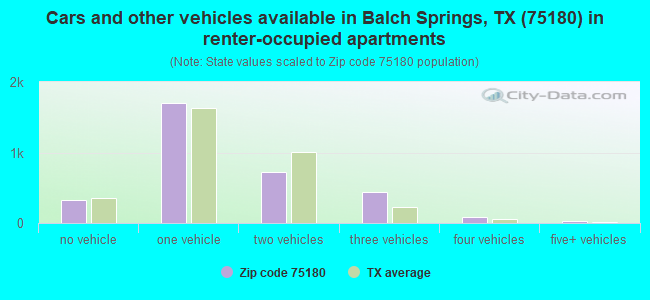


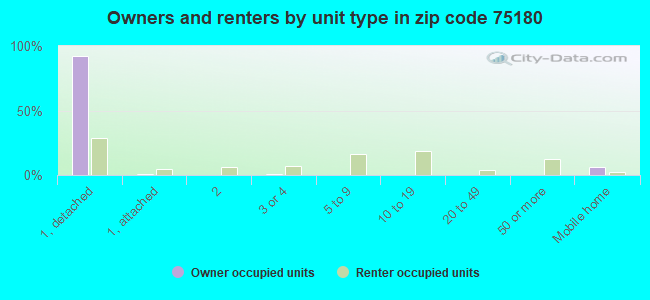
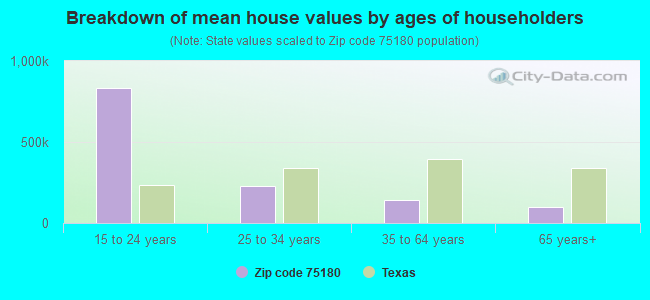


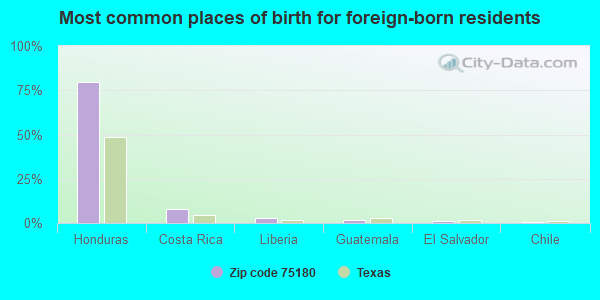
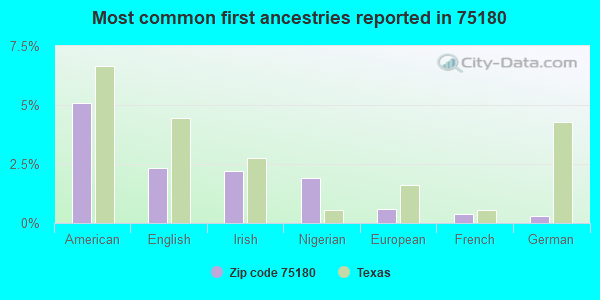
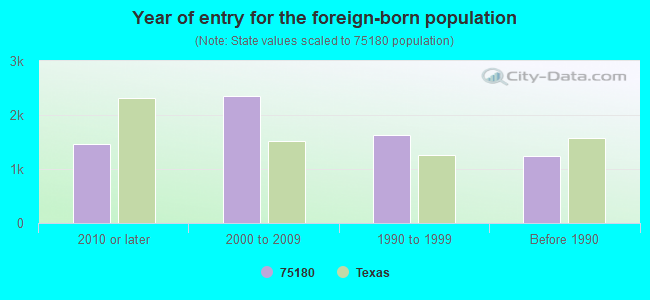


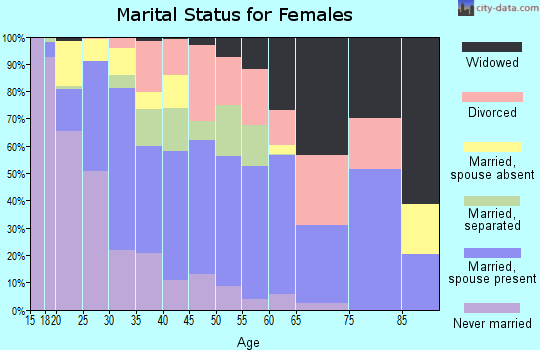
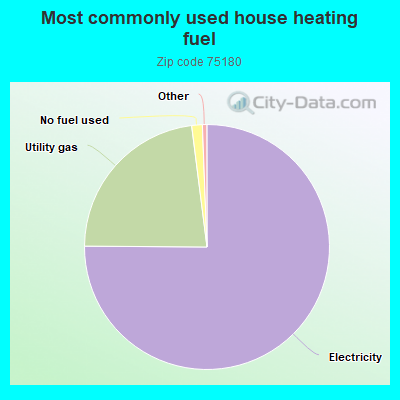
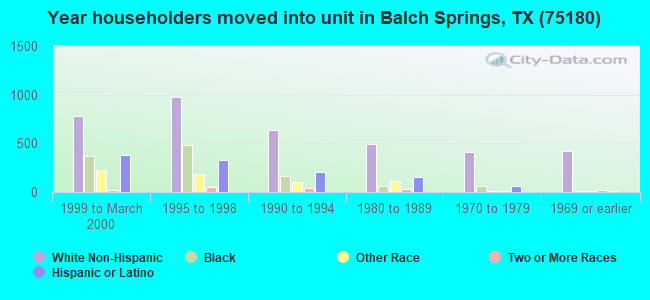
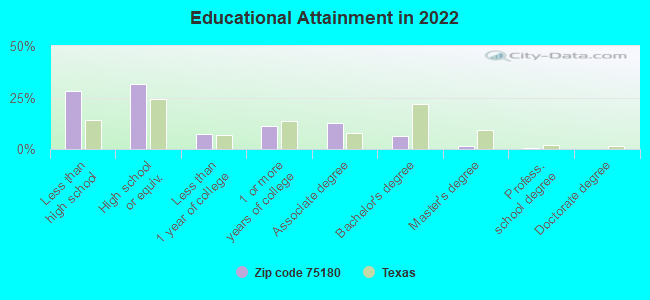
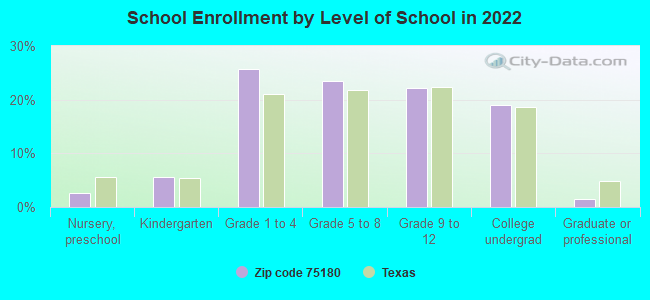
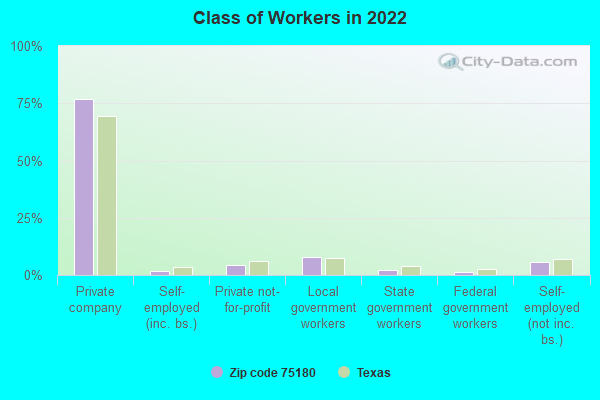
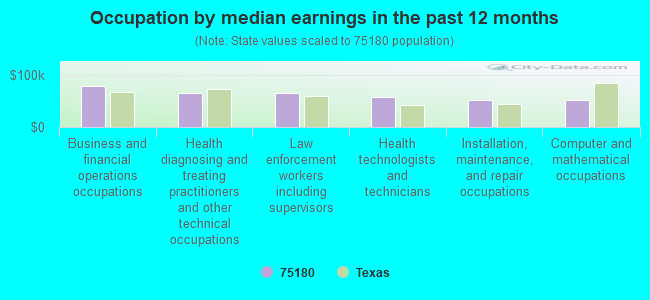
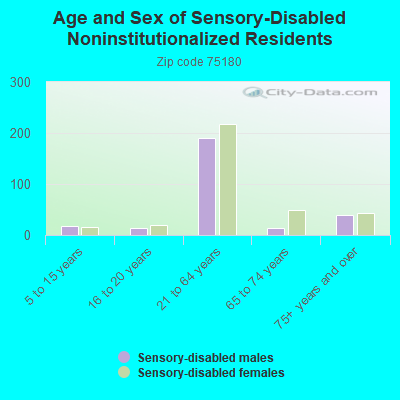
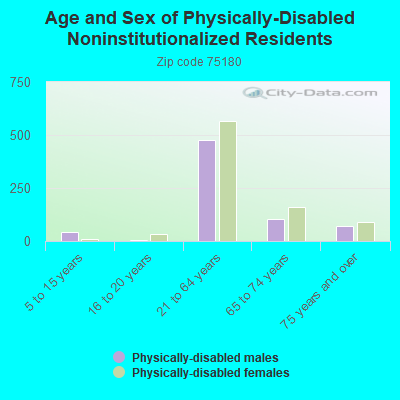
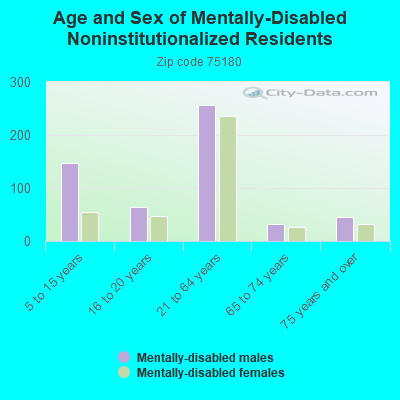
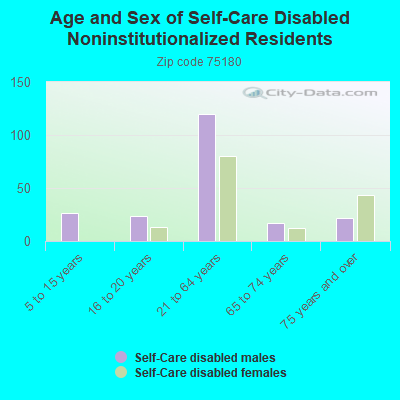
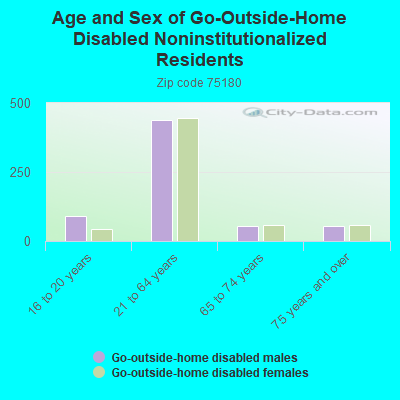
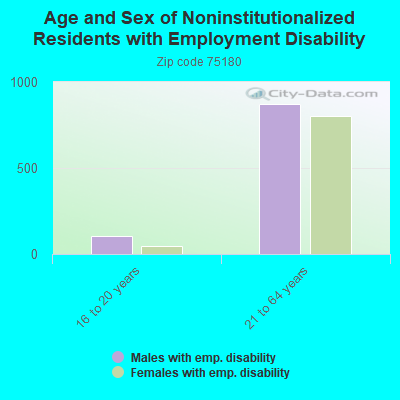
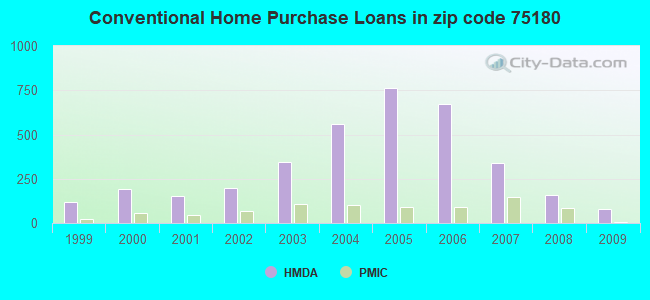
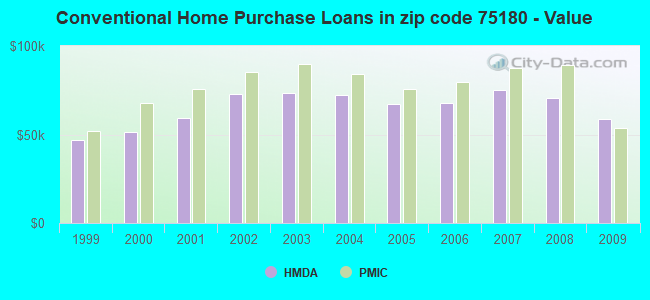
 According to the data from the years 2002 - 2018 the average number of fires per year is 105. The highest number of reported fires - 156 took place in 2006, and the least - 70 in 2012. The data has a rising trend.
 When looking into fire subcategories, the most reports belonged to: Outside Fires (49.1%), and Structure Fires (25.8%).