Estimated zip code population in 2022: 14,589 Zip code population in 2010: 13,653 Zip code population in 2000: 14,891
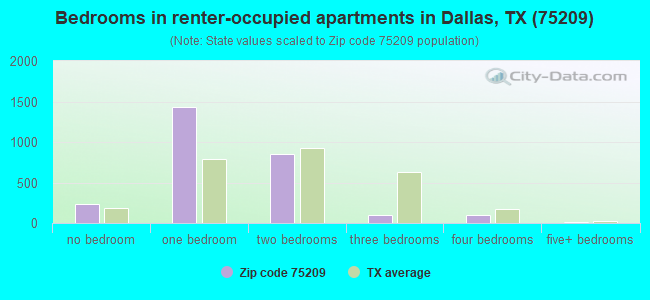
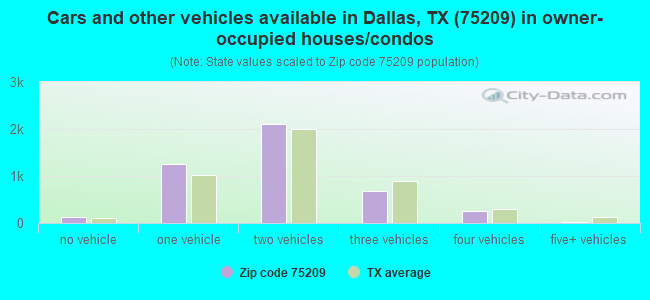
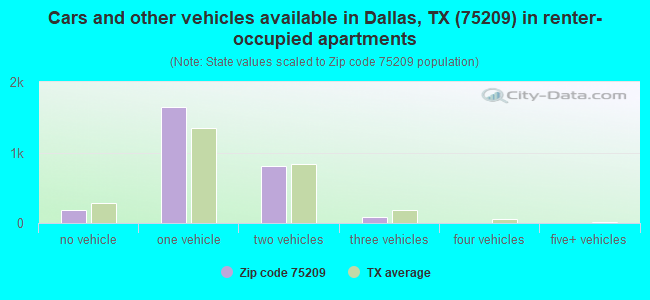
Houses and condos: 7,773 Renter-occupied apartments: 2,710
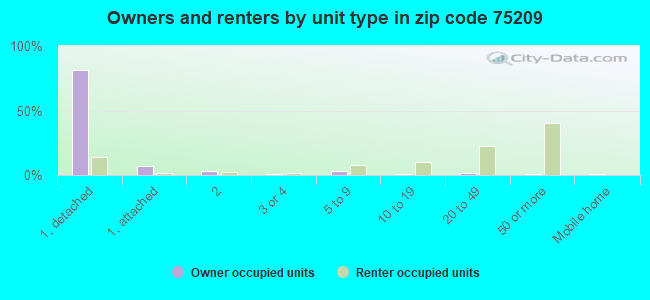
% of renters here:
38%
State:
38%
March 2022 cost of living index in zip code 75209: 100.2 (near average, U.S. average is 100)
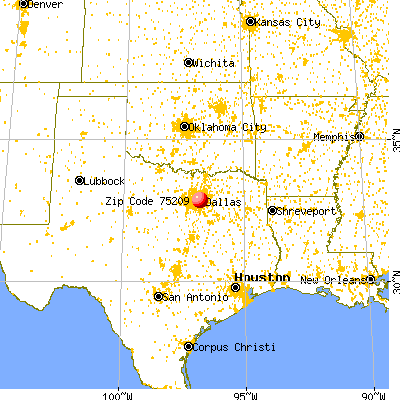
Land area: 3.5 sq. mi. Water area: 0.0 sq. mi.
Population density: 4,127 people per square mile
(average).
OSM Map
General Map
Google Map
MSN Map
OSM Map
General Map
Google Map
MSN Map
OSM Map
General Map
Google Map
MSN Map
OSM Map
General Map
Google Map
MSN Map
Please wait while loading the map...
Real estate property taxes paid for housing units in 2022:
This zip code:
1.2% ($10,460)
Texas:
1.5% ($4,050)
Median real estate property taxes paid for housing units with mortgages in 2022: $10,505 (1.1%) Median real estate property taxes paid for housing units with no mortgage in 2022: $8,899 (1.3%)
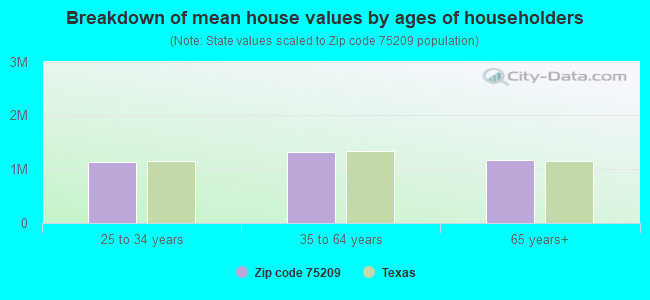
Estimated median house/condo value in 2022: $881,859
75209:
$881,859
Texas:
$275,400
According to our research of Texas and other state lists, there were 30 registered sex offenders living in 75209 zip code as of April 19, 2024. The ratio of all residents to sex offenders in zip code 75209 is 477 to 1. The ratio of registered sex offenders to all residents in this zip code is near the state average.
Median resident age:
This zip code:
40.2 years
Texas median age:
35.6 years
Average household size:
This zip code:
2.0 people
Texas:
2.6 people
Averages for the 2020 tax year for zip code 75209, filed in 2021:
Average Adjusted Gross Income (AGI) in 2020: $332,316 (Individual Income Tax Returns)
Here:
$332,316
State:
$77,054
Salary/wage: $189,424 (reported on 78.2% of returns)
Here:
$189,424
State:
$62,766
(% of AGI for various income ranges: 1257.6% for AGIs below $25k, 3790.3% for AGIs $25k-50k, 7171.6% for AGIs $50k-75k, 10640.9% for AGIs $75k-100k, 20115.1% for AGIs $100k-200k, 201251.4% for AGIs over 200k)
Taxable interest for individuals: $12,402 (reported on 44.1% of returns)
This zip code:
$12,402
Texas:
$2,665
(% of AGI for various income ranges: 32.3% for AGIs below $25k, 34.3% for AGIs $25k-50k, 76.6% for AGIs $50k-75k, 144.2% for AGIs $75k-100k, 353.2% for AGIs $100k-200k, 8580.5% for AGIs over 200k)
Ordinary dividends: $33,301 (reported on 43.3% of returns)
Here:
$33,301
State:
$10,044
(% of AGI for various income ranges: 124.5% for AGIs below $25k, 114.2% for AGIs $25k-50k, 333.8% for AGIs $50k-75k, 673.0% for AGIs $75k-100k, 1678.1% for AGIs $100k-200k, 21269.5% for AGIs over 200k)
Net capital gain/loss in AGI: +$218,124 (reported on 42.1% of returns)
Here:
+$218,124
State:
+$39,590
(% of AGI for various income ranges: 75.8% for AGIs below $25k, 81.5% for AGIs $25k-50k, 235.0% for AGIs $50k-75k, 426.1% for AGIs $75k-100k, 1992.6% for AGIs $100k-200k, 153503.9% for AGIs over 200k)
Profit/loss from business: +$55,335 (reported on 24.9% of returns)
Here:
+$55,335
State:
+$10,888
(% of AGI for various income ranges: 228.2% for AGIs below $25k, 239.4% for AGIs $25k-50k, 262.2% for AGIs $50k-75k, 708.8% for AGIs $75k-100k, 2168.7% for AGIs $100k-200k, 19219.5% for AGIs over 200k)
Taxable individual retirement arrangement distribution: $50,639 (reported on 8.5% of returns)
75209:
$50,639
Texas:
$24,740
(% of AGI for various income ranges: 57.1% for AGIs below $25k, 72.8% for AGIs $25k-50k, 171.4% for AGIs $50k-75k, 361.5% for AGIs $75k-100k, 1039.8% for AGIs $100k-200k, 5437.7% for AGIs over 200k)
Self-employed (Keogh) retirement plans: $38,917 (reported on 3.2% of returns)
75209:
$38,917
Texas:
$29,298
(% of AGI for various income ranges: 191.7% for AGIs $100k-200k, 1918.0% for AGIs over 200k)
Total itemized deductions: $67,127 (reported on 28.4% of returns)
Here:
$67,127
State:
$40,428
(% of AGI for various income ranges: 190.3% for AGIs below $25k, 256.6% for AGIs $25k-50k, 520.0% for AGIs $50k-75k, 1042.4% for AGIs $75k-100k, 2635.1% for AGIs $100k-200k, 27121.1% for AGIs over 200k)
Charity contributions: $37,720 (reported on 24.5% of returns)
Here:
$37,720
State:
$18,201
(% of AGI for various income ranges: 8.5% for AGIs below $25k, 35.8% for AGIs $25k-50k, 67.7% for AGIs $50k-75k, 171.5% for AGIs $75k-100k, 537.2% for AGIs $100k-200k, 14871.4% for AGIs over 200k)
Taxes paid: $9,183 (reported on 28.2% of returns)
75209:
$9,183
State:
$7,821
(% of AGI for various income ranges: 44.5% for AGIs below $25k, 50.5% for AGIs $25k-50k, 126.2% for AGIs $50k-75k, 292.1% for AGIs $75k-100k, 715.7% for AGIs $100k-200k, 3040.0% for AGIs over 200k)
Earned income credit: $1,963 (reported on 8.4% of returns)
Here:
$1,963
State:
$2,584
(% of AGI for various income ranges: 75.1% for AGIs below $25k, 48.1% for AGIs $25k-50k)
Percentage of individuals using paid preparers for their 2020 taxes: 92.1%
Here:
92%
State:
92%
(% for various income ranges: 87.6% for AGIs below $25k, 91.9% for AGIs $25k-50k, 91.7% for AGIs $50k-75k, 94.5% for AGIs $75k-100k, 93.1% for AGIs $100k-200k, 95.0% for AGIs over 200k)
Averages for the 2012 tax year for zip code 75209, filed in 2013:
Average Adjusted Gross Income (AGI) in 2012: $214,644 (Individual Income Tax Returns)
Here:
$214,644
State:
$65,384
Salary/wage: $114,801 (reported on 80.2% of returns)
Here:
$114,801
State:
$52,524
(% of AGI for various income ranges: 72.4% for AGIs below $25k, 84.9% for AGIs $25k-50k, 80.6% for AGIs $50k-75k, 74.7% for AGIs $75k-100k, 66.8% for AGIs $100k-200k, 35.1% for AGIs over 200k)
Taxable interest for individuals: $13,875 (reported on 42.0% of returns)
This zip code:
$13,875
Texas:
$2,372
(% of AGI for various income ranges: 1.6% for AGIs below $25k, 0.7% for AGIs $25k-50k, 1.2% for AGIs $50k-75k, 1.7% for AGIs $75k-100k, 1.3% for AGIs $100k-200k, 3.1% for AGIs over 200k)
Ordinary dividends: $27,176 (reported on 36.2% of returns)
Here:
$27,176
State:
$9,721
(% of AGI for various income ranges: 5.3% for AGIs below $25k, 3.3% for AGIs $25k-50k, 3.4% for AGIs $50k-75k, 3.9% for AGIs $75k-100k, 4.8% for AGIs $100k-200k, 4.7% for AGIs over 200k)
Net capital gain/loss in AGI: +$103,942 (reported on 33.8% of returns)
Here:
+$103,942
State:
+$35,319
(% of AGI for various income ranges: 2.1% for AGIs below $25k, 0.5% for AGIs $25k-50k, 1.1% for AGIs $50k-75k, 3.2% for AGIs $75k-100k, 3.9% for AGIs $100k-200k, 19.8% for AGIs over 200k)
Profit/loss from business: +$45,004 (reported on 23.6% of returns)
Here:
+$45,004
State:
+$13,732
(% of AGI for various income ranges: 12.1% for AGIs below $25k, 4.6% for AGIs $25k-50k, 3.8% for AGIs $50k-75k, 7.2% for AGIs $75k-100k, 8.2% for AGIs $100k-200k, 4.5% for AGIs over 200k)
Taxable individual retirement arrangement distribution: $51,404 (reported on 9.5% of returns)
75209:
$51,404
Texas:
$19,511
(% of AGI for various income ranges: 2.0% for AGIs below $25k, 1.6% for AGIs $25k-50k, 2.2% for AGIs $50k-75k, 2.9% for AGIs $75k-100k, 3.6% for AGIs $100k-200k, 2.2% for AGIs over 200k)
Self-employment retirement plans: $29,688 (reported on 3.1% of returns)
75209:
$29,688
Texas:
$23,938
(% of AGI for various income ranges: 0.5% for AGIs $50k-75k, 0.5% for AGIs $100k-200k, 0.5% for AGIs over 200k)
Total itemized deductions: $54,947 (12% of AGI, reported on 40.9% of returns)
Here:
$54,947
State:
$24,724
Here:
11.9% of AGI
State:
15.9% of AGI
(% of AGI for various income ranges: 14.5% for AGIs below $25k, 9.3% for AGIs $25k-50k, 13.9% for AGIs $50k-75k, 14.9% for AGIs $75k-100k, 16.7% for AGIs $100k-200k, 9.5% for AGIs over 200k)
Charity contributions: $19,835 (reported on 35.3% of returns)
Here:
$19,835
State:
$6,808
(% of AGI for various income ranges: 0.9% for AGIs below $25k, 1.0% for AGIs $25k-50k, 1.7% for AGIs $50k-75k, 2.2% for AGIs $75k-100k, 2.5% for AGIs $100k-200k, 3.6% for AGIs over 200k)
Taxes paid: $16,486 (reported on 40.3% of returns)
75209:
$16,486
State:
$6,921
(% of AGI for various income ranges: 4.4% for AGIs below $25k, 2.5% for AGIs $25k-50k, 4.5% for AGIs $50k-75k, 5.4% for AGIs $75k-100k, 6.2% for AGIs $100k-200k, 2.6% for AGIs over 200k)
Earned income credit: $2,179 (reported on 11.3% of returns)
Here:
$2,179
State:
$2,570
(% of AGI for various income ranges: 5.5% for AGIs below $25k, 0.6% for AGIs $25k-50k)
Percentage of individuals using paid preparers for their 2012 taxes: 57.2%
Here:
57%
State:
51%
(% for various income ranges: 52.5% for AGIs below $25k, 46.2% for AGIs $25k-50k, 47.9% for AGIs $50k-75k, 52.7% for AGIs $75k-100k, 64.9% for AGIs $100k-200k, 82.1% for AGIs over 200k)
Averages for the 2004 tax year for zip code 75209, filed in 2005:
Average Adjusted Gross Income (AGI) in 2004: $144,305 (Individual Income Tax Returns)
Here:
$144,305
State:
$47,881
Salary/wage: $92,799 (reported on 79.5% of returns)
Here:
$92,799
State:
$41,947
(% of AGI for various income ranges: 78.4% for AGIs $10k-25k, 83.7% for AGIs $25k-50k, 75.3% for AGIs $50k-75k, 69.3% for AGIs $75k-100k, 45.3% for AGIs over 100k)
Taxable interest for individuals: $7,590 (reported on 47.8% of returns)
This zip code:
$7,590
Texas:
$2,255
(% of AGI for various income ranges: 1.9% for AGIs $10k-25k, 1.4% for AGIs $25k-50k, 2.0% for AGIs $50k-75k, 1.5% for AGIs $75k-100k, 2.6% for AGIs over 100k)
Taxable dividends: $17,758 (reported on 37.5% of returns)
Here:
$17,758
State:
$4,261
(% of AGI for various income ranges: 2.5% for AGIs $10k-25k, 2.0% for AGIs $25k-50k, 3.9% for AGIs $50k-75k, 5.0% for AGIs $75k-100k, 4.8% for AGIs over 100k)
Net capital gain/loss: +$81,478 (reported on 36.0% of returns)
Here:
+$81,478
State:
+$16,110
(% of AGI for various income ranges: 0.7% for AGIs $10k-25k, 1.1% for AGIs $25k-50k, 2.0% for AGIs $50k-75k, 3.8% for AGIs $75k-100k, 23.9% for AGIs over 100k)
Profit/loss from business: +$27,342 (reported on 22.8% of returns)
Here:
+$27,342
State:
+$11,013
(% of AGI for various income ranges: 7.1% for AGIs $10k-25k, 4.6% for AGIs $25k-50k, 6.0% for AGIs $50k-75k, 9.6% for AGIs $75k-100k, 3.9% for AGIs over 100k)
IRA payment deduction: $3,369 (reported on 2.9% of returns)
75209:
$3,369
Texas:
$3,120
(% of AGI for various income ranges: 0.2% for AGIs $10k-25k, 0.2% for AGIs $25k-50k, 0.2% for AGIs $50k-75k, 0.2% for AGIs $75k-100k, 0.0% for AGIs over 100k)
Self-employed pension: $21,579 (reported on 3.3% of returns)
Here:
$21,579
Texas:
$16,401
(% of AGI for various income ranges: 0.2% for AGIs $25k-50k, 0.4% for AGIs $50k-75k, 0.6% for AGIs $75k-100k, 0.5% for AGIs over 100k)
Total itemized deductions: $37,521 (13% of AGI, reported on 42.7% of returns)
Here:
$37,521
State:
$19,631
Here:
13.0% of AGI
State:
18.9% of AGI
(% of AGI for various income ranges: 11.9% for AGIs $10k-25k, 12.5% for AGIs $25k-50k, 16.6% for AGIs $50k-75k, 20.7% for AGIs $75k-100k, 10.1% for AGIs over 100k)
Charity contributions deductions: $14,495 (5% of AGI, reported on 37.3% of returns)
Here:
$14,495
State:
$4,753
Here:
4.8% of AGI
State:
4.2% of AGI
(% of AGI for various income ranges: 1.4% for AGIs $10k-25k, 1.5% for AGIs $25k-50k, 2.2% for AGIs $50k-75k, 2.7% for AGIs $75k-100k, 4.1% for AGIs over 100k)
Total tax: $39,213 (reported on 78.7% of returns)
75209:
$39,213
State:
$9,058
(% of AGI for various income ranges: 4.3% for AGIs $10k-25k, 8.3% for AGIs $25k-50k, 12.5% for AGIs $50k-75k, 13.8% for AGIs $75k-100k, 23.5% for AGIs over 100k)
Earned income credit: $1,700 (reported on 12.3% of returns)
Here:
$1,700
State:
$2,024
Percentage of individuals using paid preparers for their 2004 taxes: 61.4%
Here:
61%
State:
57%
(% for various income ranges: 56.8% for AGIs below $10k, 62.0% for AGIs $10k-25k, 52.9% for AGIs $25k-50k, 52.1% for AGIs $50k-75k, 64.6% for AGIs $75k-100k, 75.5% for AGIs over 100k)
Likely homosexual households (counted as self-reported same-sex unmarried-partner households)
Lesbian couples: 0.2% of all households
Gay men: 0.3% of all households
Household received Food Stamps/SNAP in the past 12 months: 200 Household did not receive Food Stamps/SNAP in the past 12 months: 6,905
Women who had a birth in the past 12 months: 228 (191 now married, 38 unmarried) Women who did not have a birth in the past 12 months: 3,252 (1,525 now married, 1,724 unmarried)
Housing units in zip code 75209 with a mortgage: 2,605 (195 second mortgage, 172 both second mortgage and home equity loan) Houses without a mortgage: 163
Median monthly owner costs for units with a mortgage: $3,982 Median monthly owner costs for units without a mortgage: $1,302
Residents with income below the poverty level in 2022:
This zip code:
3.8%
Whole state:
14.0%
Residents with income below 50% of the poverty level in 2022:
This zip code:
2.2%
Whole state:
7.4%
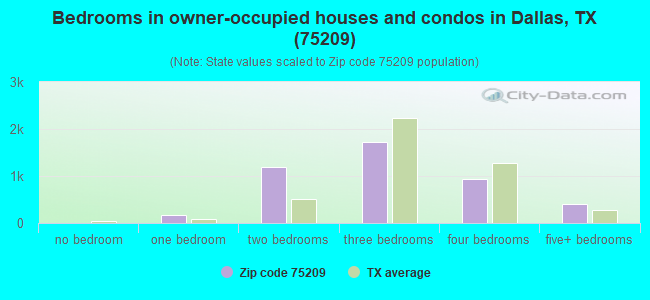
Median number of rooms in houses and condos:
Here:
6.6
State:
6.3
Median number of rooms in apartments:
Here:
3.1
State:
4.0
Notable locations in this zip code not listed on our city pages
Churches in zip code 75209 include: Westminster Presbyterian Church (A), North Park Church (B), Saint Lukes Baptist Church (C), Whitlow Missionary Baptist Church (D), Truth in Love Baptist Church (E), Saint Thomas the Apostle Church (F), Saint Thomas the Apostle Episcopal Church (G), Templo Sinani Assembly of God Church (H), Greater Zion Baptist Church (I). Display/hide their locations on the map
In group quarters: 116 (-1 institutionalized population)
Size of family households: 1,896 2-persons, 663 3-persons, 622 4-persons, 300 5-persons, 21 6-persons, 45 7-or-more-persons
Size of nonfamily households: 3,054 1-person, 603 2-persons, 4 3-persons
2,160 married couples with children.
175 single-parent households (69 men, 106 women).
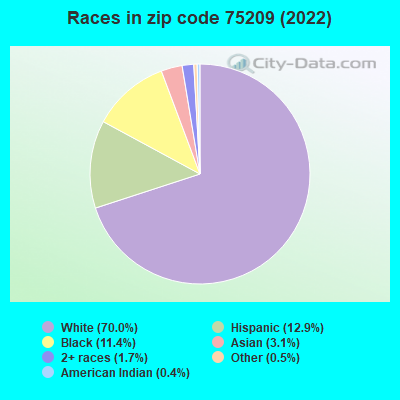
81.9% of residents of 75209 zip code speak English at home.
11.2% of residents speak Spanish at home (72% very well, 13% well, 15% not well).
4.7% of residents speak other Indo-European language at home (96% very well, 2% well, 2% not well).
1.3% of residents speak Asian or Pacific Island language at home (81% very well, 16% well, 3% not at all).
1.0% of residents speak other language at home (85% very well, 15% well).
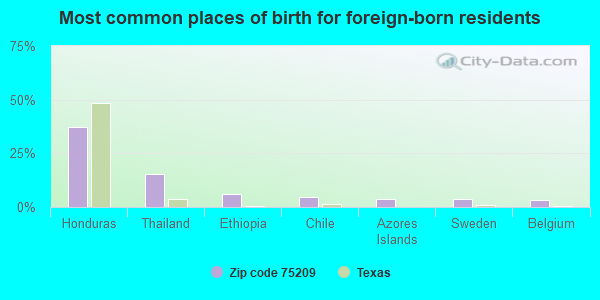
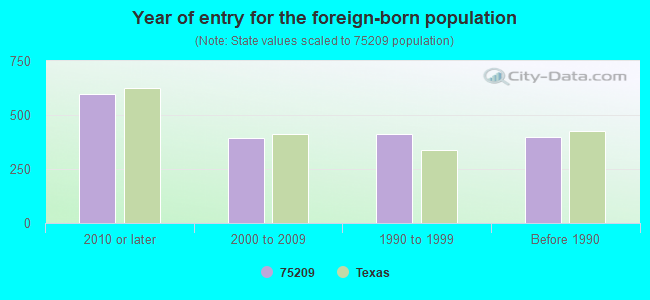
Foreign born population: 1,643 (11.3%) (61.0% of them are naturalized citizens)
Facilities with environmental interests located in this zip code:
ASSOCIATED AIR CENTER (7201 LEMMON in DALLAS, TX)
HAZARDOUS WASTE BIENNIAL REPORTER (Resource Conservation and Recovery Act (tracking hazardous waste)) Large Quantity Generators, more that 1000 kg of hazardous waste/month (Resource Conservation and Recovery Act (tracking hazardous waste)) TRI REPORTER (Tracking of toxic chemicals releasing facilities) Business SIC and NAICS classification: AIRCRAFT Organizations: ASSOCIATED AIR CENTER LP (CONTACT/OPERATOR)
AVIALL INC (7511 LEMMON AVE HANGAR C in DALLAS, TX)
(Resource Conservation and Recovery Act (tracking hazardous waste)) Business NAICS classification: OTHER AIRCRAFT PARTS AND AUXILIARY EQUIPMENT MANUFACTURING. Alternative names: RYDER AVIALL TURBINE PRINT, SIGNATURE REG MAINT CENTER
ASSOCIATED AIR CENTER (8201 LEMMON AVENUE BLDG A in DALLAS, TX)
HAZARDOUS WASTE BIENNIAL REPORTER (Resource Conservation and Recovery Act (tracking hazardous waste)) Small Quantity Generators, between 100 kg and 1000 kg of hazardous waste/month (Resource Conservation and Recovery Act (tracking hazardous waste)) - notification Business NAICS classification: AIRCRAFT MANUFACTURING. Organizations: ASSOCIATED AIR CENTER LP (CONTACT/OPERATOR)
7-ELEVEN #12205 (5223 WEST LOVERS LANE in DALLAS, TX)
ENFORCEMENT/COMPLIANCE ACTIVITY (Integrated Compliance Information System)
Housing units lacking complete kitchen facilities: 1.3%
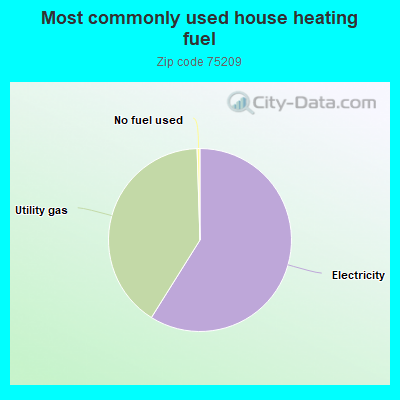
58.8%Electricity
40.5%Utility gas
0.5%No fuel used
Population in 1990: 15,398.
Place of birth for U.S.-born residents:
This state: 8,105
Northeast: 666
Midwest: 1,696
South: 1,598
West: 719
52% of the 75209 zip code residents lived in the same house 5 years ago. Out of people who lived in different houses, 71% lived in this county. Out of people who lived in different counties, 50% lived in Texas.
84% of the 75209 zip code residents lived in the same house 1 year ago. Out of people who lived in different houses, 62% moved from this county. Out of people who lived in different houses, 19% moved from different county within same state. Out of people who lived in different houses, 13% moved from different state. Out of people who lived in different houses, 4% moved from abroad.
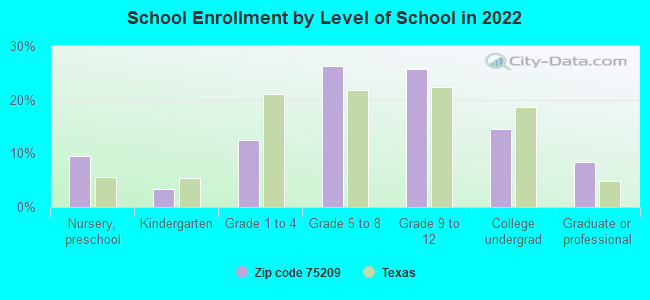
Private vs. public school enrollment:
Students in private schools in grades 1 to 8 (elementary and middle school): 635
Here:
68.8%
Texas:
8.8%
Students in private schools in grades 9 to 12 (high school): 353
Here:
57.8%
Texas:
8.0%
Students in private undergraduate colleges: 80
Here:
24.0%
Texas:
16.2%
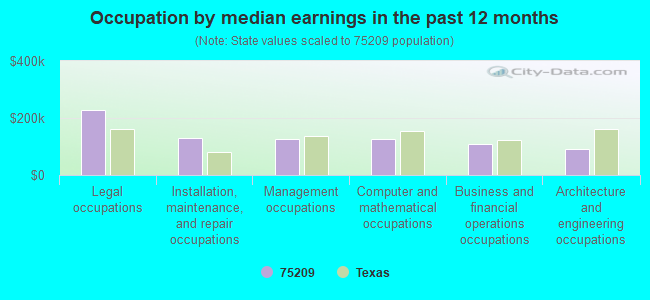
Occupation by median earnings in the past 12 months ($)
228,420Legal occupations
129,644Installation, maintenance, and repair occupations
127,286Management occupations
125,491Computer and mathematical occupations
108,892Business and financial operations occupations
92,583Architecture and engineering occupations
Companies with federal contracts located in this zip code:
R P KINCHELOE CO (4501 WEST MOCKINGBIRD LANE in DALLAS, TX) : $8,109,915 in 42 contractsfrom 1999 to 2004
Contracts for Maintenance, Repair and Rebuilding of Equipment -- Medical, Dental, and Veterinary Equipment and Supplies, Technical Representation Services -- Medical, Dental, and Veterinary Equipment and Supplies, Maintenance, Repair and Rebuilding of Equipment -- Instruments and Laboratory Equipment, X-Ray Equipment and Supplies: Medical, Dental, Veterinary, and moreby Air Force, Army, Department of Veterans Affairs Signed by year:2000: $794,980; 2001: $1,708,116; 2002: $3,726,266; 2003: $1,281,153; 2004: $120,000; 2005: $0; 2006: $0.
Biggest contracts:
$1,000,000 with Air Force for Maintenance, Repair and Rebuilding of Equipment -- Medical, Dental, and Veterinary Equipment and Supplies. Signed on 2002-05-28. Completion date: 2002-05-28.
$600,000 with Army for Technical Representation Services -- Medical, Dental, and Veterinary Equipment and Supplies. Signed on 2001-10-15. Completion date: 2002-09-30.
$525,000 with Army for Maintenance, Repair and Rebuilding of Equipment -- Medical, Dental, and Veterinary Equipment and Supplies. Signed on 2002-10-28. Completion date: 2003-09-30.
$500,000 with Air Force for Maintenance, Repair and Rebuilding of Equipment -- Medical, Dental, and Veterinary Equipment and Supplies. Signed on 2002-12-04. Completion date: 2003-09-30.
SIGNATURE FLIGHT SUPPORT (8001 LEMMON AVE HNGR 3 in DALLAS, TX) : $1,541,814 in 2 contractsfrom 2001 to 2004
$1,000,294 with Defense Logistics Agency for Liquid Propellants and Fuels, Petroleum Base. Signed on 2001-04-01. Completion date: 2004-03-31.
$541,520, same as above.Signed on 2004-01-27. Completion date: 2007-03-31.
COCA COLA BOTTLING COMPANY OF (6011 LEMMON AVENUE in DALLAS, TX) : $671,056 in 12 contractsfrom 2001 to 2006
Contracts for Food Items For Resale, Non-Food Items For Resale, Beverages, Nonalcoholic by Department of Defense, Defense Commissary Agency, Army, Bureau of Prisoners/Federal Prison System, and others Signed by year:2000: $0; 2001: $25,199; 2002: $87,016; 2003: $297,725; 2004: $58,428; 2005: $144,631; 2006: $58,057.
Biggest contracts:
$203,485 with Department of Defense for Food Items For Resale. Signed on 2003-01-01. Completion date: 2003-04-30.
$87,016, same as above.Signed on 2002-01-01. Completion date: 2002-09-30.
$68,538 with Defense Commissary Agency for Food Items For Resale. Signed on 2005-04-01. Completion date: 2005-08-31.
$64,740 with Department of Defense for Food Items For Resale. Signed on 2003-07-01. Completion date: 2003-07-31.
MEASUREMENT INTERNATIONAL (7611 INWOOD RD, BOX 7848 in DALLAS, TX; small business)
$75,309 with Army for Hazard-Detecting Instruments and Apparatus. Signed on 2004-09-16. Completion date: 2004-12-15.
sandra k. johnigan (7640 W> Greenway #8k in Dallas, TX; small business)
$30,000 with Offices, Boards and Divisions (includes Attorney General, Deputy Attorney General, etc.) for Expert Witness. Signed on 2004-06-01. Completion date: 2004-07-31.
AIRWAY MANAGEMENT LABS LLC (4264 W LOVERS LN in DALLAS, TX; small business)
$27,000 with Army for Dental Instruments, Equipment, and Supplies. Taking place in DC. Signed on 2006-04-20. Completion date: 2006-09-30.
PYXIS FINANCIAL CORP (No data from D and B in DALLAS, TX) 2 employees, $0 revenue
$27,000 with Department of Veterans Affairs for Lease or Rental of Equipment -- Medical, Dental, and Veterinary Equipment and Supplies. Signed on 1999-10-15. Completion date: 2000-09-15.
NORTH TEXAS COCA COLA BOTTLING (6011 LEMMON AVE in DALLAS, TX; small business)
$25,479 with Department of Defense for Food Items For Resale. Signed on 2000-01-31. Completion date: 2000-01-31.
HIBBS, JAMES E DDS (5600 W LOVERS LN STE 216 in DALLAS, TX; small business)
$3,040 with Army for Dentistry Services. Signed on 2004-07-23. Completion date: 2004-06-09.
Top industries in this zip code by the number of employees in 2005:
Management of Companies and Enterprises: Corporate, Subsidiary, and Regional Managing Offices (500-999 employees: 1 establishment, 20-49 employees: 1 establishment, 1-4 employees: 2 establishments)
2002 - 2018 National Fire Incident Reporting System (NFIRS) incidents
Based on the data from the years 2002 - 2018 the average number of fire incidents per year is 18. The highest number of reported fire incidents - 47 took place in 2003, and the least - 1 in 2008. The data has a decreasing trend.
When looking into fire subcategories, the most incidents belonged to: Outside Fires (33.6%), and Structure Fires (22.8%).
Fire incident types reported to NFIRS in Zip Code 75209


 Nearest zip codes: 75235, 75205, 75390, 75219, 75225, 75220.
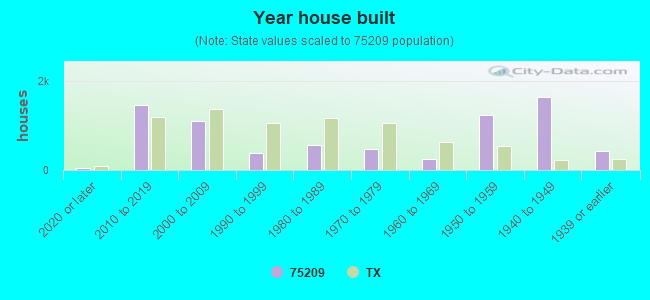


 Based on the data from the years 2002 - 2018 the average number of fire incidents per year is 18. The highest number of reported fire incidents - 47 took place in 2003, and the least - 1 in 2008. The data has a decreasing trend.
 When looking into fire subcategories, the most incidents belonged to: Outside Fires (33.6%), and Structure Fires (22.8%).