Estimated zip code population in 2022: 3,105 Zip code population in 2010: 2,982 Zip code population in 2000: 2,335
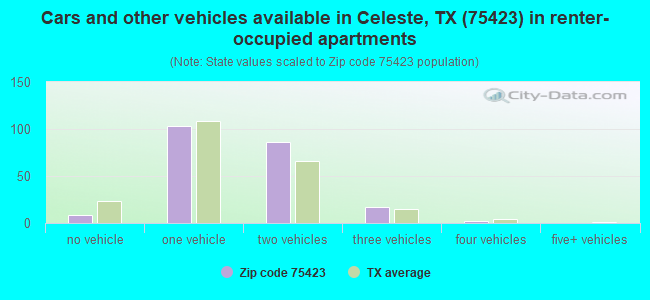
Houses and condos: 1,317 Renter-occupied apartments: 218
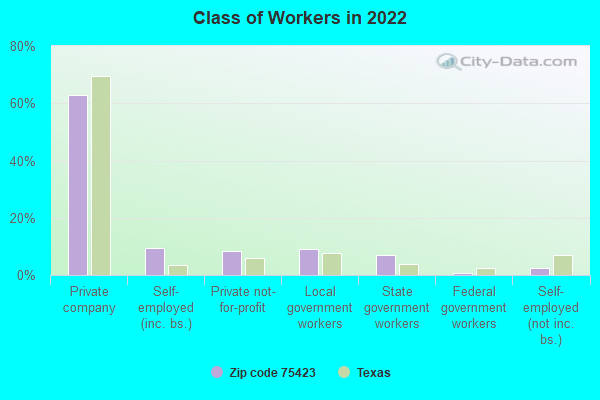
% of renters here:
19%
State:
38%
March 2022 cost of living index in zip code 75423: 84.1 (less than average, U.S. average is 100)
Land area: 81.2 sq. mi. Water area: 0.4 sq. mi.
Population density: 38 people per square mile
(very low).
OSM Map
General Map
Google Map
MSN Map
OSM Map
General Map
Google Map
MSN Map
OSM Map
General Map
Google Map
MSN Map
OSM Map
General Map
Google Map
MSN Map
Please wait while loading the map...
Real estate property taxes paid for housing units in 2022:
This zip code:
1.0% ($1,605)
Texas:
1.5% ($4,050)
Median real estate property taxes paid for housing units with mortgages in 2022: $2,388 (1.4%) Median real estate property taxes paid for housing units with no mortgage in 2022: $1,276 (1.1%)
Business Search- 14 Million verified businesses
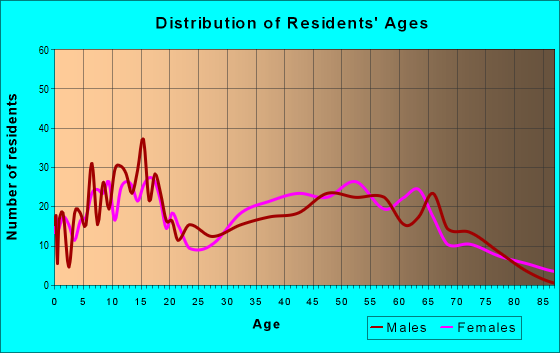
Males: 1,682
(54.2%)
Females: 1,422
(45.8%)
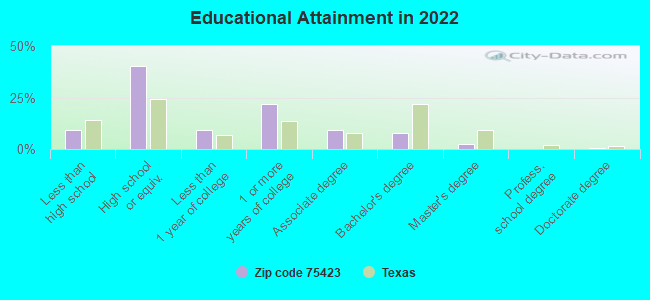
For population 25 years and over in 75423:
High school or higher: 89.6%
Bachelor's degree or higher: 10.3%
Graduate or professional degree: 2.8%
Unemployed: 4.7%
Mean travel time to work (commute): 38.2 minutes
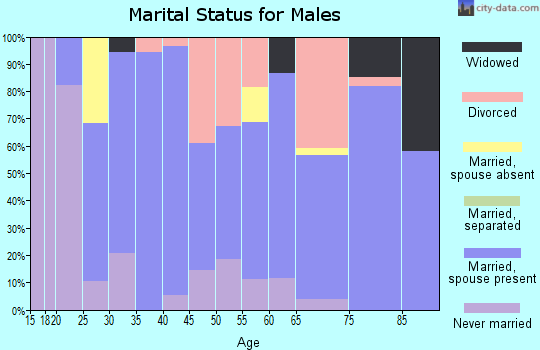
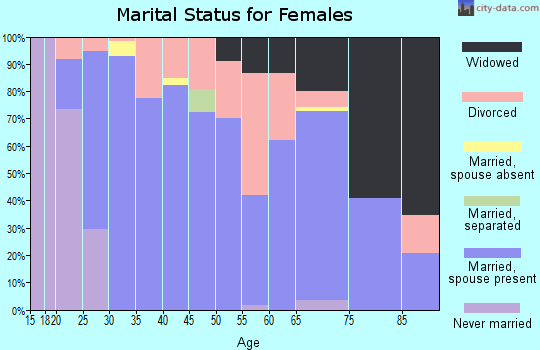
For population 15 years and over in 75423:
Never married: 23.9%
Now married: 49.9%
Separated: 2.9%
Widowed: 9.2%
Divorced: 14.0%
Zip code 75423 compared to state average:
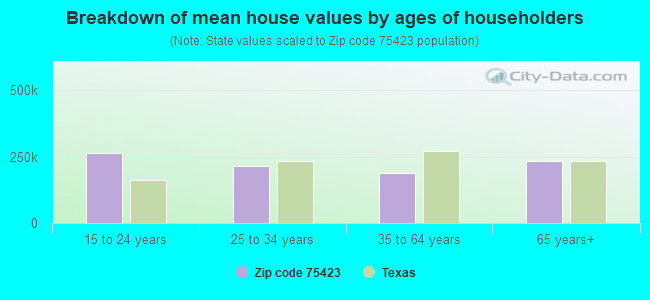
Median house value below state average.
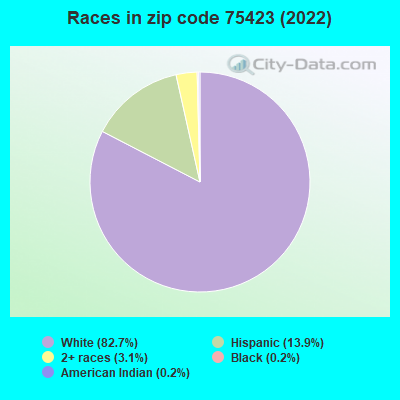
Black race population percentage significantly below state average.
Hispanic race population percentage below state average.
Median age above state average.
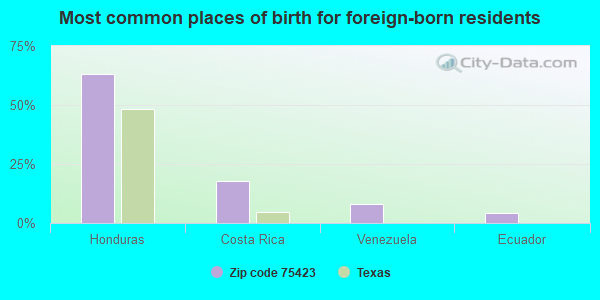
Foreign-born population percentage significantly below state average.
Renting percentage below state average.
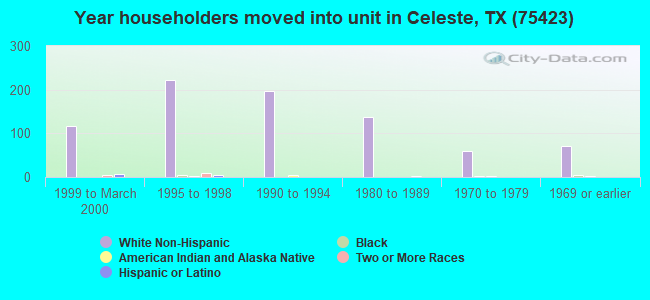
Length of stay since moving in significantly above state average.
Number of college students below state average.
Percentage of population with a bachelor's degree or higher significantly below state average.
Averages for the 2020 tax year for zip code 75423, filed in 2021:
Average Adjusted Gross Income (AGI) in 2020: $60,407 (Individual Income Tax Returns)
Here:
$60,407
State:
$77,054
Salary/wage: $56,376 (reported on 83.3% of returns)
Here:
$56,376
State:
$62,766
(% of AGI for various income ranges: 1168.8% for AGIs below $25k, 3779.6% for AGIs $25k-50k, 6477.6% for AGIs $50k-75k, 8779.2% for AGIs $75k-100k, 14206.7% for AGIs $100k-200k)
Taxable interest for individuals: $637 (reported on 21.7% of returns)
This zip code:
$637
Texas:
$2,665
(% of AGI for various income ranges: 12.2% for AGIs below $25k, 9.6% for AGIs $25k-50k, 15.9% for AGIs $50k-75k, 22.5% for AGIs $75k-100k, 26.7% for AGIs $100k-200k)
Ordinary dividends: $3,440 (reported on 10.9% of returns)
Here:
$3,440
State:
$10,044
(% of AGI for various income ranges: 21.2% for AGIs below $25k, 102.4% for AGIs $50k-75k, 182.7% for AGIs $100k-200k)
Net capital gain/loss in AGI: +$11,394 (reported on 11.6% of returns)
Here:
+$11,394
State:
+$39,590
(% of AGI for various income ranges: 28.7% for AGIs below $25k, 54.1% for AGIs $50k-75k, 37.5% for AGIs $75k-100k, 1062.7% for AGIs $100k-200k)
Profit/loss from business: +$7,048 (reported on 21.0% of returns)
Here:
+$7,048
State:
+$10,888
(% of AGI for various income ranges: 205.9% for AGIs below $25k, 70.7% for AGIs $25k-50k, 67.1% for AGIs $50k-75k, 351.7% for AGIs $75k-100k, 438.7% for AGIs $100k-200k)
Taxable individual retirement arrangement distribution: $17,070 (reported on 7.2% of returns)
75423:
$17,070
Texas:
$24,740
(% of AGI for various income ranges: 97.5% for AGIs below $25k, 240.0% for AGIs $50k-75k, 658.0% for AGIs $100k-200k)
Total itemized deductions: $31,086 (reported on 5.1% of returns)
Here:
$31,086
State:
$40,428
(% of AGI for various income ranges: 238.9% for AGIs $25k-50k, 1020.7% for AGIs $100k-200k)
Charity contributions: $16,300 (reported on 3.6% of returns)
Here:
$16,300
State:
$18,201
(% of AGI for various income ranges: 70.6% for AGIs below $25k, 392.7% for AGIs $100k-200k)
Taxes paid: $5,414 (reported on 5.1% of returns)
75423:
$5,414
State:
$7,821
(% of AGI for various income ranges: 50.4% for AGIs $25k-50k, 162.0% for AGIs $100k-200k)
Earned income credit: $2,581 (reported on 18.8% of returns)
Here:
$2,581
State:
$2,584
(% of AGI for various income ranges: 121.9% for AGIs below $25k, 104.1% for AGIs $25k-50k)
Percentage of individuals using paid preparers for their 2020 taxes: 94.2%
Here:
94%
State:
92%
(% for various income ranges: 93.2% for AGIs below $25k, 97.0% for AGIs $25k-50k, 95.5% for AGIs $50k-75k, 93.3% for AGIs $75k-100k, 90.0% for AGIs $100k-200k, 100.0% for AGIs over 200k)
Averages for the 2012 tax year for zip code 75423, filed in 2013:
Average Adjusted Gross Income (AGI) in 2012: $49,973 (Individual Income Tax Returns)
Here:
$49,973
State:
$65,384
Salary/wage: $47,904 (reported on 81.8% of returns)
Here:
$47,904
State:
$52,524
(% of AGI for various income ranges: 77.0% for AGIs below $25k, 78.4% for AGIs $25k-50k, 81.8% for AGIs $50k-75k, 80.6% for AGIs $75k-100k, 75.9% for AGIs $100k-200k)
Taxable interest for individuals: $843 (reported on 25.5% of returns)
This zip code:
$843
Texas:
$2,372
(% of AGI for various income ranges: 1.1% for AGIs below $25k, 0.4% for AGIs $25k-50k, 0.6% for AGIs $50k-75k, 0.3% for AGIs $75k-100k, 0.2% for AGIs $100k-200k)
Ordinary dividends: $2,471 (reported on 12.7% of returns)
Here:
$2,471
State:
$9,721
(% of AGI for various income ranges: 0.7% for AGIs below $25k, 1.1% for AGIs $25k-50k, 1.0% for AGIs $50k-75k, 0.1% for AGIs $75k-100k, 0.4% for AGIs $100k-200k)
Net capital gain/loss in AGI: +$664 (reported on 10.0% of returns)
Here:
+$664
State:
+$35,319
(% of AGI for various income ranges: 0.6% for AGIs $25k-50k, 0.4% for AGIs $50k-75k)
Profit/loss from business: +$7,309 (reported on 20.0% of returns)
Here:
+$7,309
State:
+$13,732
(% of AGI for various income ranges: 9.3% for AGIs below $25k, 2.5% for AGIs $25k-50k, 2.1% for AGIs $50k-75k, 1.6% for AGIs $75k-100k, 2.5% for AGIs $100k-200k)
Taxable individual retirement arrangement distribution: $17,050 (reported on 10.9% of returns)
75423:
$17,050
Texas:
$19,511
(% of AGI for various income ranges: 4.6% for AGIs below $25k, 4.9% for AGIs $25k-50k, 13.3% for AGIs $75k-100k)
Total itemized deductions: $20,500 (24% of AGI, reported on 19.1% of returns)
Here:
$20,500
State:
$24,724
Here:
23.6% of AGI
State:
15.9% of AGI
(% of AGI for various income ranges: 6.1% for AGIs below $25k, 6.9% for AGIs $25k-50k, 6.2% for AGIs $50k-75k, 8.7% for AGIs $75k-100k, 9.2% for AGIs $100k-200k)
Charity contributions: $5,424 (reported on 15.5% of returns)
Here:
$5,424
State:
$6,808
(% of AGI for various income ranges: 1.6% for AGIs $25k-50k, 0.9% for AGIs $50k-75k, 1.9% for AGIs $75k-100k, 2.5% for AGIs $100k-200k)
Taxes paid: $4,624 (reported on 19.1% of returns)
75423:
$4,624
State:
$6,921
(% of AGI for various income ranges: 1.2% for AGIs below $25k, 1.3% for AGIs $25k-50k, 1.4% for AGIs $50k-75k, 1.9% for AGIs $75k-100k, 2.3% for AGIs $100k-200k)
Earned income credit: $2,300 (reported on 21.8% of returns)
Here:
$2,300
State:
$2,570
(% of AGI for various income ranges: 7.6% for AGIs below $25k, 1.5% for AGIs $25k-50k)
Percentage of individuals using paid preparers for their 2012 taxes: 50.9%
Here:
51%
State:
51%
(% for various income ranges: 46.5% for AGIs below $25k, 53.8% for AGIs $25k-50k, 52.9% for AGIs $50k-75k, 50.0% for AGIs $75k-100k, 58.3% for AGIs $100k-200k)
Averages for the 2004 tax year for zip code 75423, filed in 2005:
Average Adjusted Gross Income (AGI) in 2004: $40,209 (Individual Income Tax Returns)
Here:
$40,209
State:
$47,881
Salary/wage: $40,522 (reported on 84.3% of returns)
Here:
$40,522
State:
$41,947
(% of AGI for various income ranges: 102.6% for AGIs below $10k, 77.2% for AGIs $10k-25k, 88.7% for AGIs $25k-50k, 89.8% for AGIs $50k-75k, 88.1% for AGIs $75k-100k, 77.6% for AGIs over 100k)
Taxable interest for individuals: $1,003 (reported on 32.1% of returns)
This zip code:
$1,003
Texas:
$2,255
(% of AGI for various income ranges: 3.7% for AGIs below $10k, 1.8% for AGIs $10k-25k, 0.9% for AGIs $25k-50k, 0.5% for AGIs $50k-75k, 0.3% for AGIs $75k-100k, 0.7% for AGIs over 100k)
Taxable dividends: $1,514 (reported on 14.5% of returns)
Here:
$1,514
State:
$4,261
(% of AGI for various income ranges: 2.4% for AGIs below $10k, 0.6% for AGIs $10k-25k, 0.1% for AGIs $25k-50k, 0.5% for AGIs $50k-75k, 0.4% for AGIs $75k-100k, 0.8% for AGIs over 100k)
Net capital gain/loss: +$727 (reported on 13.1% of returns)
Here:
+$727
State:
+$16,110
(% of AGI for various income ranges: 3.3% for AGIs below $10k, -0.5% for AGIs $10k-25k, 0.8% for AGIs $25k-50k, 0.3% for AGIs $50k-75k, -0.1% for AGIs $75k-100k, 0.0% for AGIs over 100k)
Profit/loss from business: +$1,400 (reported on 17.9% of returns)
Here:
+$1,400
State:
+$11,013
(% of AGI for various income ranges: 11.8% for AGIs below $10k, 5.7% for AGIs $10k-25k, -2.0% for AGIs $25k-50k, 0.6% for AGIs $50k-75k, 0.9% for AGIs $75k-100k, -0.3% for AGIs over 100k)
Total itemized deductions: $17,383 (24% of AGI, reported on 19.1% of returns)
Here:
$17,383
State:
$19,631
Here:
23.6% of AGI
State:
18.9% of AGI
(% of AGI for various income ranges: 6.8% for AGIs $10k-25k, 7.5% for AGIs $25k-50k, 9.4% for AGIs $50k-75k, 8.7% for AGIs $75k-100k, 8.9% for AGIs over 100k)
Charity contributions deductions: $4,664 (6% of AGI, reported on 15.1% of returns)
Here:
$4,664
State:
$4,753
Here:
6.1% of AGI
State:
4.2% of AGI
(% of AGI for various income ranges: 1.0% for AGIs $10k-25k, 1.1% for AGIs $25k-50k, 1.6% for AGIs $50k-75k, 1.9% for AGIs $75k-100k, 2.8% for AGIs over 100k)
Total tax: $5,784 (reported on 71.0% of returns)
75423:
$5,784
State:
$9,058
(% of AGI for various income ranges: 3.4% for AGIs below $10k, 3.8% for AGIs $10k-25k, 5.8% for AGIs $25k-50k, 7.6% for AGIs $50k-75k, 10.6% for AGIs $75k-100k, 19.2% for AGIs over 100k)
Earned income credit: $1,963 (reported on 21.5% of returns)
Here:
$1,963
State:
$2,024
Percentage of individuals using paid preparers for their 2004 taxes: 59.2%
Here:
59%
State:
57%
(% for various income ranges: 46.4% for AGIs below $10k, 65.3% for AGIs $10k-25k, 63.8% for AGIs $25k-50k, 64.0% for AGIs $50k-75k, 48.1% for AGIs $75k-100k, 60.7% for AGIs over 100k)
Household received Food Stamps/SNAP in the past 12 months: 171 Household did not receive Food Stamps/SNAP in the past 12 months: 983
Women who had a birth in the past 12 months: 32 (14 now married, 16 unmarried) Women who did not have a birth in the past 12 months: 606 (311 now married, 293 unmarried)
Housing units in zip code 75423 with a mortgage: 407 (4 second mortgage, 5 both second mortgage and home equity loan) Houses without a mortgage: 3
Median monthly owner costs for units with a mortgage: $1,267 Median monthly owner costs for units without a mortgage: $486
Residents with income below the poverty level in 2022:
This zip code:
14.9%
Whole state:
14.0%
Residents with income below 50% of the poverty level in 2022:
This zip code:
12.3%
Whole state:
7.4%
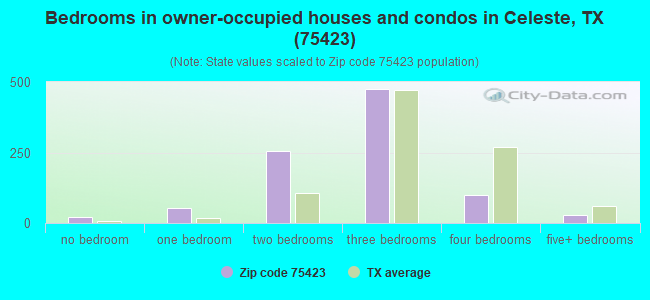
Median number of rooms in houses and condos:
Here:
5.5
State:
6.3
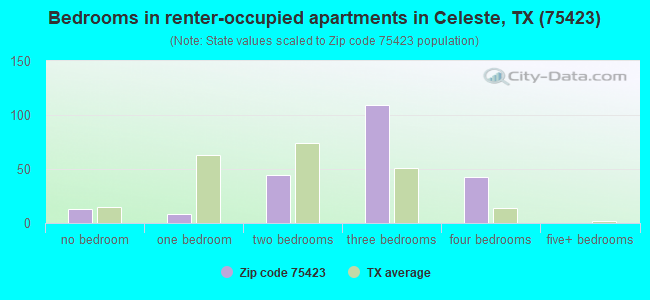
Median number of rooms in apartments:
Here:
5.0
State:
4.0
Notable locations in this zip code not listed on our city pages
Cemeteries: Nicholson Cemetery (1), Lane Cemetery (2), Kingston Cemetery (3), Merit Cemetery (4), Du Laney Cemetery (5), Celeste Cemetery (6). Display/hide their locations on the map
Reservoirs: Soil Conservation Service Site 62 Reservoir (A), Soil Conservation Service Site 65 Reservoir (B), Soil Conservation Service Site 64a Reservoir (C), Soil Conservation Service Site 67 Reservoir (D), Soil Conservation Service Site 69 Reservoir (E). Display/hide their locations on the map
380 married couples with children.
184 single-parent households (4 men, 180 women).
93.4% of residents of 75423 zip code speak English at home.
6.8% of residents speak Spanish at home (96% very well, 4% well).
Foreign born population: 136 (4.4%) (38.9% of them are naturalized citizens)
This zip code:
4.4%
Whole state:
17.2%
63%Honduras
18%Costa Rica
8%Venezuela
4%Ecuador
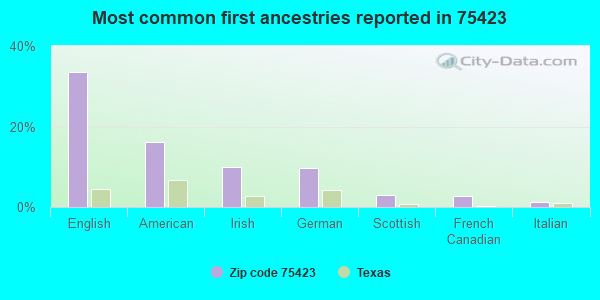
34%English
16%American
10%Irish
10%German
3%Scottish
3%French Canadian
1%Italian
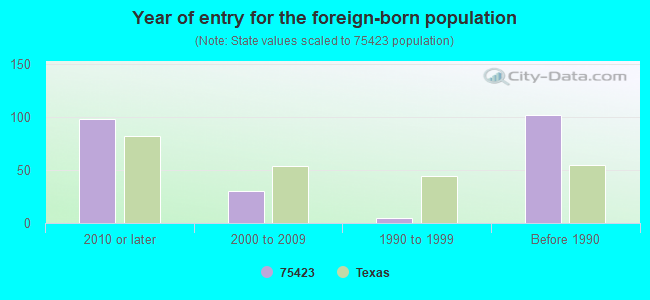
Year of entry for the foreign-born population
982010 or later
302000 to 2009
51990 to 1999
102Before 1990
Housing units lacking complete plumbing facilities: 8.1% Housing units lacking complete kitchen facilities: 5.7%
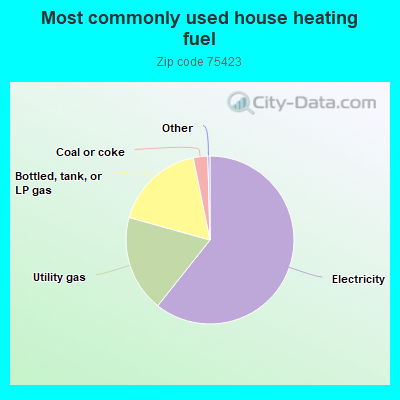
60.8%Electricity
18.7%Utility gas
17.5%Bottled, tank, or LP gas
2.8%Coal or coke
Population in 1990: 2,697.
Place of birth for U.S.-born residents:
This state: 2,101
Northeast: 69
Midwest: 302
South: 317
West: 64
56% of the 75423 zip code residents lived in the same house 5 years ago. Out of people who lived in different houses, 45% lived in this county. Out of people who lived in different counties, 50% lived in Texas.
88% of the 75423 zip code residents lived in the same house 1 year ago. Out of people who lived in different houses, 25% moved from this county. Out of people who lived in different houses, 73% moved from different county within same state. Out of people who lived in different houses, 3% moved from different state.
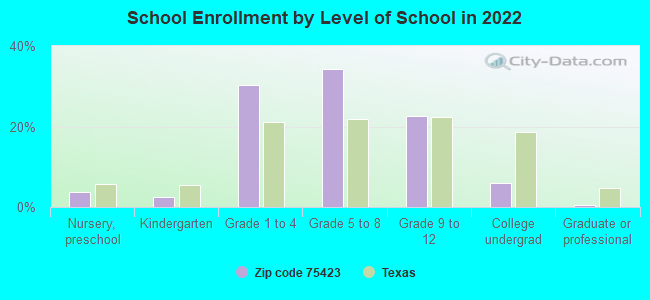
Private vs. public school enrollment:
Students in private schools in grades 1 to 8 (elementary and middle school): 71
Here:
14.2%
Texas:
8.8%
Students in private schools in grades 9 to 12 (high school): 56
Here:
31.5%
Texas:
8.0%
Students in private undergraduate colleges:
Here:
0.0%
Texas:
16.2%
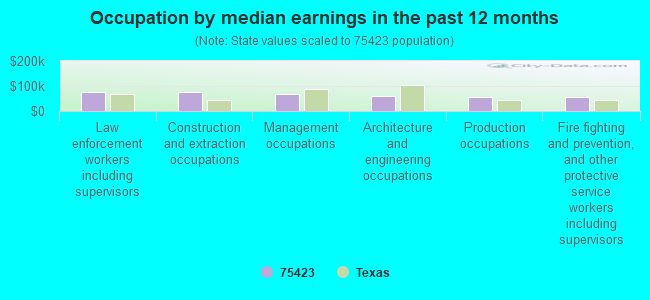
Occupation by median earnings in the past 12 months ($)
76,569Law enforcement workers including supervisors
75,731Construction and extraction occupations
67,488Management occupations
59,888Architecture and engineering occupations
57,780Production occupations
55,133Fire fighting and prevention, and other protective service workers including supervisors
Companies with federal contracts located in this zip code:
S & S ENVIRONMENTAL (HWY 69 & CR 1040 in CELESTE, TX; small business) : $111,365 in 3 contractsfrom 1999 to 2000
$56,066 with Army for Other Quality Control, Testing and Inspection Services -- Miscellaneous. Signed on 2000-10-20. Completion date: 2001-09-30.
$55,299 with U.S. Army Corps of Engineers - civil program financing only for Other Quality Control, Testing and Inspection Services -- Miscellaneous. Signed on 1999-11-02. Completion date: 2000-09-30.
$0, same as above.Signed on 1999-11-02. Completion date: 2000-09-30.
BROWN WOLF ENGINEERING INC (5365 COUNTY ROAD 1037 in CELESTE, TX; small business)
$88,990 with Air Force for Engineering and Technical Services. Signed on 2002-09-06. Completion date: 2002-12-31.
TEDDY COLE (401 W MARSALIS ST in CELESTE, TX; small business) : $14,955 in 2 contractsfrom 2004 to 2006
$8,125 with Army for Guard Services. Signed on 2004-02-25. Completion date: 2004-09-30.
$6,830 with Army for Recreation Site Maintenance Services (non-construction). Signed on 2006-03-29. Completion date: 2006-04-01.
Top industries in this zip code by the number of employees in 2005:
Other Services (except Public Administration): Cemeteries and Crematories (50-99 employees: 1 establishment)
Other Services (except Public Administration): Religious Organizations (10-19: 1, 1-4: 1)
Real Estate and Rental and Leasing: Lessors of Residential Buildings and Dwellings (10-19: 1, 1-4: 1)
Educational Services: Fine Arts Schools (10-19: 1)
Finance and Insurance: Commercial Banking (10-19: 1)
Finance and Insurance: Insurance Agencies and Brokerages (5-9: 1)
Construction: New Single-Family Housing Construction (except Operative Builders) (1-4: 2)
Management of Companies and Enterprises: Offices of Bank Holding Companies (1-4: 2)
Health Care and Social Assistance: Offices of All Other Miscellaneous Health Practitioners (1-4: 1)
Fatal accident statistics in 2012:
Fatal accident count: 1
Vehicles involved in fatal accidents: 2
Fatal accidents caused by drunken drivers: 0
Fatalities: 3
Persons involved in fatal accidents: 3
Pedestrians involved in fatal accidents: 0
Home Mortgage Disclosure Act Aggregated Statistics For Year 2009 (Based on 2 partial tracts)
A) FHA, FSA/RHS & VA Home Purchase Loans
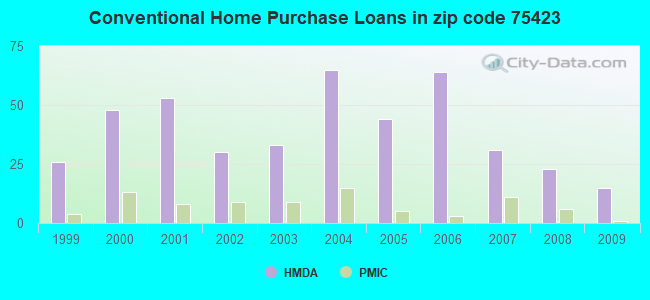
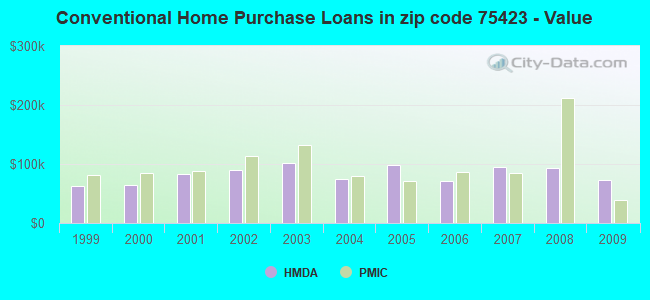
B) Conventional Home Purchase Loans
C) Refinancings
D) Home Improvement Loans
F) Non-occupant Loans on < 5 Family Dwellings (A B C & D)
G) Loans On Manufactured Home Dwelling (A B C & D)
Number
Average Value
Number
Average Value
Number
Average Value
Number
Average Value
Number
Average Value
Number
Average Value
LOANS ORIGINATED
14
$107,499
15
$72,457
31
$135,040
4
$12,280
6
$60,452
6
$56,043
APPLICATIONS APPROVED, NOT ACCEPTED
1
$78,080
6
$141,683
1
$143,570
1
$44,080
0
$0
3
$42,400
APPLICATIONS DENIED
11
$127,199
13
$43,788
19
$135,021
6
$21,410
4
$44,708
13
$50,085
APPLICATIONS WITHDRAWN
3
$112,087
0
$0
9
$130,558
3
$17,213
1
$235,510
0
$0
FILES CLOSED FOR INCOMPLETENESS
0
$0
0
$0
5
$125,436
1
$44,080
0
$0
0
$0
Aggregated Statistics For Year 2008 (Based on 2 partial tracts)
A) FHA, FSA/RHS & VA Home Purchase Loans
B) Conventional Home Purchase Loans
C) Refinancings
D) Home Improvement Loans
F) Non-occupant Loans on < 5 Family Dwellings (A B C & D)
G) Loans On Manufactured Home Dwelling (A B C & D)
Number
Average Value
Number
Average Value
Number
Average Value
Number
Average Value
Number
Average Value
Number
Average Value
LOANS ORIGINATED
13
$97,265
23
$93,415
28
$125,265
8
$24,716
8
$53,525
11
$83,006
APPLICATIONS APPROVED, NOT ACCEPTED
0
$0
4
$116,180
8
$131,922
1
$37,780
0
$0
3
$51,217
APPLICATIONS DENIED
5
$61,710
6
$187,650
35
$108,956
25
$53,147
9
$148,469
4
$70,212
APPLICATIONS WITHDRAWN
3
$94,457
4
$206,542
23
$127,309
3
$33,583
0
$0
1
$80,600
FILES CLOSED FOR INCOMPLETENESS
0
$0
0
$0
4
$122,792
0
$0
1
$57,930
1
$62,970
Aggregated Statistics For Year 2007 (Based on 2 partial tracts)
A) FHA, FSA/RHS & VA Home Purchase Loans
B) Conventional Home Purchase Loans
C) Refinancings
D) Home Improvement Loans
F) Non-occupant Loans on < 5 Family Dwellings (A B C & D)
G) Loans On Manufactured Home Dwelling (A B C & D)
Number
Average Value
Number
Average Value
Number
Average Value
Number
Average Value
Number
Average Value
Number
Average Value
LOANS ORIGINATED
11
$103,729
31
$94,171
31
$88,117
9
$35,123
9
$54,993
9
$60,591
APPLICATIONS APPROVED, NOT ACCEPTED
1
$76,820
9
$110,548
8
$163,880
0
$0
1
$78,080
1
$81,860
APPLICATIONS DENIED
1
$139,790
15
$55,413
48
$121,034
11
$17,403
1
$34,000
6
$54,993
APPLICATIONS WITHDRAWN
3
$95,713
4
$76,192
13
$106,371
0
$0
1
$18,890
0
$0
FILES CLOSED FOR INCOMPLETENESS
0
$0
1
$113,350
4
$110,512
0
$0
0
$0
0
$0
Aggregated Statistics For Year 2006 (Based on 2 partial tracts)
A) FHA, FSA/RHS & VA Home Purchase Loans
B) Conventional Home Purchase Loans
C) Refinancings
D) Home Improvement Loans
F) Non-occupant Loans on < 5 Family Dwellings (A B C & D)
G) Loans On Manufactured Home Dwelling (A B C & D)
Number
Average Value
Number
Average Value
Number
Average Value
Number
Average Value
Number
Average Value
Number
Average Value
LOANS ORIGINATED
10
$105,664
64
$70,841
35
$104,098
11
$53,238
16
$58,248
16
$72,652
APPLICATIONS APPROVED, NOT ACCEPTED
1
$161,200
11
$62,054
5
$92,440
4
$26,762
1
$40,300
8
$81,389
APPLICATIONS DENIED
1
$113,350
34
$67,304
42
$92,476
15
$32,157
3
$35,683
16
$46,283
APPLICATIONS WITHDRAWN
1
$110,830
3
$75,983
18
$88,438
5
$39,294
1
$204,020
1
$125,940
FILES CLOSED FOR INCOMPLETENESS
0
$0
0
$0
8
$96,029
3
$19,730
0
$0
0
$0
Aggregated Statistics For Year 2005 (Based on 2 partial tracts)
A) FHA, FSA/RHS & VA Home Purchase Loans
B) Conventional Home Purchase Loans
C) Refinancings
D) Home Improvement Loans
F) Non-occupant Loans on < 5 Family Dwellings (A B C & D)
G) Loans On Manufactured Home Dwelling (A B C & D)
Number
Average Value
Number
Average Value
Number
Average Value
Number
Average Value
Number
Average Value
Number
Average Value
LOANS ORIGINATED
6
$108,938
44
$97,861
59
$102,588
14
$31,485
6
$51,635
14
$77,813
APPLICATIONS APPROVED, NOT ACCEPTED
0
$0
9
$82,701
3
$104,950
5
$46,094
0
$0
5
$53,146
APPLICATIONS DENIED
0
$0
28
$104,215
40
$86,048
19
$59,523
5
$94,204
11
$66,405
APPLICATIONS WITHDRAWN
1
$83,120
1
$73,050
38
$110,032
3
$84,380
1
$100,750
1
$83,120
FILES CLOSED FOR INCOMPLETENESS
0
$0
5
$78,586
5
$106,294
0
$0
0
$0
1
$128,460
Aggregated Statistics For Year 2004 (Based on 2 partial tracts)
A) FHA, FSA/RHS & VA Home Purchase Loans
B) Conventional Home Purchase Loans
C) Refinancings
D) Home Improvement Loans
F) Non-occupant Loans on < 5 Family Dwellings (A B C & D)
G) Loans On Manufactured Home Dwelling (A B C & D)
Number
Average Value
Number
Average Value
Number
Average Value
Number
Average Value
Number
Average Value
Number
Average Value
LOANS ORIGINATED
11
$105,332
65
$75,409
71
$99,120
6
$85,010
14
$60,181
20
$103,460
APPLICATIONS APPROVED, NOT ACCEPTED
0
$0
8
$69,739
6
$124,890
4
$11,335
1
$59,190
3
$84,800
APPLICATIONS DENIED
0
$0
18
$89,837
57
$85,065
34
$43,375
1
$25,190
13
$68,105
APPLICATIONS WITHDRAWN
1
$46,600
1
$54,150
47
$96,652
1
$25,190
0
$0
3
$31,487
FILES CLOSED FOR INCOMPLETENESS
0
$0
4
$37,152
6
$112,717
0
$0
0
$0
0
$0
Aggregated Statistics For Year 2003 (Based on 2 partial tracts)
A) FHA, FSA/RHS & VA Home Purchase Loans
B) Conventional Home Purchase Loans
C) Refinancings
D) Home Improvement Loans
F) Non-occupant Loans on < 5 Family Dwellings (A B C & D)
Number
Average Value
Number
Average Value
Number
Average Value
Number
Average Value
Number
Average Value
LOANS ORIGINATED
13
$72,367
33
$101,706
113
$100,540
14
$22,309
10
$38,790
APPLICATIONS APPROVED, NOT ACCEPTED
1
$83,120
8
$103,586
15
$84,548
3
$20,990
0
$0
APPLICATIONS DENIED
1
$137,270
21
$64,649
58
$69,137
10
$18,135
1
$62,970
APPLICATIONS WITHDRAWN
3
$99,913
9
$50,516
38
$92,500
3
$34,003
4
$25,818
FILES CLOSED FOR INCOMPLETENESS
0
$0
4
$68,638
4
$63,915
3
$37,783
0
$0
Aggregated Statistics For Year 2002 (Based on 2 partial tracts)
A) FHA, FSA/RHS & VA Home Purchase Loans
B) Conventional Home Purchase Loans
C) Refinancings
D) Home Improvement Loans
F) Non-occupant Loans on < 5 Family Dwellings (A B C & D)
Number
Average Value
Number
Average Value
Number
Average Value
Number
Average Value
Number
Average Value
LOANS ORIGINATED
11
$77,510
30
$89,963
45
$87,878
13
$28,675
3
$44,920
APPLICATIONS APPROVED, NOT ACCEPTED
0
$0
8
$27,864
10
$104,656
0
$0
1
$39,040
APPLICATIONS DENIED
1
$164,980
18
$44,849
29
$75,911
8
$12,751
0
$0
APPLICATIONS WITHDRAWN
1
$86,900
4
$39,670
15
$66,748
0
$0
0
$0
FILES CLOSED FOR INCOMPLETENESS
0
$0
1
$41,560
4
$76,508
0
$0
0
$0
Aggregated Statistics For Year 2001 (Based on 2 partial tracts)
A) FHA, FSA/RHS & VA Home Purchase Loans
B) Conventional Home Purchase Loans
C) Refinancings
D) Home Improvement Loans
F) Non-occupant Loans on < 5 Family Dwellings (A B C & D)
Number
Average Value
Number
Average Value
Number
Average Value
Number
Average Value
Number
Average Value
LOANS ORIGINATED
8
$85,639
53
$83,144
47
$84,621
11
$20,837
5
$47,606
APPLICATIONS APPROVED, NOT ACCEPTED
0
$0
11
$45,224
10
$55,036
3
$12,593
3
$28,967
APPLICATIONS DENIED
0
$0
47
$45,151
16
$45,653
14
$12,414
5
$51,888
APPLICATIONS WITHDRAWN
0
$0
4
$68,638
11
$98,920
1
$20,150
0
$0
FILES CLOSED FOR INCOMPLETENESS
0
$0
0
$0
4
$62,970
0
$0
0
$0
Aggregated Statistics For Year 2000 (Based on 2 partial tracts)
A) FHA, FSA/RHS & VA Home Purchase Loans
B) Conventional Home Purchase Loans
C) Refinancings
D) Home Improvement Loans
F) Non-occupant Loans on < 5 Family Dwellings (A B C & D)
Number
Average Value
Number
Average Value
Number
Average Value
Number
Average Value
Number
Average Value
LOANS ORIGINATED
13
$71,495
48
$65,174
11
$82,434
6
$31,485
4
$84,065
APPLICATIONS APPROVED, NOT ACCEPTED
1
$110,830
10
$62,718
9
$68,568
0
$0
0
$0
APPLICATIONS DENIED
4
$54,470
48
$53,603
14
$57,123
5
$15,616
4
$27,708
APPLICATIONS WITHDRAWN
0
$0
6
$64,020
11
$82,548
1
$18,890
0
$0
FILES CLOSED FOR INCOMPLETENESS
0
$0
4
$56,672
5
$86,394
0
$0
0
$0
Aggregated Statistics For Year 1999 (Based on 1 partial tract)
A) FHA, FSA/RHS & VA Home Purchase Loans
B) Conventional Home Purchase Loans
C) Refinancings
D) Home Improvement Loans
F) Non-occupant Loans on < 5 Family Dwellings (A B C & D)
Detailed PMIC statistics for the following Tracts:9603.00
2002 - 2018 National Fire Incident Reporting System (NFIRS) incidents
Based on the data from the years 2002 - 2018 the average number of fires per year is 33. The highest number of fires - 62 took place in 2009, and the least - 6 in 2006. The data has an increasing trend.
When looking into fire subcategories, the most incidents belonged to: Outside Fires (71.0%), and Structure Fires (21.2%).
Fire incident types reported to NFIRS in Zip Code 75423


 Nearest zip codes: 75452, 75401, 75496, 75413, 75424, 75490.


 : $111,365 in 3 contracts from 1999 to 2000
 Based on the data from the years 2002 - 2018 the average number of fires per year is 33. The highest number of fires - 62 took place in 2009, and the least - 6 in 2006. The data has an increasing trend.
 When looking into fire subcategories, the most incidents belonged to: Outside Fires (71.0%), and Structure Fires (21.2%).