Estimated zip code population in 2022: 2,512 Zip code population in 2010: 1,806 Zip code population in 2000: 1,788
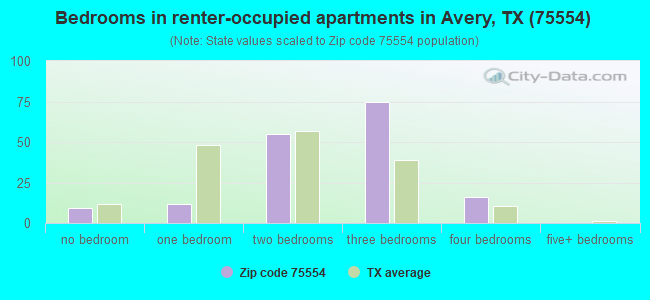
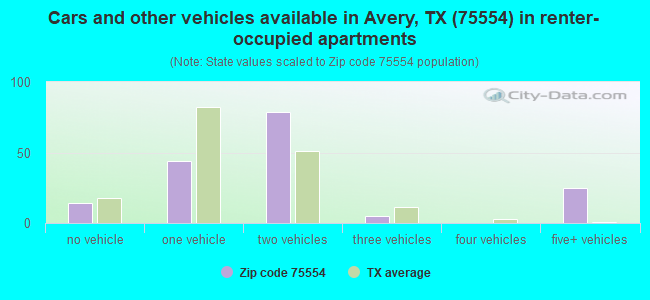
Houses and condos: 1,267 Renter-occupied apartments: 167
% of renters here:
16%
State:
38%
March 2022 cost of living index in zip code 75554: 79.8 (low, U.S. average is 100)
Land area: 163.9 sq. mi. Water area: 1.5 sq. mi.
Population density: 15 people per square mile
(very low).
OSM Map
General Map
Google Map
MSN Map
OSM Map
General Map
Google Map
MSN Map
OSM Map
General Map
Google Map
MSN Map
OSM Map
General Map
Google Map
MSN Map
Please wait while loading the map...
Real estate property taxes paid for housing units in 2022:
This zip code:
0.9% ($1,504)
Texas:
1.5% ($4,050)
Median real estate property taxes paid for housing units with mortgages in 2022: $2,121 (1.1%) Median real estate property taxes paid for housing units with no mortgage in 2022: $1,068 (1.0%)
Business Search- 14 Million verified businesses
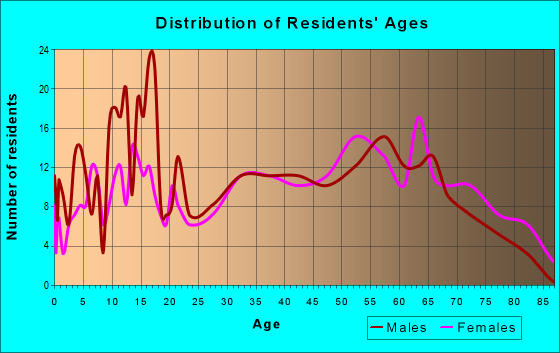
Males: 1,241
(49.4%)
Females: 1,271
(50.6%)
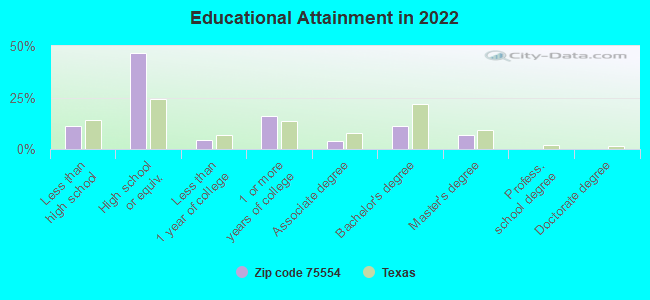
For population 25 years and over in 75554:
High school or higher: 87.1%
Bachelor's degree or higher: 17.3%
Graduate or professional degree: 6.6%
Unemployed: 0.3%
Mean travel time to work (commute): 28.0 minutes
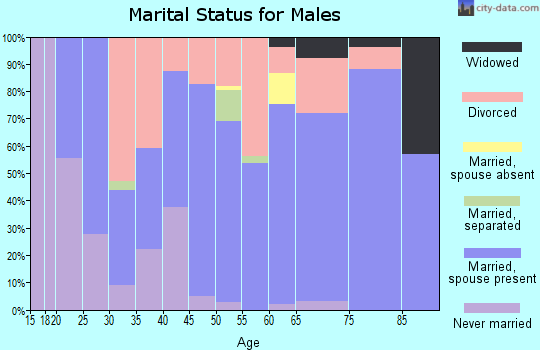
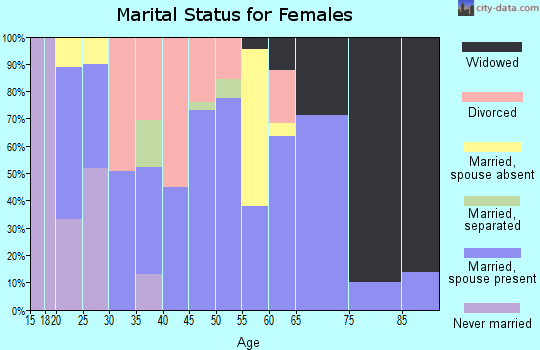
For population 15 years and over in 75554:
Never married: 20.9%
Now married: 61.1%
Separated: 0.9%
Widowed: 7.2%
Divorced: 10.0%
Zip code 75554 compared to state average:
Median household income below state average.
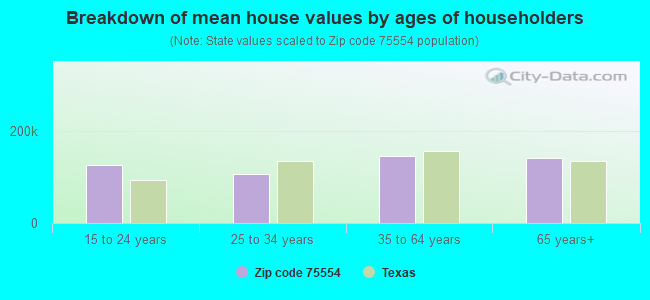
Median house value below state average.
Unemployed percentage significantly below state average.
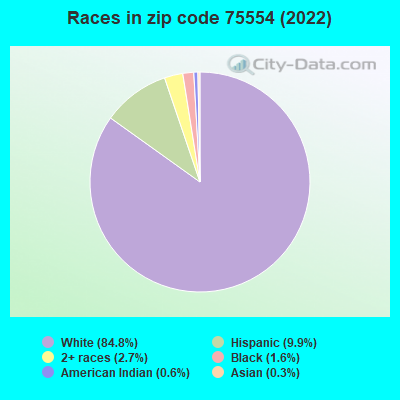
Black race population percentage significantly below state average.
Hispanic race population percentage significantly below state average.
Median age significantly above state average.
Foreign-born population percentage significantly below state average.
Renting percentage significantly below state average.
Length of stay since moving in significantly above state average.
Percentage of population with a bachelor's degree or higher below state average.
Averages for the 2020 tax year for zip code 75554, filed in 2021:
Average Adjusted Gross Income (AGI) in 2020: $50,775 (Individual Income Tax Returns)
Here:
$50,775
State:
$77,054
Salary/wage: $49,431 (reported on 77.5% of returns)
Here:
$49,431
State:
$62,766
(% of AGI for various income ranges: 1120.6% for AGIs below $25k, 3807.9% for AGIs $25k-50k, 6460.0% for AGIs $50k-75k, 9142.0% for AGIs $75k-100k, 15756.7% for AGIs $100k-200k)
Taxable interest for individuals: $852 (reported on 29.6% of returns)
This zip code:
$852
Texas:
$2,665
(% of AGI for various income ranges: 7.8% for AGIs below $25k, 35.0% for AGIs $25k-50k, 22.2% for AGIs $50k-75k, 28.0% for AGIs $75k-100k, 136.7% for AGIs $100k-200k)
Ordinary dividends: $2,367 (reported on 8.5% of returns)
Here:
$2,367
State:
$10,044
(% of AGI for various income ranges: 57.9% for AGIs $25k-50k, 122.0% for AGIs $75k-100k)
Net capital gain/loss in AGI: +$12,014 (reported on 9.9% of returns)
Here:
+$12,014
State:
+$39,590
(% of AGI for various income ranges: 125.0% for AGIs $25k-50k, 1110.0% for AGIs $100k-200k)
Profit/loss from business: +$8,308 (reported on 16.9% of returns)
Here:
+$8,308
State:
+$10,888
(% of AGI for various income ranges: 167.8% for AGIs below $25k, 107.9% for AGIs $25k-50k, 352.2% for AGIs $50k-75k, 378.3% for AGIs $100k-200k)
Taxable individual retirement arrangement distribution: $14,740 (reported on 7.0% of returns)
75554:
$14,740
Texas:
$24,740
(% of AGI for various income ranges: 190.6% for AGIs below $25k, 437.8% for AGIs $50k-75k)
Earned income credit: $2,086 (reported on 19.7% of returns)
Here:
$2,086
State:
$2,584
(% of AGI for various income ranges: 108.9% for AGIs below $25k, 68.6% for AGIs $25k-50k)
Percentage of individuals using paid preparers for their 2020 taxes: 90.1%
Here:
90%
State:
92%
(% for various income ranges: 87.5% for AGIs below $25k, 89.5% for AGIs $25k-50k, 91.7% for AGIs $50k-75k, 85.7% for AGIs $75k-100k, 100.0% for AGIs $100k-200k)
Averages for the 2012 tax year for zip code 75554, filed in 2013:
Average Adjusted Gross Income (AGI) in 2012: $41,894 (Individual Income Tax Returns)
Here:
$41,894
State:
$65,384
Salary/wage: $41,058 (reported on 78.6% of returns)
Here:
$41,058
State:
$52,524
(% of AGI for various income ranges: 69.6% for AGIs below $25k, 75.6% for AGIs $25k-50k, 81.4% for AGIs $50k-75k, 86.2% for AGIs $75k-100k, 69.9% for AGIs $100k-200k)
Taxable interest for individuals: $770 (reported on 32.9% of returns)
This zip code:
$770
Texas:
$2,372
(% of AGI for various income ranges: 0.8% for AGIs below $25k, 1.5% for AGIs $25k-50k, 0.3% for AGIs $50k-75k, 0.3% for AGIs $75k-100k)
Ordinary dividends: $2,000 (reported on 8.6% of returns)
Here:
$2,000
State:
$9,721
Net capital gain/loss in AGI: +$3,938 (reported on 11.4% of returns)
Here:
+$3,938
State:
+$35,319
Profit/loss from business: +$6,540 (reported on 14.3% of returns)
Here:
+$6,540
State:
+$13,732
(% of AGI for various income ranges: 8.8% for AGIs below $25k, 2.3% for AGIs $25k-50k, 2.3% for AGIs $50k-75k)
Taxable individual retirement arrangement distribution: $11,350 (reported on 5.7% of returns)
75554:
$11,350
Texas:
$19,511
Total itemized deductions: $20,844 (31% of AGI, reported on 12.9% of returns)
Here:
$20,844
State:
$24,724
Here:
31.4% of AGI
State:
15.9% of AGI
(% of AGI for various income ranges: 9.2% for AGIs $25k-50k, 6.5% for AGIs $50k-75k, 13.9% for AGIs $75k-100k)
Charity contributions: $5,900 (reported on 7.1% of returns)
Here:
$5,900
State:
$6,808
Taxes paid: $2,900 (reported on 12.9% of returns)
75554:
$2,900
State:
$6,921
(% of AGI for various income ranges: 1.0% for AGIs $25k-50k, 0.8% for AGIs $50k-75k, 2.5% for AGIs $75k-100k)
Earned income credit: $2,156 (reported on 22.9% of returns)
Here:
$2,156
State:
$2,570
(% of AGI for various income ranges: 6.9% for AGIs below $25k, 1.3% for AGIs $25k-50k)
Percentage of individuals using paid preparers for their 2012 taxes: 58.6%
Here:
59%
State:
51%
(% for various income ranges: 55.6% for AGIs below $25k, 61.9% for AGIs $25k-50k, 58.3% for AGIs $50k-75k, 50.0% for AGIs $75k-100k, 75.0% for AGIs $100k-200k)
Averages for the 2004 tax year for zip code 75554, filed in 2005:
Average Adjusted Gross Income (AGI) in 2004: $31,556 (Individual Income Tax Returns)
Here:
$31,556
State:
$47,881
Salary/wage: $30,901 (reported on 76.8% of returns)
Here:
$30,901
State:
$41,947
(% of AGI for various income ranges: 145.0% for AGIs below $10k, 75.0% for AGIs $10k-25k, 77.7% for AGIs $25k-50k, 84.8% for AGIs $50k-75k, 95.1% for AGIs $75k-100k, 35.0% for AGIs over 100k)
Taxable interest for individuals: $1,109 (reported on 42.9% of returns)
This zip code:
$1,109
Texas:
$2,255
(% of AGI for various income ranges: 9.5% for AGIs below $10k, 2.8% for AGIs $10k-25k, 1.4% for AGIs $25k-50k, 1.2% for AGIs $50k-75k, 0.1% for AGIs $75k-100k, 0.7% for AGIs over 100k)
Taxable dividends: $918 (reported on 8.9% of returns)
Here:
$918
State:
$4,261
(% of AGI for various income ranges: 1.8% for AGIs below $10k, 0.2% for AGIs $10k-25k, 0.1% for AGIs $25k-50k, 0.7% for AGIs $50k-75k)
Net capital gain/loss: +$4,500 (reported on 12.6% of returns)
Here:
+$4,500
State:
+$16,110
(% of AGI for various income ranges: 2.6% for AGIs below $10k, -0.3% for AGIs $10k-25k, 2.3% for AGIs $25k-50k, 4.6% for AGIs $50k-75k)
Profit/loss from business: +$8,637 (reported on 16.5% of returns)
Here:
+$8,637
State:
+$11,013
(% of AGI for various income ranges: 31.5% for AGIs below $10k, 9.5% for AGIs $10k-25k, 6.1% for AGIs $25k-50k, 1.3% for AGIs $50k-75k)
Total itemized deductions: $13,253 (24% of AGI, reported on 10.9% of returns)
Here:
$13,253
State:
$19,631
Here:
24.1% of AGI
State:
18.9% of AGI
(% of AGI for various income ranges: 3.3% for AGIs $10k-25k, 4.4% for AGIs $25k-50k, 6.0% for AGIs $50k-75k, 12.6% for AGIs $75k-100k)
Charity contributions deductions: $3,309 (6% of AGI, reported on 8.0% of returns)
Here:
$3,309
State:
$4,753
Here:
5.7% of AGI
State:
4.2% of AGI
Total tax: $3,913 (reported on 72.0% of returns)
75554:
$3,913
State:
$9,058
(% of AGI for various income ranges: 6.1% for AGIs below $10k, 3.9% for AGIs $10k-25k, 6.4% for AGIs $25k-50k, 9.1% for AGIs $50k-75k, 10.5% for AGIs $75k-100k, 19.2% for AGIs over 100k)
Earned income credit: $1,949 (reported on 22.9% of returns)
Here:
$1,949
State:
$2,024
Percentage of individuals using paid preparers for their 2004 taxes: 65.1%
Here:
65%
State:
57%
(% for various income ranges: 62.4% for AGIs below $10k, 61.8% for AGIs $10k-25k, 68.8% for AGIs $25k-50k, 69.9% for AGIs $50k-75k, 58.3% for AGIs $75k-100k, 72.2% for AGIs over 100k)
Household received Food Stamps/SNAP in the past 12 months: 61 Household did not receive Food Stamps/SNAP in the past 12 months: 969
Women who had a birth in the past 12 months: 5 (0 now married, 4 unmarried) Women who did not have a birth in the past 12 months: 557 (307 now married, 248 unmarried)
Housing units in zip code 75554 with a mortgage: 337 Median monthly owner costs for units with a mortgage: $1,551 Median monthly owner costs for units without a mortgage: $411
Residents with income below the poverty level in 2022:
This zip code:
12.7%
Whole state:
14.0%
Residents with income below 50% of the poverty level in 2022:
This zip code:
6.4%
Whole state:
7.4%
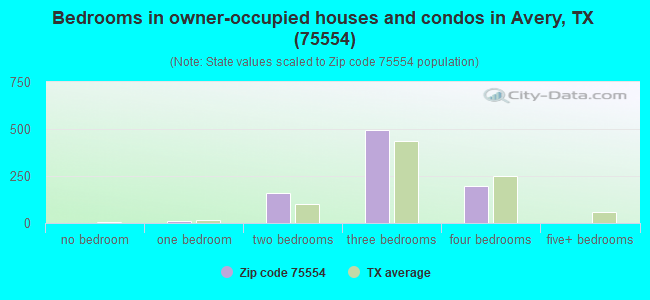
Median number of rooms in houses and condos:
Here:
5.5
State:
6.3
Median number of rooms in apartments:
Here:
5.3
State:
4.0
Notable locations in this zip code not listed on our city pages
Churches in zip code 75554 include: English Church (A), Gravel Hill Church (B), Savannah Church (C), Henrietta Church (D), Jackson Church (E), Lone Pine Church (F), Mill Creek Church (G), West Bowie Union Church (H). Display/hide their locations on the map
Cemeteries: Wilkes Cemetery (1), Medford Cemetery (2), Cedar Creek Cemetery (3), Walker Cemetery (4), Shawnee Chapel Cemetery (5), Warthan Cemetery (6), Wooten Cemetery (7). Display/hide their locations on the map
Creeks: West Fork Mill Creek (A), Little Creek (B), Beaverdam Creek (C), Roden Creek (D), Cedar Creek (E), Caney Creek (F), Peters Creek (G), Harris Creek (H), Dillard Creek (I). Display/hide their locations on the map
Size of family households: 411 2-persons, 186 3-persons, 102 4-persons, 34 5-persons, 40 6-persons
Size of nonfamily households: 248 1-person, 6 2-persons, 4 4-persons
251 married couples with children.
127 single-parent households (2 men, 125 women).
94.0% of residents of 75554 zip code speak English at home.
5.8% of residents speak Spanish at home (8% very well, 60% well, 32% not at all).
0.5% of residents speak Asian or Pacific Island language at home (100% very well).
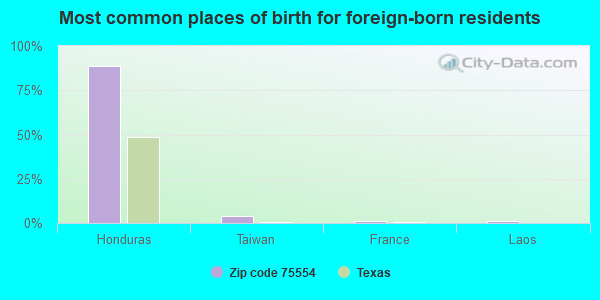
Foreign born population: 154 (6.2%) (19.9% of them are naturalized citizens)
This zip code:
6.2%
Whole state:
17.2%
89%Honduras
4%Taiwan
1%France
1%Laos
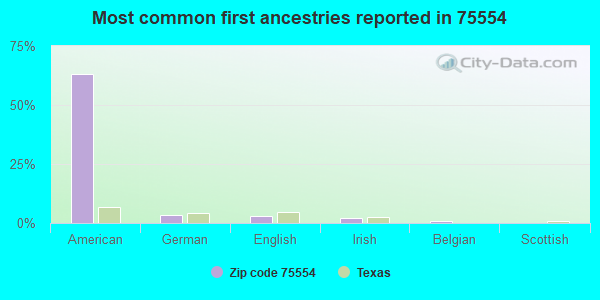
63%American
4%German
3%English
2%Irish
1%Belgian
0%Scottish
0%Dutch
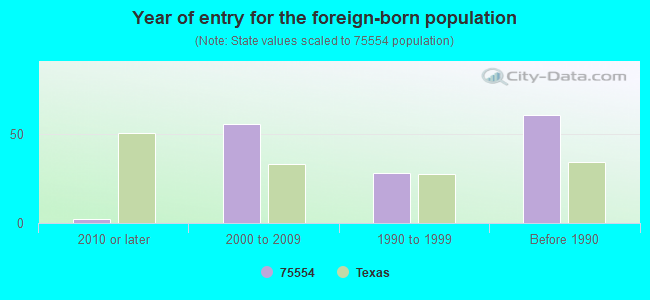
Year of entry for the foreign-born population
22010 or later
562000 to 2009
281990 to 1999
61Before 1990
Facilities with environmental interests located in this zip code:
AVERY EL (150 SAN ANTONIO ST in AVERY, TX)
(National Center for Education Statistics) - STATE ID-194902101 Organizations: AVERY ISD (SCHOOL DISTRICT)
AVERY H S (150 SAN ANTONIO ST in AVERY, TX)
(National Center for Education Statistics) - STATE ID-194902001 Organizations: AVERY ISD (SCHOOL DISTRICT)
AVERY MIDDLE (150 SAN ANTONIO ST in AVERY, TX)
(National Center for Education Statistics) - STATE ID-194902041 Organizations: AVERY ISD (SCHOOL DISTRICT)
AVERY WWTP (ON MILL CREEK, 1.5MI NE CITY in AVERY, TX)
National Pollutant Discharge Elimination System NON-MAJOR (Tracking pollutant discharge elimination systems) - permit Business SIC classification: SEWERAGE SYSTEMS Organizations: CITY OF AVERY (CONTACT/OWNER)
Alternative names: AVERY, CITY OF, CITY OF AVERY
Housing units lacking complete plumbing facilities: 11.1% Housing units lacking complete kitchen facilities: 7.3%
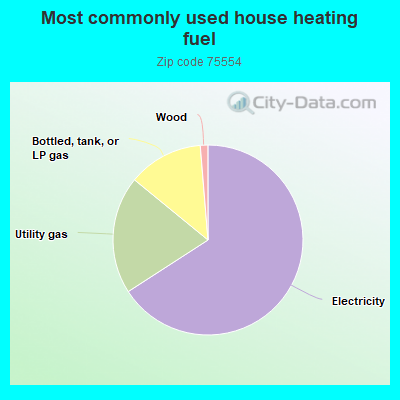
66.0%Electricity
20.1%Utility gas
12.8%Bottled, tank, or LP gas
1.3%Wood
Population in 1990: 1,317. Population change in the 1990s: +471 (+35.8%).
Place of birth for U.S.-born residents:
This state: 1,647
Northeast: 17
Midwest: 142
South: 308
West: 235
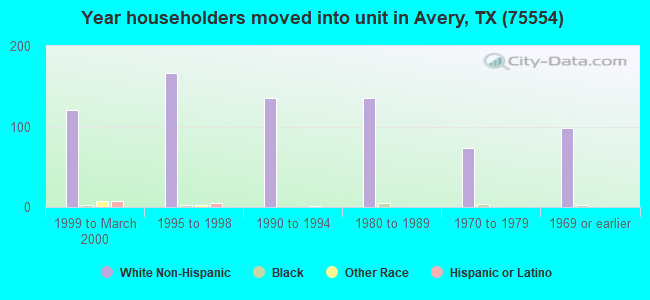
61% of the 75554 zip code residents lived in the same house 5 years ago. Out of people who lived in different houses, 61% lived in this county. Out of people who lived in different counties, 50% lived in Texas.
95% of the 75554 zip code residents lived in the same house 1 year ago. Out of people who lived in different houses, 45% moved from this county. Out of people who lived in different houses, 50% moved from different county within same state. Out of people who lived in different houses, 6% moved from different state.
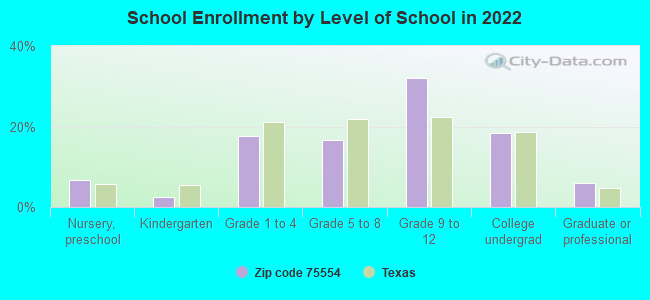
Private vs. public school enrollment:
Students in private schools in grades 1 to 8 (elementary and middle school):
Here:
0.0%
Texas:
8.8%
Students in private schools in grades 9 to 12 (high school): 4
Here:
3.2%
Texas:
8.0%
Students in private undergraduate colleges: 11
Here:
14.9%
Texas:
16.2%
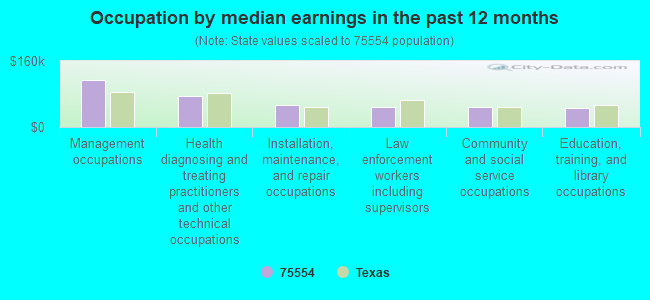
Occupation by median earnings in the past 12 months ($)
114,606Management occupations
76,090Health diagnosing and treating practitioners and other technical occupations
53,624Installation, maintenance, and repair occupations
49,391Law enforcement workers including supervisors
47,858Community and social service occupations
45,341Education, training, and library occupations
Top industries in this zip code by the number of employees in 2005:
Other Services (except Public Administration): Religious Organizations (5-9 employees: 1 establishment, 1-4 employees: 1 establishment)
Construction: Masonry Contractors (5-9: 1)
Other Services (except Public Administration): General Automotive Repair (1-4: 3)
Finance and Insurance: Insurance Agencies and Brokerages (1-4: 1)
Accommodation and Food Services: Limited-Service Restaurants (1-4: 1)
Real Estate and Rental and Leasing: Lessors of Nonresidential Buildings (except Miniwarehouses) (1-4: 1)
Fatal accident statistics in 2014:
Fatal accident count: 1
Vehicles involved in fatal accidents: 2
Fatal accidents caused by drunken drivers: 1
Fatalities: 1
Persons involved in fatal accidents: 3
Pedestrians involved in fatal accidents: 0
Fatal accident statistics in 2013:
Fatal accident count: 1
Vehicles involved in fatal accidents: 1
Fatal accidents caused by drunken drivers: 1
Fatalities: 1
Persons involved in fatal accidents: 1
Pedestrians involved in fatal accidents: 0
2002 - 2017 National Fire Incident Reporting System (NFIRS) incidents
According to the data from the years 2002 - 2017 the average number of fires per year is 14. The highest number of reported fires - 28 took place in 2006, and the least - 0 in 2012. The data has a declining trend.
When looking into fire subcategories, the most reports belonged to: Outside Fires (78.5%), and Structure Fires (14.2%).
Fire incident types reported to NFIRS in Zip Code 75554
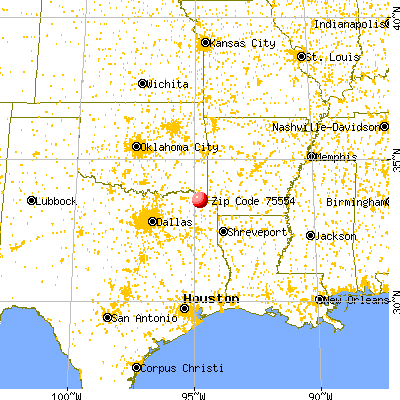


 Nearest zip codes: 75550, 75559, 75426, 74740, 74745, 75558.


 According to the data from the years 2002 - 2017 the average number of fires per year is 14. The highest number of reported fires - 28 took place in 2006, and the least - 0 in 2012. The data has a declining trend.
 When looking into fire subcategories, the most reports belonged to: Outside Fires (78.5%), and Structure Fires (14.2%).