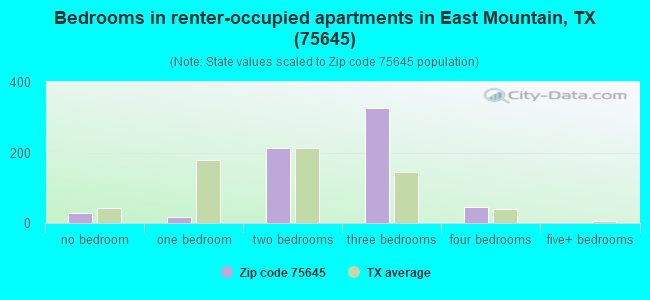
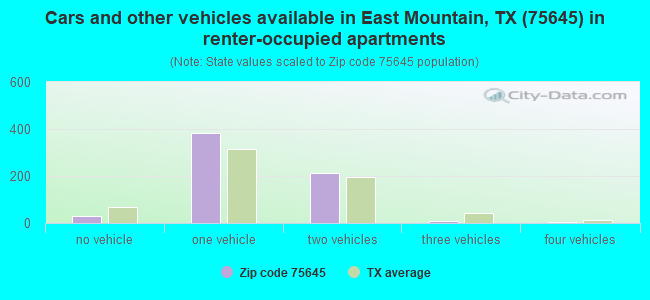
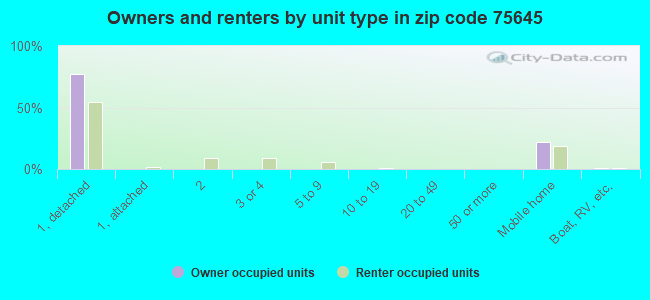
Houses and condos: 4,616 Renter-occupied apartments: 632
% of renters here:
15%
State:
38%
March 2022 cost of living index in zip code 75645: 79.9 (low, U.S. average is 100)
Land area: 145.0 sq. mi. Water area: 1.8 sq. mi.
Population density: 72 people per square mile
(very low).
OSM Map
Google Map
MSN Map
OSM Map
General Map
Google Map
MSN Map
OSM Map
Google Map
MSN Map
OSM Map
Google Map
MSN Map
Please wait while loading the map...
Real estate property taxes paid for housing units in 2022:
This zip code:
1.1% ($2,309)
Texas:
1.5% ($4,050)
Median real estate property taxes paid for housing units with mortgages in 2022: $2,815 (1.1%) Median real estate property taxes paid for housing units with no mortgage in 2022: $1,937 (1.2%)
Business Search- 14 Million verified businesses
Males: 5,364
(51.3%)
Females: 5,089
(48.7%)
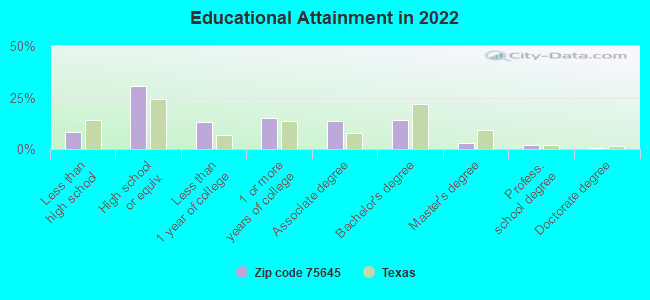
For population 25 years and over in 75645:
High school or higher: 91.2%
Bachelor's degree or higher: 19.1%
Graduate or professional degree: 5.1%
Unemployed: 3.2%
Mean travel time to work (commute): 30.4 minutes
For population 15 years and over in 75645:
Never married: 18.3%
Now married: 61.6%
Separated: 0.7%
Widowed: 7.8%
Divorced: 11.5%
Zip code 75645 compared to state average:
Black race population percentage below state average.
Hispanic race population percentage significantly below state average.
Median age significantly above state average.
Foreign-born population percentage significantly below state average.
Renting percentage significantly below state average.
Length of stay since moving in significantly above state average.
Number of college students significantly below state average.
Percentage of population with a bachelor's degree or higher below state average.
Averages for the 2020 tax year for zip code 75645, filed in 2021:
Average Adjusted Gross Income (AGI) in 2020: $58,166 (Individual Income Tax Returns)
Here:
$58,166
State:
$77,054
Salary/wage: $52,846 (reported on 80.7% of returns)
Here:
$52,846
State:
$62,766
(% of AGI for various income ranges: 1150.3% for AGIs below $25k, 3484.9% for AGIs $25k-50k, 6362.5% for AGIs $50k-75k, 9252.9% for AGIs $75k-100k, 15506.4% for AGIs $100k-200k, 62410.0% for AGIs over 200k)
Taxable interest for individuals: $922 (reported on 30.2% of returns)
This zip code:
$922
Texas:
$2,665
(% of AGI for various income ranges: 16.3% for AGIs below $25k, 26.7% for AGIs $25k-50k, 27.5% for AGIs $50k-75k, 60.0% for AGIs $75k-100k, 88.8% for AGIs $100k-200k, 343.3% for AGIs over 200k)
Ordinary dividends: $4,294 (reported on 12.0% of returns)
Here:
$4,294
State:
$10,044
(% of AGI for various income ranges: 19.7% for AGIs below $25k, 17.9% for AGIs $25k-50k, 65.2% for AGIs $50k-75k, 139.4% for AGIs $75k-100k, 176.0% for AGIs $100k-200k, 1333.3% for AGIs over 200k)
Net capital gain/loss in AGI: +$11,419 (reported on 12.0% of returns)
Here:
+$11,419
State:
+$39,590
(% of AGI for various income ranges: 12.7% for AGIs below $25k, 19.6% for AGIs $25k-50k, 94.4% for AGIs $50k-75k, 168.4% for AGIs $75k-100k, 459.3% for AGIs $100k-200k, 9410.0% for AGIs over 200k)
Profit/loss from business: +$7,330 (reported on 21.8% of returns)
Here:
+$7,330
State:
+$10,888
(% of AGI for various income ranges: 164.1% for AGIs below $25k, 140.9% for AGIs $25k-50k, 196.5% for AGIs $50k-75k, 180.6% for AGIs $75k-100k, 338.8% for AGIs $100k-200k, 3086.7% for AGIs over 200k)
Taxable individual retirement arrangement distribution: $19,461 (reported on 8.6% of returns)
75645:
$19,461
Texas:
$24,740
(% of AGI for various income ranges: 44.4% for AGIs below $25k, 112.4% for AGIs $25k-50k, 202.3% for AGIs $50k-75k, 336.5% for AGIs $75k-100k, 915.0% for AGIs $100k-200k)
Total itemized deductions: $37,683 (reported on 5.4% of returns)
Here:
$37,683
State:
$40,428
(% of AGI for various income ranges: 176.0% for AGIs $25k-50k, 262.3% for AGIs $50k-75k, 358.7% for AGIs $75k-100k, 705.5% for AGIs $100k-200k, 7026.7% for AGIs over 200k)
Charity contributions: $14,226 (reported on 4.3% of returns)
Here:
$14,226
State:
$18,201
(% of AGI for various income ranges: 23.2% for AGIs $25k-50k, 33.3% for AGIs $50k-75k, 98.1% for AGIs $75k-100k, 228.3% for AGIs $100k-200k, 3563.3% for AGIs over 200k)
Taxes paid: $6,348 (reported on 5.2% of returns)
75645:
$6,348
State:
$7,821
(% of AGI for various income ranges: 28.9% for AGIs $25k-50k, 29.6% for AGIs $50k-75k, 48.4% for AGIs $75k-100k, 139.5% for AGIs $100k-200k, 1063.3% for AGIs over 200k)
Earned income credit: $2,488 (reported on 21.5% of returns)
Here:
$2,488
State:
$2,584
(% of AGI for various income ranges: 125.8% for AGIs below $25k, 97.8% for AGIs $25k-50k, 3.1% for AGIs $50k-75k)
Percentage of individuals using paid preparers for their 2020 taxes: 93.4%
Here:
93%
State:
92%
(% for various income ranges: 92.9% for AGIs below $25k, 93.6% for AGIs $25k-50k, 93.8% for AGIs $50k-75k, 92.7% for AGIs $75k-100k, 93.7% for AGIs $100k-200k, 100.0% for AGIs over 200k)
Averages for the 2012 tax year for zip code 75645, filed in 2013:
Average Adjusted Gross Income (AGI) in 2012: $50,046 (Individual Income Tax Returns)
Here:
$50,046
State:
$65,384
Salary/wage: $46,245 (reported on 83.6% of returns)
Here:
$46,245
State:
$52,524
(% of AGI for various income ranges: 74.6% for AGIs below $25k, 80.3% for AGIs $25k-50k, 81.9% for AGIs $50k-75k, 80.0% for AGIs $75k-100k, 83.1% for AGIs $100k-200k, 44.9% for AGIs over 200k)
Taxable interest for individuals: $1,054 (reported on 31.0% of returns)
This zip code:
$1,054
Texas:
$2,372
(% of AGI for various income ranges: 1.3% for AGIs below $25k, 0.6% for AGIs $25k-50k, 0.6% for AGIs $50k-75k, 0.8% for AGIs $75k-100k, 0.5% for AGIs $100k-200k, 0.5% for AGIs over 200k)
Ordinary dividends: $2,467 (reported on 12.2% of returns)
Here:
$2,467
State:
$9,721
(% of AGI for various income ranges: 0.7% for AGIs below $25k, 0.6% for AGIs $25k-50k, 0.5% for AGIs $50k-75k, 0.9% for AGIs $75k-100k, 0.4% for AGIs $100k-200k, 0.7% for AGIs over 200k)
Net capital gain/loss in AGI: +$7,810 (reported on 10.3% of returns)
Here:
+$7,810
State:
+$35,319
(% of AGI for various income ranges: 0.3% for AGIs $25k-50k, 0.7% for AGIs $50k-75k, 0.7% for AGIs $75k-100k, 0.9% for AGIs $100k-200k, 11.2% for AGIs over 200k)
Profit/loss from business: +$11,207 (reported on 19.1% of returns)
Here:
+$11,207
State:
+$13,732
(% of AGI for various income ranges: 9.0% for AGIs below $25k, 4.0% for AGIs $25k-50k, 3.2% for AGIs $50k-75k, 3.3% for AGIs $75k-100k, 3.2% for AGIs $100k-200k, 6.8% for AGIs over 200k)
Taxable individual retirement arrangement distribution: $14,700 (reported on 9.8% of returns)
75645:
$14,700
Texas:
$19,511
(% of AGI for various income ranges: 4.1% for AGIs below $25k, 3.2% for AGIs $25k-50k, 2.1% for AGIs $50k-75k, 3.6% for AGIs $75k-100k, 3.4% for AGIs $100k-200k)
Total itemized deductions: $19,623 (21% of AGI, reported on 22.0% of returns)
Here:
$19,623
State:
$24,724
Here:
21.1% of AGI
State:
15.9% of AGI
(% of AGI for various income ranges: 7.4% for AGIs below $25k, 7.8% for AGIs $25k-50k, 8.5% for AGIs $50k-75k, 9.4% for AGIs $75k-100k, 10.2% for AGIs $100k-200k, 5.9% for AGIs over 200k)
Charity contributions: $5,449 (reported on 16.2% of returns)
Here:
$5,449
State:
$6,808
(% of AGI for various income ranges: 1.0% for AGIs below $25k, 1.2% for AGIs $25k-50k, 1.8% for AGIs $50k-75k, 1.9% for AGIs $75k-100k, 2.3% for AGIs $100k-200k, 1.7% for AGIs over 200k)
Taxes paid: $4,079 (reported on 21.8% of returns)
75645:
$4,079
State:
$6,921
(% of AGI for various income ranges: 1.0% for AGIs below $25k, 1.2% for AGIs $25k-50k, 1.6% for AGIs $50k-75k, 2.1% for AGIs $75k-100k, 2.4% for AGIs $100k-200k, 1.5% for AGIs over 200k)
Earned income credit: $2,318 (reported on 21.2% of returns)
Here:
$2,318
State:
$2,570
(% of AGI for various income ranges: 8.4% for AGIs below $25k, 1.1% for AGIs $25k-50k)
Percentage of individuals using paid preparers for their 2012 taxes: 57.6%
Here:
58%
State:
51%
(% for various income ranges: 53.7% for AGIs below $25k, 55.7% for AGIs $25k-50k, 60.7% for AGIs $50k-75k, 61.0% for AGIs $75k-100k, 63.2% for AGIs $100k-200k, 100.0% for AGIs over 200k)
Averages for the 2004 tax year for zip code 75645, filed in 2005:
Average Adjusted Gross Income (AGI) in 2004: $36,293 (Individual Income Tax Returns)
Here:
$36,293
State:
$47,881
Salary/wage: $34,221 (reported on 83.8% of returns)
Here:
$34,221
State:
$41,947
(% of AGI for various income ranges: 140.7% for AGIs below $10k, 75.4% for AGIs $10k-25k, 84.0% for AGIs $25k-50k, 80.9% for AGIs $50k-75k, 85.9% for AGIs $75k-100k, 61.2% for AGIs over 100k)
Taxable interest for individuals: $1,678 (reported on 35.7% of returns)
This zip code:
$1,678
Texas:
$2,255
(% of AGI for various income ranges: 5.5% for AGIs below $10k, 2.3% for AGIs $10k-25k, 1.7% for AGIs $25k-50k, 1.0% for AGIs $50k-75k, 0.9% for AGIs $75k-100k, 2.2% for AGIs over 100k)
Taxable dividends: $1,544 (reported on 14.4% of returns)
Here:
$1,544
State:
$4,261
(% of AGI for various income ranges: 1.8% for AGIs below $10k, 0.7% for AGIs $10k-25k, 0.4% for AGIs $25k-50k, 0.5% for AGIs $50k-75k, 0.3% for AGIs $75k-100k, 1.0% for AGIs over 100k)
Net capital gain/loss: +$4,640 (reported on 12.0% of returns)
Here:
+$4,640
State:
+$16,110
(% of AGI for various income ranges: -3.2% for AGIs below $10k, 0.5% for AGIs $10k-25k, 0.1% for AGIs $25k-50k, 0.7% for AGIs $50k-75k, 0.6% for AGIs $75k-100k, 6.3% for AGIs over 100k)
Profit/loss from business: +$7,823 (reported on 23.0% of returns)
Here:
+$7,823
State:
+$11,013
(% of AGI for various income ranges: 2.4% for AGIs below $10k, 10.1% for AGIs $10k-25k, 3.9% for AGIs $25k-50k, 3.5% for AGIs $50k-75k, 4.9% for AGIs $75k-100k, 5.3% for AGIs over 100k)
IRA payment deduction: $3,193 (reported on 1.9% of returns)
75645:
$3,193
Texas:
$3,120
Total itemized deductions: $16,904 (25% of AGI, reported on 20.8% of returns)
Here:
$16,904
State:
$19,631
Here:
25.4% of AGI
State:
18.9% of AGI
(% of AGI for various income ranges: 8.2% for AGIs below $10k, 4.8% for AGIs $10k-25k, 9.3% for AGIs $25k-50k, 10.8% for AGIs $50k-75k, 10.7% for AGIs $75k-100k, 11.2% for AGIs over 100k)
Charity contributions deductions: $4,825 (7% of AGI, reported on 16.7% of returns)
Here:
$4,825
State:
$4,753
Here:
7.0% of AGI
State:
4.2% of AGI
(% of AGI for various income ranges: 0.8% for AGIs below $10k, 0.8% for AGIs $10k-25k, 2.0% for AGIs $25k-50k, 2.2% for AGIs $50k-75k, 3.1% for AGIs $75k-100k, 3.0% for AGIs over 100k)
Total tax: $4,778 (reported on 71.7% of returns)
75645:
$4,778
State:
$9,058
(% of AGI for various income ranges: 5.1% for AGIs below $10k, 4.1% for AGIs $10k-25k, 6.2% for AGIs $25k-50k, 8.4% for AGIs $50k-75k, 10.4% for AGIs $75k-100k, 18.2% for AGIs over 100k)
Earned income credit: $1,820 (reported on 22.2% of returns)
Here:
$1,820
State:
$2,024
Percentage of individuals using paid preparers for their 2004 taxes: 65.1%
Here:
65%
State:
57%
(% for various income ranges: 56.1% for AGIs below $10k, 68.8% for AGIs $10k-25k, 68.3% for AGIs $25k-50k, 65.0% for AGIs $50k-75k, 62.3% for AGIs $75k-100k, 71.7% for AGIs over 100k)
Household received Food Stamps/SNAP in the past 12 months: 318 Household did not receive Food Stamps/SNAP in the past 12 months: 3,928
Women who had a birth in the past 12 months: 48 (34 now married, 13 unmarried) Women who did not have a birth in the past 12 months: 2,032 (1,319 now married, 700 unmarried)
Housing units in zip code 75645 with a mortgage: 1,748 (120 second mortgage, 94 both second mortgage and home equity loan) Median monthly owner costs for units with a mortgage: $1,458 Median monthly owner costs for units without a mortgage: $481
Residents with income below the poverty level in 2022:
This zip code:
14.7%
Whole state:
14.0%
Residents with income below 50% of the poverty level in 2022:
This zip code:
5.6%
Whole state:
7.4%
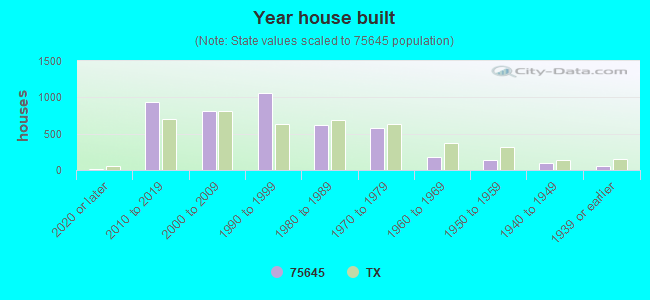
Median number of rooms in houses and condos:
Here:
5.7
State:
6.3
Median number of rooms in apartments:
Here:
5.1
State:
4.0
Notable locations in this zip code not listed on our city pages
Notable locations in zip code 75645: Gilmer Country Club (A), Indian Rock (B), Sand Hill (C), Glenwood Acres Volunteer Fire Department (D), Texas Forest Service Gilmer Office (E). Display/hide their locations on the map
Churches in zip code 75645 include: Woodland Church (A), Glade Creek Church (B), Holly Springs Church (C), Lake Providence Church (D), Mings Chapel (E), Mount Olive Church (F), New Hope Church (G), New Hopewell Church (H), Pine Grove Church (I). Display/hide their locations on the map
Cemeteries: Bethlehem Cemetery (1), Floyds Cemetery (2), Sunset Memorial Park (3), Glenwood Cemetery (4), Mattox Cemetery (5), Reynolds Cemetery (6). Display/hide their locations on the map
Reservoirs: Twin Lakes (A), Owens Lake (B), Dixon Lake (C), Lester Lake (D), Duffey Lake (E), Stroman Lake (F), Sonny Oats Lake Number 1 (G), Sonny Oats Lake Number 2 (H). Display/hide their locations on the map
Streams, rivers, and creeks: Wells Branch (A), Sugar Creek (B), Stillhouse Creek (C), Sand Spring Branch (D), Rocky Branch (E), Pond Creek (F), Mitchell Branch (G), McCoy Branch (H), Hefner Branch (I). Display/hide their locations on the map
Size of family households: 1,487 2-persons, 851 3-persons, 371 4-persons, 226 5-persons, 58 6-persons, 25 7-or-more-persons
Size of nonfamily households: 1,144 1-person, 99 2-persons
1,856 married couples with children.
304 single-parent households (60 men, 244 women).
96.7% of residents of 75645 zip code speak English at home.
2.5% of residents speak Spanish at home (53% very well, 28% well, 14% not well, 4% not at all).
0.2% of residents speak other Indo-European language at home (100% very well).
0.5% of residents speak Asian or Pacific Island language at home (56% well, 44% not at all).
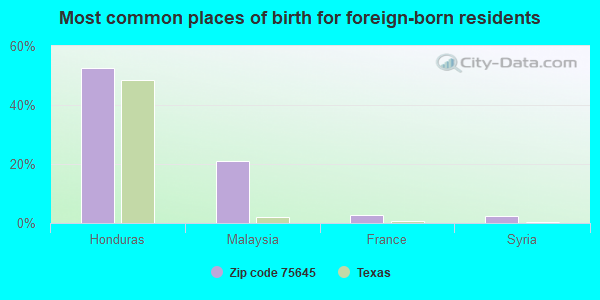
Foreign born population: 322 (3.1%) (61.2% of them are naturalized citizens)
This zip code:
3.1%
Whole state:
17.2%
53%Honduras
21%Malaysia
3%France
3%Syria
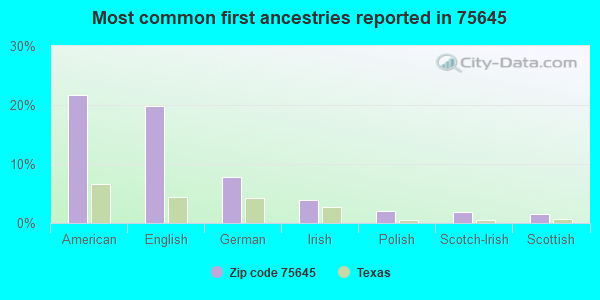
22%American
20%English
8%German
4%Irish
2%Polish
2%Scotch-Irish
2%Scottish
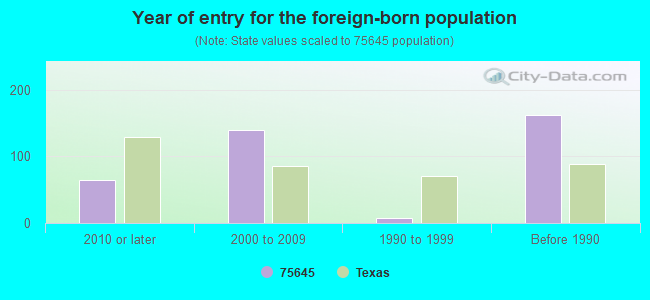
Year of entry for the foreign-born population
642010 or later
1392000 to 2009
71990 to 1999
162Before 1990
Housing units lacking complete plumbing facilities: 3.2% Housing units lacking complete kitchen facilities: 2.8%
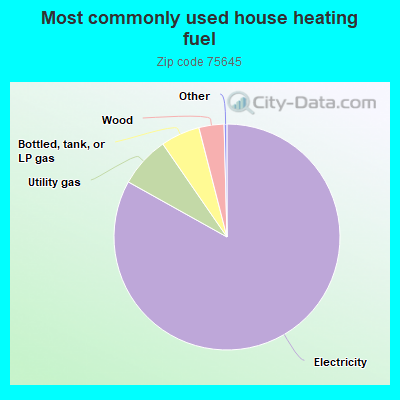
83.1%Electricity
7.3%Utility gas
5.6%Bottled, tank, or LP gas
3.6%Wood
Place of birth for U.S.-born residents:
This state: 7,033
Northeast: 290
Midwest: 617
South: 1,409
West: 688
92% of the 75645 zip code residents lived in the same house 1 year ago. Out of people who lived in different houses, 51% moved from this county. Out of people who lived in different houses, 36% moved from different county within same state. Out of people who lived in different houses, 13% moved from different state.
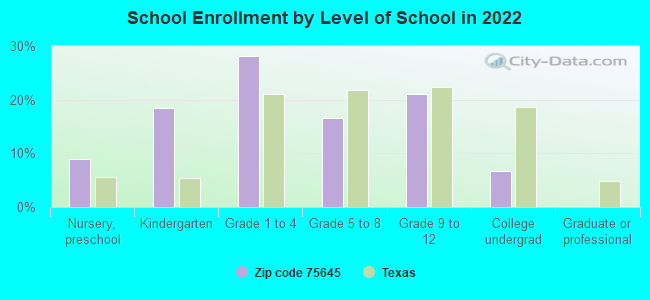
Private vs. public school enrollment:
Students in private schools in grades 1 to 8 (elementary and middle school): 157
Here:
15.3%
Texas:
8.8%
Students in private schools in grades 9 to 12 (high school): 75
Here:
15.7%
Texas:
8.0%
Students in private undergraduate colleges: 67
Here:
43.9%
Texas:
16.2%
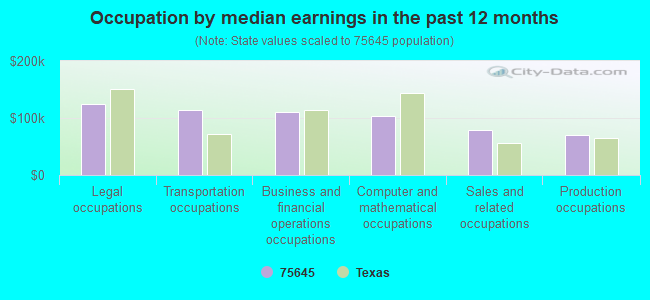
Occupation by median earnings in the past 12 months ($)
125,328Legal occupations
114,604Transportation occupations
110,620Business and financial operations occupations
102,932Computer and mathematical occupations
78,840Sales and related occupations
70,414Production occupations
Top industries in this zip code by the number of employees in 2005:
Other Services (except Public Administration): Religious Organizations (10-19 employees: 2 establishments, 1-4 employees: 5 establishments)
Construction: Plumbing, Heating, and Air-Conditioning Contractors (10-19: 1, 1-4: 5)
Utilities: Water Supply and Irrigation Systems (5-9: 1, 1-4: 1)
Health Care and Social Assistance: Offices of Physical, Occupational and Speech Therapists, and Audiologists (5-9: 1, 1-4: 1)
Accommodation and Food Services: Full-Service Restaurants (5-9: 1)
Construction: Electrical Contractors (1-4: 3)
Health Care and Social Assistance: Offices of Physicians (except Mental Health Specialists) (1-4: 2)
Fatal accident statistics in 2014:
Fatal accident count: 3
Vehicles involved in fatal accidents: 3
Fatal accidents caused by drunken drivers: 1
Fatalities: 3
Persons involved in fatal accidents: 4
Pedestrians involved in fatal accidents: 0
Fatal accident statistics in 2013:
Fatal accident count: 1
Vehicles involved in fatal accidents: 2
Fatal accidents caused by drunken drivers: 0
Fatalities: 1
Persons involved in fatal accidents: 3
Pedestrians involved in fatal accidents: 0
2002 - 2018 National Fire Incident Reporting System (NFIRS) incidents
Based on the data from the years 2002 - 2018 the average number of fire incidents per year is 24. The highest number of reported fire incidents - 71 took place in 2017, and the least - 0 in 2009. The data has a rising trend.
When looking into fire subcategories, the most reports belonged to: Outside Fires (57.9%), and Structure Fires (30.3%).
Fire incident types reported to NFIRS in Zip Code 75645


 Based on the data from the years 2002 - 2018 the average number of fire incidents per year is 24. The highest number of reported fire incidents - 71 took place in 2017, and the least - 0 in 2009. The data has a rising trend.
 When looking into fire subcategories, the most reports belonged to: Outside Fires (57.9%), and Structure Fires (30.3%).