Estimated zip code population in 2022: 27,731 Zip code population in 2010: 21,989 Zip code population in 2000: 19,318
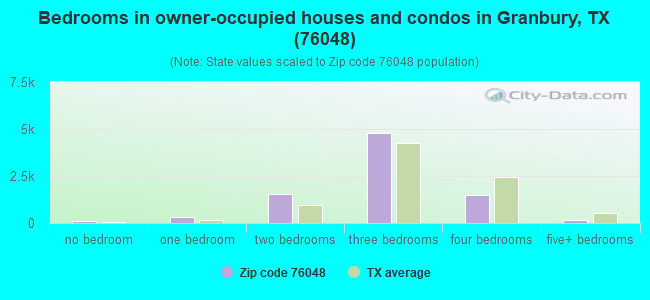
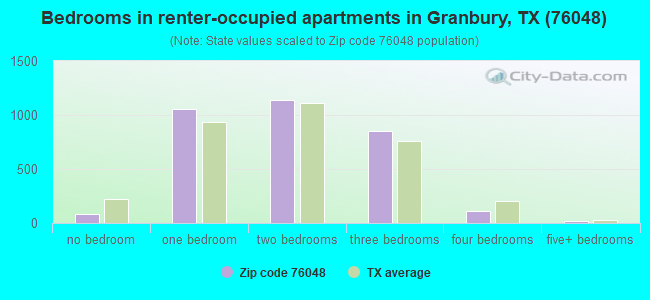
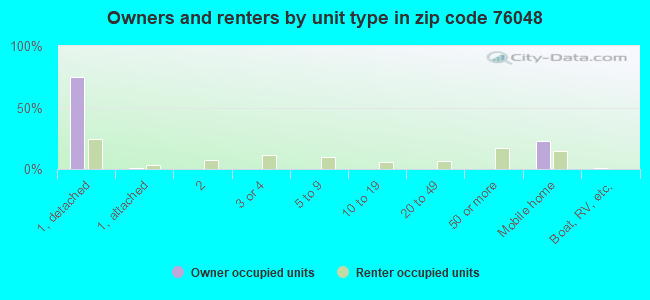
Houses and condos: 13,686 Renter-occupied apartments: 3,295
% of renters here:
28%
State:
38%
March 2022 cost of living index in zip code 76048: 91.8 (less than average, U.S. average is 100)
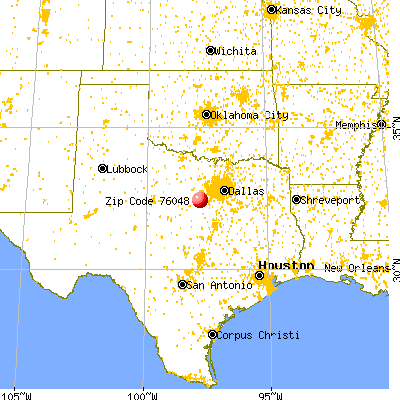
Land area: 108.5 sq. mi. Water area: 5.9 sq. mi.
Population density: 256 people per square mile
(very low).
OSM Map
General Map
Google Map
MSN Map
OSM Map
General Map
Google Map
MSN Map
OSM Map
General Map
Google Map
MSN Map
OSM Map
General Map
Google Map
MSN Map
Please wait while loading the map...
Real estate property taxes paid for housing units in 2022:
This zip code:
1.1% ($2,516)
Texas:
1.5% ($4,050)
Median real estate property taxes paid for housing units with mortgages in 2022: $3,052 (1.2%) Median real estate property taxes paid for housing units with no mortgage in 2022: $1,731 (0.9%)
Averages for the 2020 tax year for zip code 76048, filed in 2021:
Average Adjusted Gross Income (AGI) in 2020: $72,923 (Individual Income Tax Returns)
Here:
$72,923
State:
$77,054
Salary/wage: $54,261 (reported on 73.8% of returns)
Here:
$54,261
State:
$62,766
(% of AGI for various income ranges: 1107.9% for AGIs below $25k, 3300.4% for AGIs $25k-50k, 5802.1% for AGIs $50k-75k, 8120.9% for AGIs $75k-100k, 14984.9% for AGIs $100k-200k, 68736.2% for AGIs over 200k)
Taxable interest for individuals: $2,753 (reported on 26.7% of returns)
This zip code:
$2,753
Texas:
$2,665
(% of AGI for various income ranges: 19.0% for AGIs below $25k, 26.2% for AGIs $25k-50k, 61.5% for AGIs $50k-75k, 136.3% for AGIs $75k-100k, 215.9% for AGIs $100k-200k, 2525.6% for AGIs over 200k)
Ordinary dividends: $9,072 (reported on 18.1% of returns)
Here:
$9,072
State:
$10,044
(% of AGI for various income ranges: 28.4% for AGIs below $25k, 45.7% for AGIs $25k-50k, 140.1% for AGIs $50k-75k, 176.5% for AGIs $75k-100k, 490.7% for AGIs $100k-200k, 6660.6% for AGIs over 200k)
Net capital gain/loss in AGI: +$28,721 (reported on 17.5% of returns)
Here:
+$28,721
State:
+$39,590
(% of AGI for various income ranges: 12.3% for AGIs below $25k, 43.3% for AGIs $25k-50k, 127.7% for AGIs $50k-75k, 212.4% for AGIs $75k-100k, 895.5% for AGIs $100k-200k, 30503.8% for AGIs over 200k)
Profit/loss from business: +$11,765 (reported on 21.4% of returns)
Here:
+$11,765
State:
+$10,888
(% of AGI for various income ranges: 206.2% for AGIs below $25k, 281.1% for AGIs $25k-50k, 322.5% for AGIs $50k-75k, 272.3% for AGIs $75k-100k, 684.7% for AGIs $100k-200k, 3603.8% for AGIs over 200k)
Taxable individual retirement arrangement distribution: $23,817 (reported on 11.8% of returns)
76048:
$23,817
Texas:
$24,740
(% of AGI for various income ranges: 54.8% for AGIs below $25k, 121.7% for AGIs $25k-50k, 343.9% for AGIs $50k-75k, 579.6% for AGIs $75k-100k, 1469.0% for AGIs $100k-200k, 4811.2% for AGIs over 200k)
Self-employed (Keogh) retirement plans: $18,275 (reported on 0.3% of returns)
76048:
$18,275
Texas:
$29,298
(% of AGI for various income ranges: 77.8% for AGIs $100k-200k)
Total itemized deductions: $40,193 (reported on 6.9% of returns)
Here:
$40,193
State:
$40,428
(% of AGI for various income ranges: 38.3% for AGIs below $25k, 108.8% for AGIs $25k-50k, 259.7% for AGIs $50k-75k, 417.5% for AGIs $75k-100k, 1031.7% for AGIs $100k-200k, 9057.5% for AGIs over 200k)
Charity contributions: $15,604 (reported on 5.6% of returns)
Here:
$15,604
State:
$18,201
(% of AGI for various income ranges: 4.1% for AGIs below $25k, 20.2% for AGIs $25k-50k, 54.1% for AGIs $50k-75k, 88.4% for AGIs $75k-100k, 285.6% for AGIs $100k-200k, 3855.0% for AGIs over 200k)
Taxes paid: $7,084 (reported on 6.8% of returns)
76048:
$7,084
State:
$7,821
(% of AGI for various income ranges: 7.0% for AGIs below $25k, 20.3% for AGIs $25k-50k, 47.3% for AGIs $50k-75k, 79.1% for AGIs $75k-100k, 209.1% for AGIs $100k-200k, 1288.8% for AGIs over 200k)
Earned income credit: $2,326 (reported on 17.5% of returns)
Here:
$2,326
State:
$2,584
(% of AGI for various income ranges: 104.5% for AGIs below $25k, 77.3% for AGIs $25k-50k, 2.2% for AGIs $50k-75k)
Percentage of individuals using paid preparers for their 2020 taxes: 92.0%
Here:
92%
State:
92%
(% for various income ranges: 90.5% for AGIs below $25k, 92.9% for AGIs $25k-50k, 92.0% for AGIs $50k-75k, 93.6% for AGIs $75k-100k, 92.9% for AGIs $100k-200k, 93.0% for AGIs over 200k)
Averages for the 2012 tax year for zip code 76048, filed in 2013:
Average Adjusted Gross Income (AGI) in 2012: $60,413 (Individual Income Tax Returns)
Here:
$60,413
State:
$65,384
Salary/wage: $47,677 (reported on 76.8% of returns)
Here:
$47,677
State:
$52,524
(% of AGI for various income ranges: 69.7% for AGIs below $25k, 73.8% for AGIs $25k-50k, 72.1% for AGIs $50k-75k, 68.4% for AGIs $75k-100k, 66.7% for AGIs $100k-200k, 37.8% for AGIs over 200k)
Taxable interest for individuals: $2,127 (reported on 28.0% of returns)
This zip code:
$2,127
Texas:
$2,372
(% of AGI for various income ranges: 1.2% for AGIs below $25k, 0.9% for AGIs $25k-50k, 0.8% for AGIs $50k-75k, 0.9% for AGIs $75k-100k, 1.0% for AGIs $100k-200k, 1.1% for AGIs over 200k)
Ordinary dividends: $6,327 (reported on 17.7% of returns)
Here:
$6,327
State:
$9,721
(% of AGI for various income ranges: 2.2% for AGIs below $25k, 1.2% for AGIs $25k-50k, 1.0% for AGIs $50k-75k, 1.7% for AGIs $75k-100k, 1.8% for AGIs $100k-200k, 2.6% for AGIs over 200k)
Net capital gain/loss in AGI: +$27,333 (reported on 15.4% of returns)
Here:
+$27,333
State:
+$35,319
(% of AGI for various income ranges: 0.1% for AGIs below $25k, 0.2% for AGIs $25k-50k, 0.5% for AGIs $50k-75k, 1.0% for AGIs $75k-100k, 1.7% for AGIs $100k-200k, 22.2% for AGIs over 200k)
Profit/loss from business: +$14,318 (reported on 19.9% of returns)
Here:
+$14,318
State:
+$13,732
(% of AGI for various income ranges: 11.6% for AGIs below $25k, 4.1% for AGIs $25k-50k, 2.8% for AGIs $50k-75k, 2.6% for AGIs $75k-100k, 3.9% for AGIs $100k-200k, 5.4% for AGIs over 200k)
Taxable individual retirement arrangement distribution: $20,050 (reported on 13.0% of returns)
76048:
$20,050
Texas:
$19,511
(% of AGI for various income ranges: 3.2% for AGIs below $25k, 3.1% for AGIs $25k-50k, 3.5% for AGIs $50k-75k, 6.6% for AGIs $75k-100k, 5.3% for AGIs $100k-200k, 3.9% for AGIs over 200k)
Self-employment retirement plans: $20,675 (reported on 0.4% of returns)
76048:
$20,675
Texas:
$23,938
Total itemized deductions: $24,189 (19% of AGI, reported on 24.0% of returns)
Here:
$24,189
State:
$24,724
Here:
18.8% of AGI
State:
15.9% of AGI
(% of AGI for various income ranges: 8.7% for AGIs below $25k, 9.2% for AGIs $25k-50k, 9.3% for AGIs $50k-75k, 10.2% for AGIs $75k-100k, 11.2% for AGIs $100k-200k, 8.7% for AGIs over 200k)
Charity contributions: $6,343 (reported on 18.2% of returns)
Here:
$6,343
State:
$6,808
(% of AGI for various income ranges: 0.9% for AGIs below $25k, 1.1% for AGIs $25k-50k, 1.3% for AGIs $50k-75k, 1.9% for AGIs $75k-100k, 2.3% for AGIs $100k-200k, 2.6% for AGIs over 200k)
Taxes paid: $5,628 (reported on 23.4% of returns)
76048:
$5,628
State:
$6,921
(% of AGI for various income ranges: 1.5% for AGIs below $25k, 1.6% for AGIs $25k-50k, 1.8% for AGIs $50k-75k, 2.3% for AGIs $75k-100k, 3.2% for AGIs $100k-200k, 1.9% for AGIs over 200k)
Earned income credit: $2,357 (reported on 20.1% of returns)
Here:
$2,357
State:
$2,570
(% of AGI for various income ranges: 7.1% for AGIs below $25k, 1.2% for AGIs $25k-50k)
Percentage of individuals using paid preparers for their 2012 taxes: 53.1%
Here:
53%
State:
51%
(% for various income ranges: 47.9% for AGIs below $25k, 49.6% for AGIs $25k-50k, 57.1% for AGIs $50k-75k, 57.5% for AGIs $75k-100k, 65.7% for AGIs $100k-200k, 75.8% for AGIs over 200k)
Averages for the 2004 tax year for zip code 76048, filed in 2005:
Average Adjusted Gross Income (AGI) in 2004: $41,798 (Individual Income Tax Returns)
Here:
$41,798
State:
$47,881
Salary/wage: $37,273 (reported on 78.4% of returns)
Here:
$37,273
State:
$41,947
(% of AGI for various income ranges: 153.4% for AGIs below $10k, 71.8% for AGIs $10k-25k, 75.1% for AGIs $25k-50k, 71.6% for AGIs $50k-75k, 76.7% for AGIs $75k-100k, 58.3% for AGIs over 100k)
Taxable interest for individuals: $2,204 (reported on 35.9% of returns)
This zip code:
$2,204
Texas:
$2,255
(% of AGI for various income ranges: 8.0% for AGIs below $10k, 2.0% for AGIs $10k-25k, 1.5% for AGIs $25k-50k, 1.7% for AGIs $50k-75k, 1.7% for AGIs $75k-100k, 2.0% for AGIs over 100k)
Taxable dividends: $3,231 (reported on 19.6% of returns)
Here:
$3,231
State:
$4,261
(% of AGI for various income ranges: 3.7% for AGIs below $10k, 1.1% for AGIs $10k-25k, 1.0% for AGIs $25k-50k, 1.2% for AGIs $50k-75k, 0.9% for AGIs $75k-100k, 2.3% for AGIs over 100k)
Net capital gain/loss: +$12,850 (reported on 17.8% of returns)
Here:
+$12,850
State:
+$16,110
(% of AGI for various income ranges: -2.2% for AGIs below $10k, 0.3% for AGIs $10k-25k, 0.7% for AGIs $25k-50k, 1.1% for AGIs $50k-75k, 1.5% for AGIs $75k-100k, 14.8% for AGIs over 100k)
Profit/loss from business: +$9,262 (reported on 20.8% of returns)
Here:
+$9,262
State:
+$11,013
(% of AGI for various income ranges: 4.6% for AGIs below $10k, 8.9% for AGIs $10k-25k, 4.6% for AGIs $25k-50k, 3.4% for AGIs $50k-75k, 1.9% for AGIs $75k-100k, 5.1% for AGIs over 100k)
IRA payment deduction: $3,380 (reported on 2.2% of returns)
76048:
$3,380
Texas:
$3,120
(% of AGI for various income ranges: 0.1% for AGIs $10k-25k, 0.3% for AGIs $25k-50k, 0.2% for AGIs $50k-75k, 0.2% for AGIs $75k-100k, 0.1% for AGIs over 100k)
Self-employed pension: $11,839 (reported on 0.7% of returns)
Here:
$11,839
Texas:
$16,401
(% of AGI for various income ranges: 0.2% for AGIs $10k-25k, 0.2% for AGIs $50k-75k, 0.4% for AGIs over 100k)
Total itemized deductions: $18,175 (22% of AGI, reported on 24.5% of returns)
Here:
$18,175
State:
$19,631
Here:
21.9% of AGI
State:
18.9% of AGI
(% of AGI for various income ranges: 21.4% for AGIs below $10k, 8.5% for AGIs $10k-25k, 9.9% for AGIs $25k-50k, 10.5% for AGIs $50k-75k, 12.3% for AGIs $75k-100k, 10.7% for AGIs over 100k)
Charity contributions deductions: $3,975 (4% of AGI, reported on 19.4% of returns)
Here:
$3,975
State:
$4,753
Here:
4.4% of AGI
State:
4.2% of AGI
(% of AGI for various income ranges: 1.2% for AGIs below $10k, 0.9% for AGIs $10k-25k, 1.4% for AGIs $25k-50k, 1.8% for AGIs $50k-75k, 2.2% for AGIs $75k-100k, 2.3% for AGIs over 100k)
Total tax: $6,622 (reported on 72.5% of returns)
76048:
$6,622
State:
$9,058
(% of AGI for various income ranges: 5.9% for AGIs below $10k, 4.2% for AGIs $10k-25k, 6.7% for AGIs $25k-50k, 9.3% for AGIs $50k-75k, 11.3% for AGIs $75k-100k, 18.4% for AGIs over 100k)
Earned income credit: $1,885 (reported on 19.5% of returns)
Here:
$1,885
State:
$2,024
Percentage of individuals using paid preparers for their 2004 taxes: 61.9%
Here:
62%
State:
57%
(% for various income ranges: 55.3% for AGIs below $10k, 63.1% for AGIs $10k-25k, 64.2% for AGIs $25k-50k, 63.5% for AGIs $50k-75k, 60.5% for AGIs $75k-100k, 68.5% for AGIs over 100k)
Likely homosexual households (counted as self-reported same-sex unmarried-partner households)
Lesbian couples: 0.1% of all households
Gay men: 0.1% of all households
Household received Food Stamps/SNAP in the past 12 months: 754 Household did not receive Food Stamps/SNAP in the past 12 months: 10,928
Women who had a birth in the past 12 months: 510 (296 now married, 211 unmarried) Women who did not have a birth in the past 12 months: 5,236 (2,411 now married, 2,821 unmarried)
Housing units in zip code 76048 with a mortgage: 4,427 (141 second mortgage, 47 home equity loan, 98 both second mortgage and home equity loan) Houses without a mortgage: 175
Median monthly owner costs for units with a mortgage: $1,560 Median monthly owner costs for units without a mortgage: $525
Residents with income below the poverty level in 2022:
This zip code:
12.3%
Whole state:
14.0%
Residents with income below 50% of the poverty level in 2022:
This zip code:
8.4%
Whole state:
7.4%
Median number of rooms in houses and condos:
Here:
5.6
State:
6.3
Median number of rooms in apartments:
Here:
3.9
State:
4.0
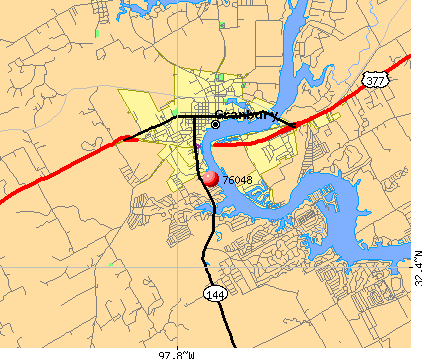
Notable locations in this zip code not listed on our city pages
Notable locations in zip code 76048: Black Ranch (A), Camp Crucis (B), Camp Klebit (C), Hood County Courthouse Historic District (D), Hood County Volunteer Fire Department Station 70 (E), Indian Harbor Volunteer Fire Department and First Responders (F), Grandbury Volunteer Fire Department Station 1 (G), Texas Forest Service Granbury Office (H), Granbury Hood County Emergency Medical Services (I), Wright-Henderson-Duncan House (J). Display/hide their locations on the map
Churches in zip code 76048 include: Cedar Grove Church (A), Our Savior Lutheran Church (B), Church of the Nazarene (C), Paluxy Road Church of Christ (D), Christian Science Society Granbury Church (E), Vineyard Baptist Church (F), Southside Baptist Church (G), Mambrino Baptist Church (H), Lakeside Baptist Church (I). Display/hide their locations on the map
Cemeteries: Mitchell Bend Cemetery (1), Brushy Cemetery (2), Granbury Cemetery (3), Elm Flat Cemetery (4), Thorp Spring Cemetery (5), Herring Cemetery (6). Display/hide their locations on the map
Reservoirs: Bowser Lake (A), Black Lake (B), Comanche Harbor Lake (C), Black Lake Number 3 (D), Black Lake Number 4 (E), Black Lake Number 5 (F), Black Lake Number 6 (G), Black Lake Number 7 (H). Display/hide their locations on the map
Streams, rivers, and creeks: Walnut Creek (A), South Fork Strouds Creek (B), Rough Creek (C), Fall Branch (D), Lambert Branch (E), Crow Branch (F), Contrary Creek (G), Blue Branch (H). Display/hide their locations on the map
In group quarters: 799 (-1 institutionalized population)
Size of family households: 4,177 2-persons, 1,340 3-persons, 1,392 4-persons, 376 5-persons, 226 6-persons, 74 7-or-more-persons
Size of nonfamily households: 3,631 1-person, 533 2-persons, 13 3-persons
3,993 married couples with children.
1,209 single-parent households (287 men, 922 women).
87.2% of residents of 76048 zip code speak English at home.
11.8% of residents speak Spanish at home (62% very well, 18% well, 17% not well, 3% not at all).
0.8% of residents speak other Indo-European language at home (73% very well, 27% well).
0.2% of residents speak Asian or Pacific Island language at home (22% very well, 49% well, 20% not well, 8% not at all).
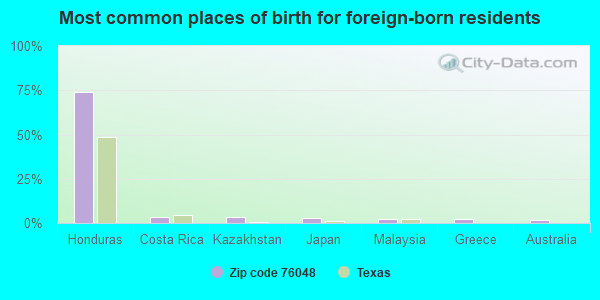
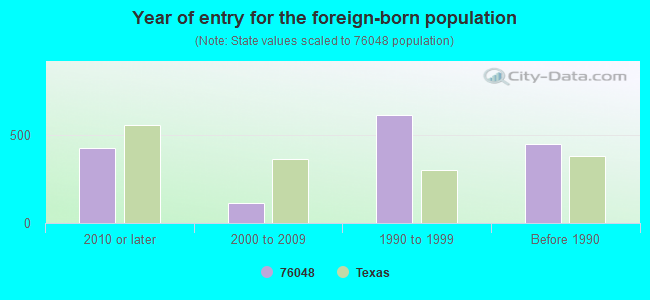
Foreign born population: 1,511 (5.5%) (37.4% of them are naturalized citizens)
This zip code:
5.5%
Whole state:
17.2%
74%Honduras
3%Costa Rica
3%Kazakhstan
3%Japan
2%Malaysia
2%Greece
2%Australia
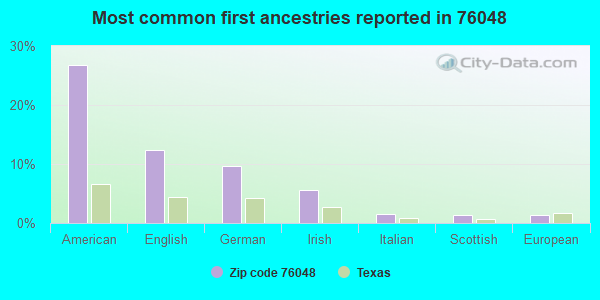
27%American
12%English
10%German
6%Irish
2%Italian
1%Scottish
1%European
Year of entry for the foreign-born population
4262010 or later
1152000 to 2009
6121990 to 1999
445Before 1990
Facilities with environmental interests located in this zip code:
AUTO ZONE (1000 SOUTH MORGAN in GRANBURY, TX)
AIR MINOR (AIRS/AFS) (Integrated Compliance Information System) - ICIS-06-2003-3320, FORMAL ENFORCEMENT ACTION, ENFORCEMENT/COMPLIANCE ACTIVITY (Integrated Compliance Information System) - ICIS-06-2003-3320, FORMAL ENFORCEMENT ACTION, ENFORCEMENT/COMPLIANCE ACTIVITY Business SIC classification: AUTO AND HOME SUPPLY STORES
ACTON MIDDLE SCHOOL (1300 JAMES RD in GRANBURY, TX)
(National Center for Education Statistics) - STATE ID-111901042 Organizations: GRANBURY ISD (SCHOOL DISTRICT)
Housing units lacking complete plumbing facilities: 2.4% Housing units lacking complete kitchen facilities: 3.0%
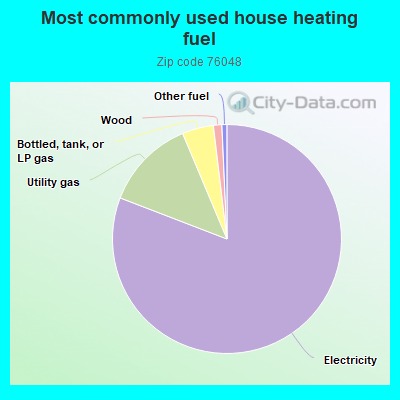
80.6%Electricity
12.8%Utility gas
4.4%Bottled, tank, or LP gas
1.2%Wood
0.7%Other fuel
Population in 1990: 13,718. Population change in the 1990s: +5,600 (+40.8%).
Place of birth for U.S.-born residents:
This state: 17,272
Northeast: 968
Midwest: 2,602
South: 2,542
West: 2,738
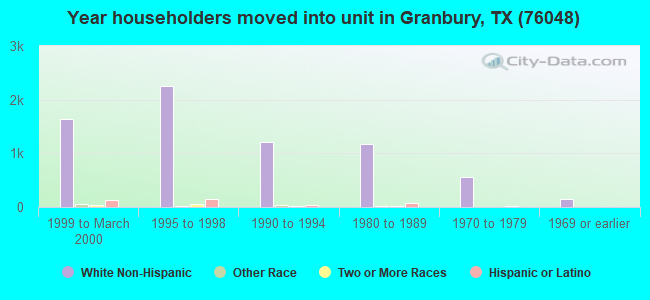
46% of the 76048 zip code residents lived in the same house 5 years ago. Out of people who lived in different houses, 43% lived in this county. Out of people who lived in different counties, 50% lived in Texas.
89% of the 76048 zip code residents lived in the same house 1 year ago. Out of people who lived in different houses, 32% moved from this county. Out of people who lived in different houses, 52% moved from different county within same state. Out of people who lived in different houses, 18% moved from different state. Out of people who lived in different houses, 0% moved from abroad.
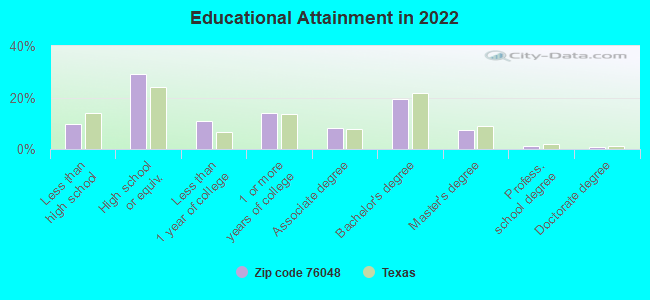
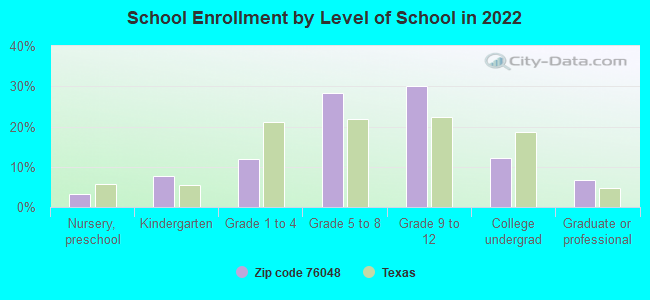
Private vs. public school enrollment:
Students in private schools in grades 1 to 8 (elementary and middle school): 328
Here:
16.6%
Texas:
8.8%
Students in private schools in grades 9 to 12 (high school): 141
Here:
9.6%
Texas:
8.0%
Students in private undergraduate colleges: 141
Here:
24.1%
Texas:
16.2%
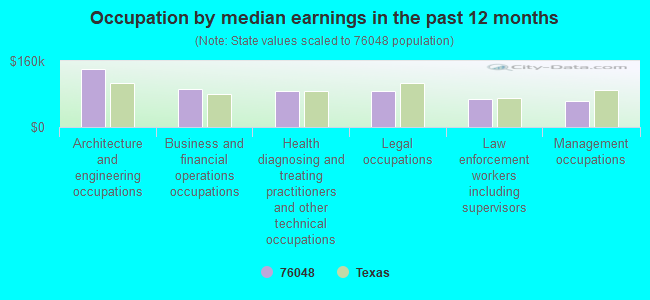
Occupation by median earnings in the past 12 months ($)
140,649Architecture and engineering occupations
92,387Business and financial operations occupations
87,415Health diagnosing and treating practitioners and other technical occupations
86,466Legal occupations
67,216Law enforcement workers including supervisors
63,217Management occupations
Companies with federal contracts located in this zip code:
ADVANCED TECHNOLOGY & RESEARCH (2806 HILLTOP RD in GRANBURY, TX; small business) : $102,992 in 5 contractsfrom 2004 to 2005
Contracts for Services -- Operational Systems Development (R&D), Other Research and Development -- Basic Research (R&D) by Navy Signed by year:2000: $0; 2001: $0; 2002: $0; 2003: $0; 2004: $73,552; 2005: $29,440; 2006: $0.
Biggest contracts:
$35,306 with Navy for Services -- Operational Systems Development (R&D). Taking place in MD. Signed on 2004-12-02. Completion date: 2005-01-28.
$24,746, same as above.Signed on 2004-10-20. Completion date: 2005-01-28.
$24,440, same as above.Signed on 2005-02-04. Completion date: 2005-04-28.
$13,500 with Navy for Other Research and Development -- Basic Research (R&D). Taking place in MD. Signed on 2004-12-07. Completion date: 2004-12-30.
The Lodge of Granbury (401 East Pearl Street in Granbury, TX; small business)
$19,573 with Forest Service for Lodging - Hotel/Motel. Signed on 2006-01-10. Completion date: 2006-01-10.
COLOR VISUAL CONCEPTS INC (1814 HUNTERS COURT in GRANBURY, TX; small business)
$8,370 with Army for Clothing, Special Purpose. Signed on 2005-09-26. Completion date: 2005-10-24.
BENJAMIN MILLER (2022 ROBERTS DR in GRANBURY, TX; small business) : $5,938 in 3 contractsfrom 2001 to 2002
$3,552 with U.S. Army Corps of Engineers - civil program financing only for Technical Assistance. Taking place in MS. Signed on 2002-06-24. Completion date: 2002-09-30.
$1,480 with U.S. Army Corps of Engineers - civil program financing only for Technical Assistance. Signed on 2002-04-05. Completion date: 2002-04-05.
$906 with U.S. Army Corps of Engineers - civil program financing only for Technical Assistance. Taking place in MS. Signed on 2001-10-09. Completion date: 2002-09-30.
Top industries in this zip code by the number of employees in 2005:
2002 - 2018 National Fire Incident Reporting System (NFIRS) incidents
According to the data from the years 2002 - 2018 the average number of fires per year is 156. The highest number of reported fires - 332 took place in 2005, and the least - 23 in 2010. The data has an increasing trend.
When looking into fire subcategories, the most reports belonged to: Outside Fires (53.8%), and Structure Fires (34.2%).
Fire incident types reported to NFIRS in Zip Code 76048


 Nearest zip codes: 76049, 76476, 76077, 76043, 76070, 76462.


 According to the data from the years 2002 - 2018 the average number of fires per year is 156. The highest number of reported fires - 332 took place in 2005, and the least - 23 in 2010. The data has an increasing trend.
 When looking into fire subcategories, the most reports belonged to: Outside Fires (53.8%), and Structure Fires (34.2%).