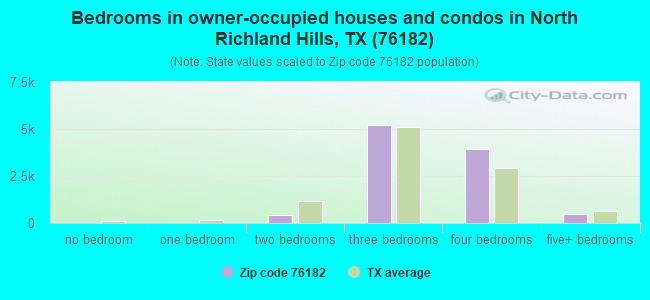
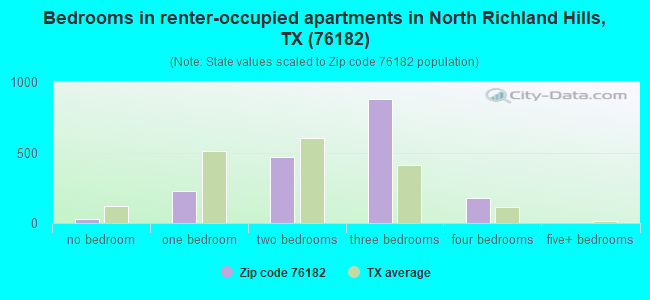
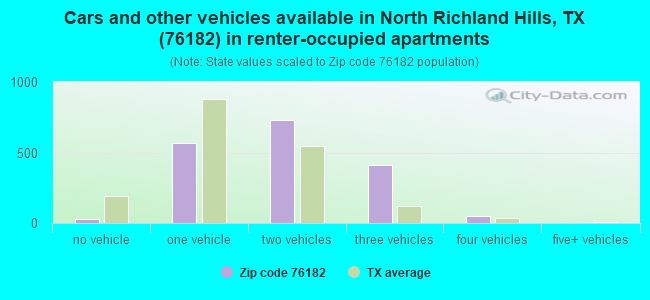
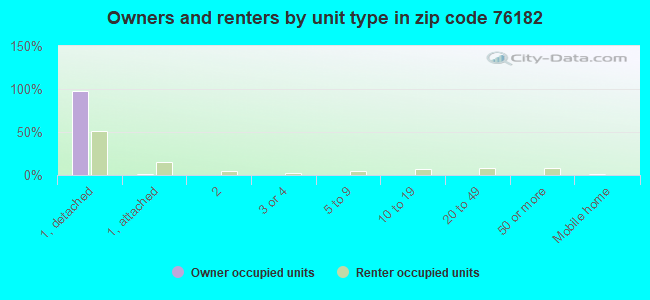
Houses and condos: 12,066 Renter-occupied apartments: 1,803
% of renters here:
15%
State:
38%
March 2022 cost of living index in zip code 76182: 87.3 (less than average, U.S. average is 100)
Land area: 8.8 sq. mi. Water area: 0.0 sq. mi.
Population density: 3,567 people per square mile
(average).
OSM Map
Google Map
MSN Map
OSM Map
General Map
Google Map
MSN Map
OSM Map
Google Map
MSN Map
OSM Map
Google Map
MSN Map
Please wait while loading the map...
Real estate property taxes paid for housing units in 2022:
This zip code:
1.6% ($6,426)
Texas:
1.5% ($4,050)
Median real estate property taxes paid for housing units with mortgages in 2022: $7,031 (1.7%) Median real estate property taxes paid for housing units with no mortgage in 2022: $5,503 (1.5%)
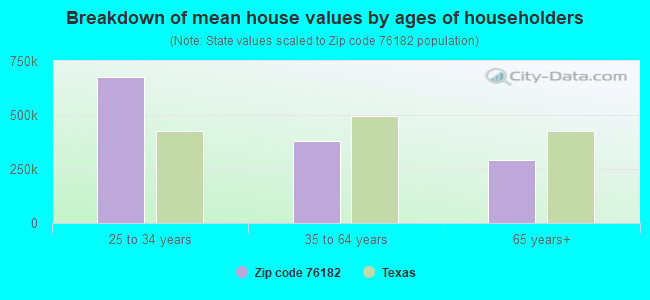
Estimated median house/condo value in 2022: $394,354
76182:
$394,354
Texas:
$275,400
According to our research of Texas and other state lists, there were 12 registered sex offenders living in 76182 zip code as of April 24, 2024. The ratio of all residents to sex offenders in zip code 76182 is 2,590 to 1. The ratio of registered sex offenders to all residents in this zip code is much lower than the state average.
Median resident age:
This zip code:
43.1 years
Texas median age:
35.6 years
Average household size:
This zip code:
2.6 people
Texas:
2.6 people
Averages for the 2020 tax year for zip code 76182, filed in 2021:
Average Adjusted Gross Income (AGI) in 2020: $93,722 (Individual Income Tax Returns)
Here:
$93,722
State:
$77,054
Salary/wage: $81,960 (reported on 81.7% of returns)
Here:
$81,960
State:
$62,766
(% of AGI for various income ranges: 1068.9% for AGIs below $25k, 3563.1% for AGIs $25k-50k, 6016.2% for AGIs $50k-75k, 9018.1% for AGIs $75k-100k, 17908.7% for AGIs $100k-200k, 64841.9% for AGIs over 200k)
Taxable interest for individuals: $1,342 (reported on 35.0% of returns)
This zip code:
$1,342
Texas:
$2,665
(% of AGI for various income ranges: 17.7% for AGIs below $25k, 33.8% for AGIs $25k-50k, 39.1% for AGIs $50k-75k, 78.7% for AGIs $75k-100k, 102.7% for AGIs $100k-200k, 435.9% for AGIs over 200k)
Ordinary dividends: $4,429 (reported on 25.0% of returns)
Here:
$4,429
State:
$10,044
(% of AGI for various income ranges: 25.8% for AGIs below $25k, 53.9% for AGIs $25k-50k, 82.2% for AGIs $50k-75k, 171.3% for AGIs $75k-100k, 234.0% for AGIs $100k-200k, 1303.0% for AGIs over 200k)
Net capital gain/loss in AGI: +$16,277 (reported on 23.2% of returns)
Here:
+$16,277
State:
+$39,590
(% of AGI for various income ranges: 13.7% for AGIs below $25k, 42.6% for AGIs $25k-50k, 107.1% for AGIs $50k-75k, 202.8% for AGIs $75k-100k, 433.3% for AGIs $100k-200k, 8082.4% for AGIs over 200k)
Profit/loss from business: +$14,008 (reported on 20.2% of returns)
Here:
+$14,008
State:
+$10,888
(% of AGI for various income ranges: 92.0% for AGIs below $25k, 137.2% for AGIs $25k-50k, 258.7% for AGIs $50k-75k, 292.8% for AGIs $75k-100k, 643.0% for AGIs $100k-200k, 3162.8% for AGIs over 200k)
Taxable individual retirement arrangement distribution: $23,180 (reported on 11.9% of returns)
76182:
$23,180
Texas:
$24,740
(% of AGI for various income ranges: 71.8% for AGIs below $25k, 152.5% for AGIs $25k-50k, 273.6% for AGIs $50k-75k, 464.0% for AGIs $75k-100k, 806.9% for AGIs $100k-200k, 1988.7% for AGIs over 200k)
Self-employed (Keogh) retirement plans: $17,878 (reported on 0.6% of returns)
76182:
$17,878
Texas:
$29,298
(% of AGI for various income ranges: 25.8% for AGIs $100k-200k, 196.7% for AGIs over 200k)
Total itemized deductions: $35,159 (reported on 14.1% of returns)
Here:
$35,159
State:
$40,428
(% of AGI for various income ranges: 50.2% for AGIs below $25k, 200.7% for AGIs $25k-50k, 369.9% for AGIs $50k-75k, 657.6% for AGIs $75k-100k, 1168.4% for AGIs $100k-200k, 6093.1% for AGIs over 200k)
Charity contributions: $13,225 (reported on 12.0% of returns)
Here:
$13,225
State:
$18,201
(% of AGI for various income ranges: 6.1% for AGIs below $25k, 35.0% for AGIs $25k-50k, 75.1% for AGIs $50k-75k, 157.1% for AGIs $75k-100k, 352.5% for AGIs $100k-200k, 2428.3% for AGIs over 200k)
Taxes paid: $8,347 (reported on 14.0% of returns)
76182:
$8,347
State:
$7,821
(% of AGI for various income ranges: 11.4% for AGIs below $25k, 43.8% for AGIs $25k-50k, 101.3% for AGIs $50k-75k, 161.2% for AGIs $75k-100k, 320.8% for AGIs $100k-200k, 1212.8% for AGIs over 200k)
Earned income credit: $2,031 (reported on 8.9% of returns)
Here:
$2,031
State:
$2,584
(% of AGI for various income ranges: 61.6% for AGIs below $25k, 50.6% for AGIs $25k-50k, 1.2% for AGIs $50k-75k)
Percentage of individuals using paid preparers for their 2020 taxes: 92.5%
Here:
92%
State:
92%
(% for various income ranges: 91.4% for AGIs below $25k, 92.6% for AGIs $25k-50k, 92.6% for AGIs $50k-75k, 92.8% for AGIs $75k-100k, 92.7% for AGIs $100k-200k, 93.9% for AGIs over 200k)
Averages for the 2012 tax year for zip code 76182, filed in 2013:
Average Adjusted Gross Income (AGI) in 2012: $75,273 (Individual Income Tax Returns)
Here:
$75,273
State:
$65,384
Salary/wage: $67,224 (reported on 87.0% of returns)
Here:
$67,224
State:
$52,524
(% of AGI for various income ranges: 75.7% for AGIs below $25k, 80.3% for AGIs $25k-50k, 78.6% for AGIs $50k-75k, 79.7% for AGIs $75k-100k, 83.3% for AGIs $100k-200k, 66.1% for AGIs over 200k)
Taxable interest for individuals: $1,091 (reported on 36.5% of returns)
This zip code:
$1,091
Texas:
$2,372
(% of AGI for various income ranges: 1.0% for AGIs below $25k, 0.7% for AGIs $25k-50k, 0.6% for AGIs $50k-75k, 0.4% for AGIs $75k-100k, 0.4% for AGIs $100k-200k, 0.6% for AGIs over 200k)
Ordinary dividends: $3,081 (reported on 21.8% of returns)
Here:
$3,081
State:
$9,721
(% of AGI for various income ranges: 1.5% for AGIs below $25k, 0.6% for AGIs $25k-50k, 0.8% for AGIs $50k-75k, 0.6% for AGIs $75k-100k, 0.7% for AGIs $100k-200k, 1.3% for AGIs over 200k)
Net capital gain/loss in AGI: +$7,793 (reported on 17.7% of returns)
Here:
+$7,793
State:
+$35,319
(% of AGI for various income ranges: 0.1% for AGIs $50k-75k, 0.3% for AGIs $75k-100k, 0.7% for AGIs $100k-200k, 6.7% for AGIs over 200k)
Profit/loss from business: +$12,428 (reported on 19.2% of returns)
Here:
+$12,428
State:
+$13,732
(% of AGI for various income ranges: 8.0% for AGIs below $25k, 3.4% for AGIs $25k-50k, 3.3% for AGIs $50k-75k, 2.9% for AGIs $75k-100k, 2.3% for AGIs $100k-200k, 3.6% for AGIs over 200k)
Taxable individual retirement arrangement distribution: $17,757 (reported on 10.8% of returns)
76182:
$17,757
Texas:
$19,511
(% of AGI for various income ranges: 3.7% for AGIs below $25k, 2.7% for AGIs $25k-50k, 2.5% for AGIs $50k-75k, 2.7% for AGIs $75k-100k, 2.8% for AGIs $100k-200k, 1.8% for AGIs over 200k)
Self-employment retirement plans: $15,122 (reported on 0.6% of returns)
76182:
$15,122
Texas:
$23,938
(% of AGI for various income ranges: 0.2% for AGIs $50k-75k, 0.1% for AGIs $100k-200k, 0.3% for AGIs over 200k)
Total itemized deductions: $22,794 (19% of AGI, reported on 40.9% of returns)
Here:
$22,794
State:
$24,724
Here:
18.8% of AGI
State:
15.9% of AGI
(% of AGI for various income ranges: 11.8% for AGIs below $25k, 12.0% for AGIs $25k-50k, 12.9% for AGIs $50k-75k, 13.2% for AGIs $75k-100k, 13.1% for AGIs $100k-200k, 10.8% for AGIs over 200k)
Charity contributions: $5,828 (reported on 35.1% of returns)
Here:
$5,828
State:
$6,808
(% of AGI for various income ranges: 1.2% for AGIs below $25k, 1.8% for AGIs $25k-50k, 2.2% for AGIs $50k-75k, 2.4% for AGIs $75k-100k, 2.9% for AGIs $100k-200k, 3.5% for AGIs over 200k)
Taxes paid: $7,036 (reported on 40.4% of returns)
76182:
$7,036
State:
$6,921
(% of AGI for various income ranges: 2.3% for AGIs below $25k, 3.1% for AGIs $25k-50k, 3.6% for AGIs $50k-75k, 4.0% for AGIs $75k-100k, 4.3% for AGIs $100k-200k, 3.5% for AGIs over 200k)
Earned income credit: $2,086 (reported on 10.8% of returns)
Here:
$2,086
State:
$2,570
(% of AGI for various income ranges: 4.7% for AGIs below $25k, 0.9% for AGIs $25k-50k)
Percentage of individuals using paid preparers for their 2012 taxes: 43.5%
Here:
44%
State:
51%
(% for various income ranges: 37.6% for AGIs below $25k, 41.1% for AGIs $25k-50k, 44.3% for AGIs $50k-75k, 44.8% for AGIs $75k-100k, 47.3% for AGIs $100k-200k, 66.7% for AGIs over 200k)
Averages for the 2004 tax year for zip code 76182, filed in 2005:
Average Adjusted Gross Income (AGI) in 2004: $50,652 (Individual Income Tax Returns)
Here:
$50,652
State:
$47,881
Salary/wage: $43,386 (reported on 82.0% of returns)
Here:
$43,386
State:
$41,947
(% of AGI for various income ranges: 83.0% for AGIs below $10k, 78.5% for AGIs $10k-25k, 79.9% for AGIs $25k-50k, 78.0% for AGIs $50k-75k, 77.0% for AGIs $75k-100k, 58.6% for AGIs over 100k)
Taxable interest for individuals: $4,313 (reported on 38.5% of returns)
This zip code:
$4,313
Texas:
$2,255
(% of AGI for various income ranges: 12.2% for AGIs below $10k, 0.7% for AGIs $10k-25k, 2.2% for AGIs $25k-50k, 0.9% for AGIs $50k-75k, 0.9% for AGIs $75k-100k, 5.8% for AGIs over 100k)
Taxable dividends: $1,880 (reported on 17.7% of returns)
Here:
$1,880
State:
$4,261
(% of AGI for various income ranges: 2.6% for AGIs below $10k, 0.2% for AGIs $25k-50k, 1.4% for AGIs $50k-75k, 0.8% for AGIs over 100k)
Net capital gain/loss: +$2,953 (reported on 15.1% of returns)
Here:
+$2,953
State:
+$16,110
Profit/loss from business: +$10,404 (reported on 23.4% of returns)
Here:
+$10,404
State:
+$11,013
(% of AGI for various income ranges: 32.5% for AGIs below $10k, 7.3% for AGIs $10k-25k, 0.6% for AGIs $25k-50k, 12.5% for AGIs $50k-75k, 3.5% for AGIs over 100k)
Total itemized deductions: $27,111 (29% of AGI, reported on 34.0% of returns)
Here:
$27,111
State:
$19,631
Here:
28.7% of AGI
State:
18.9% of AGI
(% of AGI for various income ranges: 12.6% for AGIs $10k-25k, 16.0% for AGIs $25k-50k, 13.8% for AGIs $50k-75k, 14.7% for AGIs $75k-100k, 23.9% for AGIs over 100k)
Charity contributions deductions: $6,077 (6% of AGI, reported on 27.7% of returns)
Here:
$6,077
State:
$4,753
Here:
6.0% of AGI
State:
4.2% of AGI
(% of AGI for various income ranges: 2.2% for AGIs $25k-50k, 3.0% for AGIs $50k-75k, 3.3% for AGIs $75k-100k, 4.7% for AGIs over 100k)
Total tax: $8,713 (reported on 77.5% of returns)
76182:
$8,713
State:
$9,058
(% of AGI for various income ranges: 6.6% for AGIs below $10k, 4.7% for AGIs $10k-25k, 8.1% for AGIs $25k-50k, 10.6% for AGIs $50k-75k, 11.7% for AGIs $75k-100k, 19.2% for AGIs over 100k)
Earned income credit: $2,172 (reported on 13.7% of returns)
Here:
$2,172
State:
$2,024
Percentage of individuals using paid preparers for their 2004 taxes: 51.8%
Here:
52%
State:
57%
(% for various income ranges: 37.0% for AGIs below $10k, 49.5% for AGIs $10k-25k, 51.0% for AGIs $25k-50k, 60.3% for AGIs $50k-75k, 55.9% for AGIs $75k-100k, 69.0% for AGIs over 100k)
Likely homosexual households (counted as self-reported same-sex unmarried-partner households)
Lesbian couples: 0.2% of all households
Gay men: 0.0% of all households
Household received Food Stamps/SNAP in the past 12 months: 269 Household did not receive Food Stamps/SNAP in the past 12 months: 11,567
Women who had a birth in the past 12 months: 323 (316 now married, 12 unmarried) Women who did not have a birth in the past 12 months: 6,382 (3,123 now married, 3,249 unmarried)
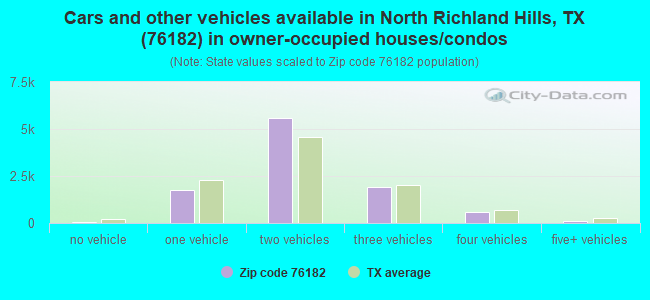
Housing units in zip code 76182 with a mortgage: 6,640 (417 second mortgage, 374 both second mortgage and home equity loan) Median monthly owner costs for units with a mortgage: $2,320 Median monthly owner costs for units without a mortgage: $917
Residents with income below the poverty level in 2022:
This zip code:
4.8%
Whole state:
14.0%
Residents with income below 50% of the poverty level in 2022:
This zip code:
2.4%
Whole state:
7.4%
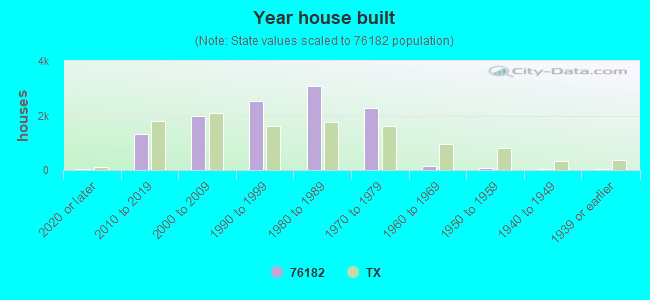
Median number of rooms in houses and condos:
Here:
7.1
State:
6.3
Median number of rooms in apartments:
Here:
4.7
State:
4.0
Notable locations in this zip code not listed on our city pages
Notable locations in zip code 76182: May (A), North Richland Hills Fire Department Station 4 (B), North Richland Hills Fire Department Station 1 (C). Display/hide their locations on the map
Churches in zip code 76182 include: Shady Grove Baptist Church (A), Church of Christ in Smithfield (B), First Baptist Church (C), North Park Baptist Church (D). Display/hide their locations on the map
5,340 married couples with children.
1,438 single-parent households (268 men, 1,170 women).
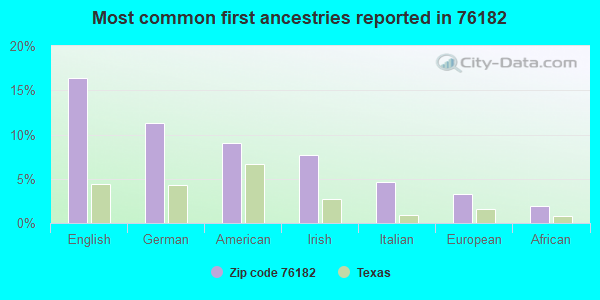
86.6% of residents of 76182 zip code speak English at home.
8.3% of residents speak Spanish at home (73% very well, 12% well, 9% not well, 7% not at all).
1.6% of residents speak other Indo-European language at home (59% very well, 16% well, 25% not well).
2.0% of residents speak Asian or Pacific Island language at home (53% very well, 45% well, 1% not well).
1.7% of residents speak other language at home (69% very well, 15% well, 16% not well).
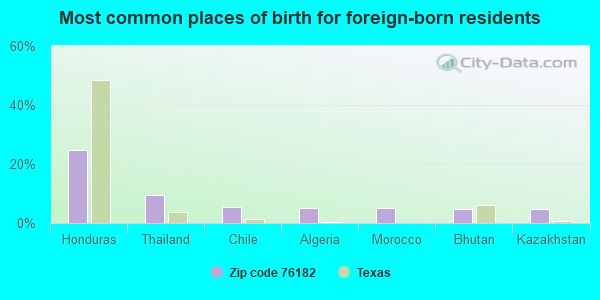
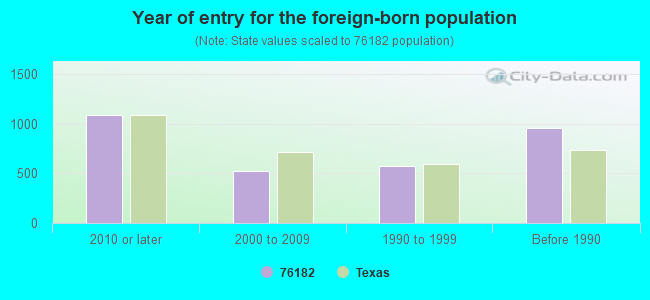
Foreign born population: 2,390 (7.6%) (65.9% of them are naturalized citizens)
Housing units lacking complete plumbing facilities: 1.3% Housing units lacking complete kitchen facilities: 2.5%
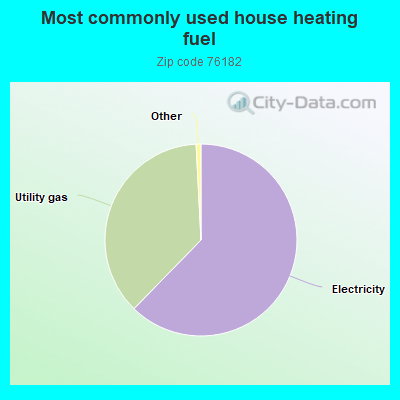
62.3%Electricity
36.9%Utility gas
Place of birth for U.S.-born residents:
This state: 17,391
Northeast: 1,559
Midwest: 3,440
South: 3,566
West: 2,260
91% of the 76182 zip code residents lived in the same house 1 year ago. Out of people who lived in different houses, 71% moved from this county. Out of people who lived in different houses, 15% moved from different county within same state. Out of people who lived in different houses, 11% moved from different state. Out of people who lived in different houses, 1% moved from abroad.
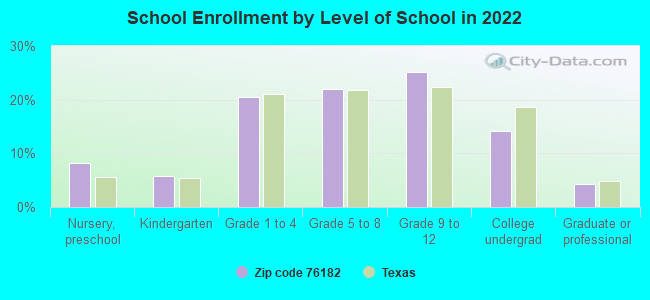
Private vs. public school enrollment:
Students in private schools in grades 1 to 8 (elementary and middle school): 328
Here:
10.5%
Texas:
8.8%
Students in private schools in grades 9 to 12 (high school): 148
Here:
8.1%
Texas:
8.0%
Students in private undergraduate colleges: 106
Here:
10.3%
Texas:
16.2%
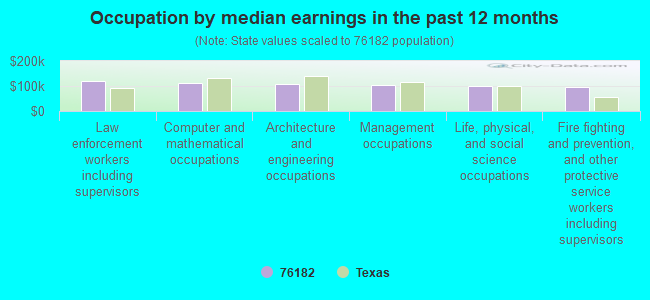
Occupation by median earnings in the past 12 months ($)
119,803Law enforcement workers including supervisors
112,654Computer and mathematical occupations
108,428Architecture and engineering occupations
102,660Management occupations
99,055Life, physical, and social science occupations
94,484Fire fighting and prevention, and other protective service workers including supervisors
Top industries in this zip code by the number of employees in 2005:
Other Services (except Public Administration): Religious Organizations (100-249 employees: 1 establishment, 5-9 employees: 1 establishment, 1-4 employees: 3 establishments)
Professional, Scientific, and Technical Services: Tax Preparation Services (50-99: 1)
Construction: Framing Contractors (20-49: 1)
Arts, Entertainment, and Recreation: All Other Amusement and Recreation Industries (10-19: 1)
Construction: Drywall and Insulation Contractors (10-19: 1)
Accommodation and Food Services: Limited-Service Restaurants (10-19: 1)
Real Estate and Rental and Leasing: Residential Property Managers (10-19: 1)
Construction: Poured Concrete Foundation and Structure Contractors (5-9: 1)
2009 - 2018 National Fire Incident Reporting System (NFIRS) incidents
According to the data from the years 2009 - 2018 the average number of fire incidents per year is 23. The highest number of reported fire incidents - 44 took place in 2015, and the least - 10 in 2009. The data has an increasing trend.
When looking into fire subcategories, the most reports belonged to: Structure Fires (46.1%), and Outside Fires (37.8%).
Fire incident types reported to NFIRS in Zip Code 76182


 According to the data from the years 2009 - 2018 the average number of fire incidents per year is 23. The highest number of reported fire incidents - 44 took place in 2015, and the least - 10 in 2009. The data has an increasing trend.
 When looking into fire subcategories, the most reports belonged to: Structure Fires (46.1%), and Outside Fires (37.8%).