Estimated zip code population in 2022: 43,203 Zip code population in 2010: 27,648 Zip code population in 2000: 15,475
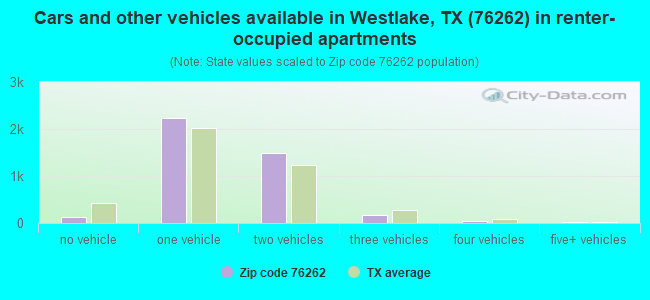
Houses and condos: 16,283 Renter-occupied apartments: 4,074
% of renters here:
26%
State:
38%
March 2022 cost of living index in zip code 76262: 96.1 (near average, U.S. average is 100)
Land area: 45.3 sq. mi. Water area: 1.0 sq. mi.
Population density: 953 people per square mile
(low).
OSM Map
General Map
Google Map
MSN Map
OSM Map
General Map
Google Map
MSN Map
OSM Map
General Map
Google Map
MSN Map
OSM Map
General Map
Google Map
MSN Map
Please wait while loading the map...
Real estate property taxes paid for housing units in 2022:
This zip code:
1.6% ($8,929)
Texas:
1.5% ($4,050)
Median real estate property taxes paid for housing units with mortgages in 2022: $9,031 (1.7%) Median real estate property taxes paid for housing units with no mortgage in 2022: $8,908 (1.5%)
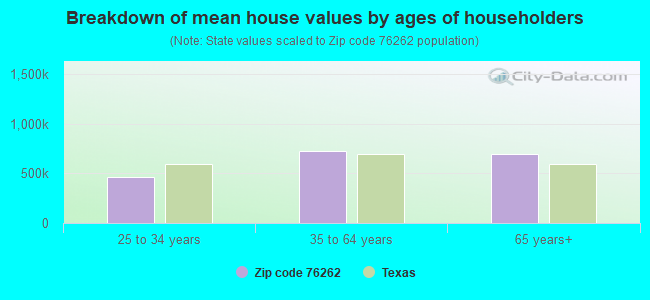
Estimated median house/condo value in 2022: $548,254
76262:
$548,254
Texas:
$275,400
According to our research of Texas and other state lists, there were 14 registered sex offenders living in 76262 zip code as of April 25, 2024. The ratio of all residents to sex offenders in zip code 76262 is 2,429 to 1. The ratio of registered sex offenders to all residents in this zip code is much lower than the state average.
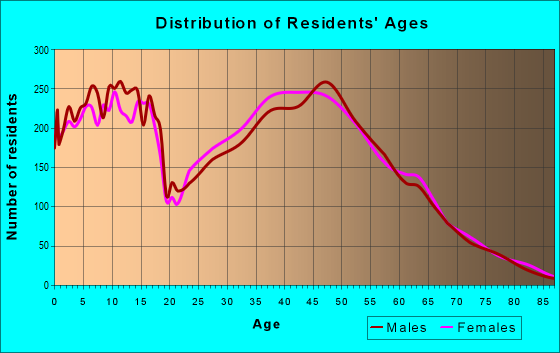
Median resident age:
This zip code:
37.7 years
Texas median age:
35.6 years
Average household size:
This zip code:
2.7 people
Texas:
2.6 people
Averages for the 2020 tax year for zip code 76262, filed in 2021:
Average Adjusted Gross Income (AGI) in 2020: $204,569 (Individual Income Tax Returns)
Here:
$204,569
State:
$77,054
Salary/wage: $137,210 (reported on 87.3% of returns)
Here:
$137,210
State:
$62,766
(% of AGI for various income ranges: 1147.2% for AGIs below $25k, 3657.6% for AGIs $25k-50k, 6789.3% for AGIs $50k-75k, 9884.7% for AGIs $75k-100k, 19370.2% for AGIs $100k-200k, 105347.4% for AGIs over 200k)
Taxable interest for individuals: $5,168 (reported on 36.6% of returns)
This zip code:
$5,168
Texas:
$2,665
(% of AGI for various income ranges: 12.7% for AGIs below $25k, 22.6% for AGIs $25k-50k, 28.1% for AGIs $50k-75k, 80.9% for AGIs $75k-100k, 135.0% for AGIs $100k-200k, 2236.2% for AGIs over 200k)
Ordinary dividends: $16,294 (reported on 31.0% of returns)
Here:
$16,294
State:
$10,044
(% of AGI for various income ranges: 29.7% for AGIs below $25k, 45.0% for AGIs $25k-50k, 87.7% for AGIs $50k-75k, 173.5% for AGIs $75k-100k, 350.5% for AGIs $100k-200k, 6055.1% for AGIs over 200k)
Net capital gain/loss in AGI: +$119,918 (reported on 30.5% of returns)
Here:
+$119,918
State:
+$39,590
(% of AGI for various income ranges: 18.1% for AGIs below $25k, 43.8% for AGIs $25k-50k, 107.4% for AGIs $50k-75k, 211.3% for AGIs $75k-100k, 502.7% for AGIs $100k-200k, 50279.8% for AGIs over 200k)
Profit/loss from business: +$20,505 (reported on 19.7% of returns)
Here:
+$20,505
State:
+$10,888
(% of AGI for various income ranges: 74.1% for AGIs below $25k, 119.1% for AGIs $25k-50k, 184.6% for AGIs $50k-75k, 277.1% for AGIs $75k-100k, 563.8% for AGIs $100k-200k, 3757.4% for AGIs over 200k)
Taxable individual retirement arrangement distribution: $32,532 (reported on 8.8% of returns)
76262:
$32,532
Texas:
$24,740
(% of AGI for various income ranges: 39.1% for AGIs below $25k, 90.9% for AGIs $25k-50k, 203.2% for AGIs $50k-75k, 468.1% for AGIs $75k-100k, 684.7% for AGIs $100k-200k, 1807.2% for AGIs over 200k)
Self-employed (Keogh) retirement plans: $36,658 (reported on 1.0% of returns)
76262:
$36,658
Texas:
$29,298
(% of AGI for various income ranges: 29.0% for AGIs $100k-200k, 435.9% for AGIs over 200k)
Total itemized deductions: $60,122 (reported on 20.9% of returns)
Here:
$60,122
State:
$40,428
(% of AGI for various income ranges: 65.8% for AGIs below $25k, 179.7% for AGIs $25k-50k, 341.2% for AGIs $50k-75k, 736.5% for AGIs $75k-100k, 1410.1% for AGIs $100k-200k, 13513.1% for AGIs over 200k)
Charity contributions: $31,546 (reported on 18.2% of returns)
Here:
$31,546
State:
$18,201
(% of AGI for various income ranges: 5.2% for AGIs below $25k, 24.8% for AGIs $25k-50k, 71.3% for AGIs $50k-75k, 151.9% for AGIs $75k-100k, 405.3% for AGIs $100k-200k, 7064.8% for AGIs over 200k)
Taxes paid: $8,997 (reported on 20.8% of returns)
76262:
$8,997
State:
$7,821
(% of AGI for various income ranges: 13.6% for AGIs below $25k, 40.7% for AGIs $25k-50k, 89.8% for AGIs $50k-75k, 196.6% for AGIs $75k-100k, 384.2% for AGIs $100k-200k, 1505.0% for AGIs over 200k)
Earned income credit: $1,943 (reported on 6.5% of returns)
Here:
$1,943
State:
$2,584
(% of AGI for various income ranges: 46.6% for AGIs below $25k, 41.4% for AGIs $25k-50k, 1.1% for AGIs $50k-75k)
Percentage of individuals using paid preparers for their 2020 taxes: 93.7%
Here:
94%
State:
92%
(% for various income ranges: 93.1% for AGIs below $25k, 93.0% for AGIs $25k-50k, 93.0% for AGIs $50k-75k, 93.0% for AGIs $75k-100k, 94.5% for AGIs $100k-200k, 94.6% for AGIs over 200k)
Averages for the 2012 tax year for zip code 76262, filed in 2013:
Average Adjusted Gross Income (AGI) in 2012: $144,443 (Individual Income Tax Returns)
Here:
$144,443
State:
$65,384
Salary/wage: $109,535 (reported on 88.1% of returns)
Here:
$109,535
State:
$52,524
(% of AGI for various income ranges: 80.3% for AGIs below $25k, 84.4% for AGIs $25k-50k, 82.9% for AGIs $50k-75k, 82.2% for AGIs $75k-100k, 83.8% for AGIs $100k-200k, 55.5% for AGIs over 200k)
Taxable interest for individuals: $3,532 (reported on 40.0% of returns)
This zip code:
$3,532
Texas:
$2,372
(% of AGI for various income ranges: 1.2% for AGIs below $25k, 0.6% for AGIs $25k-50k, 0.5% for AGIs $50k-75k, 0.4% for AGIs $75k-100k, 0.4% for AGIs $100k-200k, 1.3% for AGIs over 200k)
Ordinary dividends: $12,028 (reported on 26.3% of returns)
Here:
$12,028
State:
$9,721
(% of AGI for various income ranges: 1.8% for AGIs below $25k, 0.9% for AGIs $25k-50k, 0.8% for AGIs $50k-75k, 0.9% for AGIs $75k-100k, 1.0% for AGIs $100k-200k, 3.0% for AGIs over 200k)
Net capital gain/loss in AGI: +$46,161 (reported on 23.1% of returns)
Here:
+$46,161
State:
+$35,319
(% of AGI for various income ranges: 0.2% for AGIs below $25k, 0.2% for AGIs $25k-50k, 0.3% for AGIs $50k-75k, 0.6% for AGIs $75k-100k, 0.8% for AGIs $100k-200k, 12.0% for AGIs over 200k)
Profit/loss from business: +$18,714 (reported on 19.4% of returns)
Here:
+$18,714
State:
+$13,732
(% of AGI for various income ranges: 6.1% for AGIs below $25k, 3.2% for AGIs $25k-50k, 3.4% for AGIs $50k-75k, 2.7% for AGIs $75k-100k, 2.9% for AGIs $100k-200k, 2.1% for AGIs over 200k)
Taxable individual retirement arrangement distribution: $29,657 (reported on 10.0% of returns)
76262:
$29,657
Texas:
$19,511
(% of AGI for various income ranges: 3.6% for AGIs below $25k, 2.7% for AGIs $25k-50k, 2.7% for AGIs $50k-75k, 3.4% for AGIs $75k-100k, 3.1% for AGIs $100k-200k, 1.4% for AGIs over 200k)
Self-employment retirement plans: $27,883 (reported on 0.8% of returns)
76262:
$27,883
Texas:
$23,938
(% of AGI for various income ranges: 0.2% for AGIs $100k-200k, 0.2% for AGIs over 200k)
Total itemized deductions: $33,156 (13% of AGI, reported on 48.9% of returns)
Here:
$33,156
State:
$24,724
Here:
13.3% of AGI
State:
15.9% of AGI
(% of AGI for various income ranges: 14.0% for AGIs below $25k, 11.9% for AGIs $25k-50k, 14.7% for AGIs $50k-75k, 14.9% for AGIs $75k-100k, 14.6% for AGIs $100k-200k, 9.1% for AGIs over 200k)
Charity contributions: $9,877 (reported on 41.8% of returns)
Here:
$9,877
State:
$6,808
(% of AGI for various income ranges: 1.0% for AGIs below $25k, 1.8% for AGIs $25k-50k, 2.0% for AGIs $50k-75k, 2.3% for AGIs $75k-100k, 2.5% for AGIs $100k-200k, 3.3% for AGIs over 200k)
Taxes paid: $10,628 (reported on 48.4% of returns)
76262:
$10,628
State:
$6,921
(% of AGI for various income ranges: 3.5% for AGIs below $25k, 3.0% for AGIs $25k-50k, 4.2% for AGIs $50k-75k, 4.7% for AGIs $75k-100k, 5.0% for AGIs $100k-200k, 2.9% for AGIs over 200k)
Earned income credit: $2,101 (reported on 8.5% of returns)
Here:
$2,101
State:
$2,570
(% of AGI for various income ranges: 4.3% for AGIs below $25k, 0.9% for AGIs $25k-50k)
Percentage of individuals using paid preparers for their 2012 taxes: 45.4%
Here:
45%
State:
51%
(% for various income ranges: 40.3% for AGIs below $25k, 39.7% for AGIs $25k-50k, 42.3% for AGIs $50k-75k, 42.5% for AGIs $75k-100k, 47.0% for AGIs $100k-200k, 68.3% for AGIs over 200k)
Averages for the 2004 tax year for zip code 76262, filed in 2005:
Average Adjusted Gross Income (AGI) in 2004: $94,626 (Individual Income Tax Returns)
Here:
$94,626
State:
$47,881
Salary/wage: $82,784 (reported on 89.3% of returns)
Here:
$82,784
State:
$41,947
(% of AGI for various income ranges: 147.4% for AGIs below $10k, 80.6% for AGIs $10k-25k, 88.3% for AGIs $25k-50k, 84.2% for AGIs $50k-75k, 85.8% for AGIs $75k-100k, 74.2% for AGIs over 100k)
Taxable interest for individuals: $2,629 (reported on 48.2% of returns)
This zip code:
$2,629
Texas:
$2,255
(% of AGI for various income ranges: 8.6% for AGIs below $10k, 1.8% for AGIs $10k-25k, 0.8% for AGIs $25k-50k, 0.9% for AGIs $50k-75k, 0.9% for AGIs $75k-100k, 1.5% for AGIs over 100k)
Taxable dividends: $3,924 (reported on 30.3% of returns)
Here:
$3,924
State:
$4,261
(% of AGI for various income ranges: 4.8% for AGIs below $10k, 1.4% for AGIs $10k-25k, 0.6% for AGIs $25k-50k, 0.8% for AGIs $50k-75k, 0.9% for AGIs $75k-100k, 1.4% for AGIs over 100k)
Net capital gain/loss: +$16,904 (reported on 26.5% of returns)
Here:
+$16,904
State:
+$16,110
(% of AGI for various income ranges: 6.0% for AGIs below $10k, -0.3% for AGIs $10k-25k, 0.1% for AGIs $25k-50k, 0.7% for AGIs $50k-75k, 0.7% for AGIs $75k-100k, 6.7% for AGIs over 100k)
Profit/loss from business: +$14,965 (reported on 19.5% of returns)
Here:
+$14,965
State:
+$11,013
(% of AGI for various income ranges: 0.8% for AGIs below $10k, 6.2% for AGIs $10k-25k, 2.5% for AGIs $25k-50k, 2.7% for AGIs $50k-75k, 2.6% for AGIs $75k-100k, 3.2% for AGIs over 100k)
IRA payment deduction: $3,325 (reported on 2.9% of returns)
76262:
$3,325
Texas:
$3,120
(% of AGI for various income ranges: 0.7% for AGIs below $10k, 0.1% for AGIs $10k-25k, 0.1% for AGIs $25k-50k, 0.2% for AGIs $50k-75k, 0.2% for AGIs $75k-100k, 0.1% for AGIs over 100k)
Self-employed pension: $17,523 (reported on 1.3% of returns)
Here:
$17,523
Texas:
$16,401
(% of AGI for various income ranges: 0.1% for AGIs $25k-50k, 0.1% for AGIs $50k-75k, 0.1% for AGIs $75k-100k, 0.3% for AGIs over 100k)
Total itemized deductions: $27,269 (19% of AGI, reported on 51.8% of returns)
Here:
$27,269
State:
$19,631
Here:
18.5% of AGI
State:
18.9% of AGI
(% of AGI for various income ranges: 18.1% for AGIs below $10k, 13.5% for AGIs $10k-25k, 15.2% for AGIs $25k-50k, 18.6% for AGIs $50k-75k, 18.4% for AGIs $75k-100k, 13.9% for AGIs over 100k)
Charity contributions deductions: $4,897 (3% of AGI, reported on 45.3% of returns)
Here:
$4,897
State:
$4,753
Here:
3.3% of AGI
State:
4.2% of AGI
(% of AGI for various income ranges: 1.3% for AGIs below $10k, 1.3% for AGIs $10k-25k, 1.7% for AGIs $25k-50k, 2.2% for AGIs $50k-75k, 2.5% for AGIs $75k-100k, 2.5% for AGIs over 100k)
Total tax: $19,510 (reported on 83.1% of returns)
76262:
$19,510
State:
$9,058
(% of AGI for various income ranges: 4.4% for AGIs below $10k, 4.8% for AGIs $10k-25k, 7.0% for AGIs $25k-50k, 8.8% for AGIs $50k-75k, 10.1% for AGIs $75k-100k, 21.2% for AGIs over 100k)
Earned income credit: $1,698 (reported on 7.8% of returns)
Here:
$1,698
State:
$2,024
Percentage of individuals using paid preparers for their 2004 taxes: 47.7%
Here:
48%
State:
57%
(% for various income ranges: 40.2% for AGIs below $10k, 46.9% for AGIs $10k-25k, 47.0% for AGIs $25k-50k, 47.5% for AGIs $50k-75k, 43.9% for AGIs $75k-100k, 55.5% for AGIs over 100k)
Likely homosexual households (counted as self-reported same-sex unmarried-partner households)
Lesbian couples: 0.2% of all households
Gay men: 0.1% of all households
Household received Food Stamps/SNAP in the past 12 months: 507 Household did not receive Food Stamps/SNAP in the past 12 months: 15,224
Women who had a birth in the past 12 months: 526 (513 now married, 21 unmarried) Women who did not have a birth in the past 12 months: 9,935 (5,727 now married, 4,165 unmarried)
Housing units in zip code 76262 with a mortgage: 8,781 (419 second mortgage, 38 home equity loan, 323 both second mortgage and home equity loan) Houses without a mortgage: 219
Median monthly owner costs for units with a mortgage: $2,883 Median monthly owner costs for units without a mortgage: $1,249
Residents with income below the poverty level in 2022:
This zip code:
4.4%
Whole state:
14.0%
Residents with income below 50% of the poverty level in 2022:
This zip code:
1.3%
Whole state:
7.4%
Median number of rooms in houses and condos:
Here:
8.0
State:
6.3
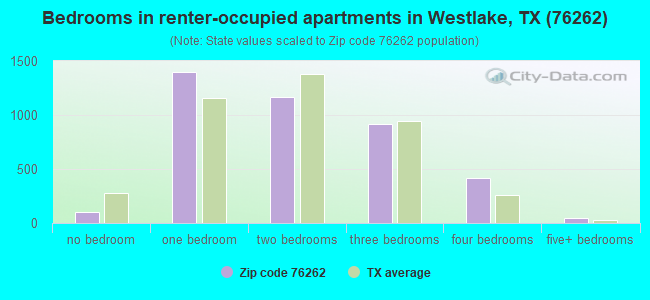
Median number of rooms in apartments:
Here:
3.9
State:
4.0
Notable locations in this zip code not listed on our city pages
Notable locations in zip code 76262: Roanoke Fire Department (A), Trophy Club Fire and Rescue (B), Westlake Department of Public Safety (C), Old Continental State Bank (D). Display/hide their locations on the map
Churches in zip code 76262 include: First Baptist Church of Roanoke (A), Tabernacle Baptist Church (B), First Baptist Church of Trophy Club (C). Display/hide their locations on the map
Streams, rivers, and creeks: Whites Branch (A), Elizabeth Creek (B), Graham Branch (C), Henrietta Creek (D), Higgins Branch (E), Cleveland Branch (F), Catherine Branch (G), Cade Branch (H), Buffalo Creek (I). Display/hide their locations on the map
In group quarters: 24 (-1 institutionalized population)
Size of family households: 4,202 2-persons, 2,632 3-persons, 3,078 4-persons, 1,198 5-persons, 504 6-persons, 152 7-or-more-persons
Size of nonfamily households: 3,523 1-person, 403 2-persons, 18 4-persons
10,005 married couples with children.
1,063 single-parent households (228 men, 835 women).
83.9% of residents of 76262 zip code speak English at home.
7.6% of residents speak Spanish at home (83% very well, 10% well, 7% not well).
4.6% of residents speak other Indo-European language at home (82% very well, 14% well, 4% not at all).
3.3% of residents speak Asian or Pacific Island language at home (75% very well, 16% well, 9% not well).
0.8% of residents speak other language at home (54% very well, 45% well, 1% not well).
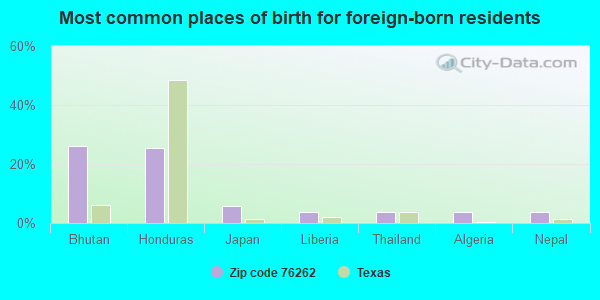
Foreign born population: 4,804 (11.1%) (57.4% of them are naturalized citizens)
This zip code:
11.1%
Whole state:
17.2%
26%Bhutan
25%Honduras
6%Japan
4%Liberia
4%Thailand
4%Algeria
4%Nepal
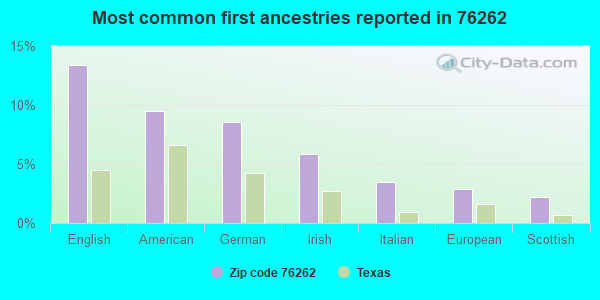
13%English
9%American
9%German
6%Irish
4%Italian
3%European
2%Scottish
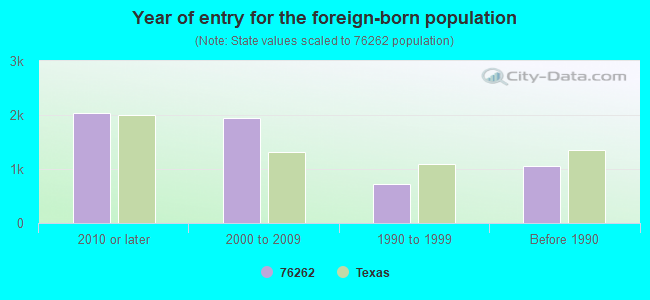
Year of entry for the foreign-born population
2,0352010 or later
1,9512000 to 2009
7171990 to 1999
1,047Before 1990
Facilities with environmental interests located in this zip code:
AMERICAN TELEPHONE AND TELEGRAPH COMPANY (4.9 MI NW RR L436430 in ROANOKE, TX)
(Resource Conservation and Recovery Act (tracking hazardous waste)) Alternative names: AMERICAN TEL & TEL CO LONG LINES
AVIATION UTIITIES WWTF (2500F W NW REGIONAL AIRPORT in ROANOKE, TX)
National Pollutant Discharge Elimination System NON-MAJOR (Tracking pollutant discharge elimination systems) - permit Business SIC classification: SEWERAGE SYSTEMS Organizations: AVIATION UTILITIES SERVICES IN (CONTACT/OWNER)
Alternative names: AVIATION UTILITIES SERVICES
Housing units lacking complete plumbing facilities: 0.6% Housing units lacking complete kitchen facilities: 0.3%
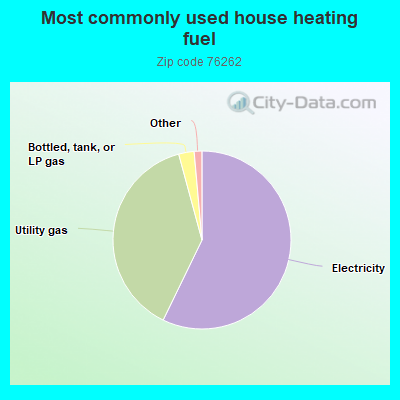
57.2%Electricity
38.6%Utility gas
2.8%Bottled, tank, or LP gas
0.6%Solar energy
0.5%No fuel used
Population in 1990: 11,484. Population change in the 1990s: +3,991 (+34.8%).
Place of birth for U.S.-born residents:
This state: 20,283
Northeast: 2,681
Midwest: 5,428
South: 4,896
West: 4,409
45% of the 76262 zip code residents lived in the same house 5 years ago. Out of people who lived in different houses, 32% lived in this county. Out of people who lived in different counties, 50% lived in Texas.
88% of the 76262 zip code residents lived in the same house 1 year ago. Out of people who lived in different houses, 31% moved from this county. Out of people who lived in different houses, 44% moved from different county within same state. Out of people who lived in different houses, 24% moved from different state. Out of people who lived in different houses, 4% moved from abroad.
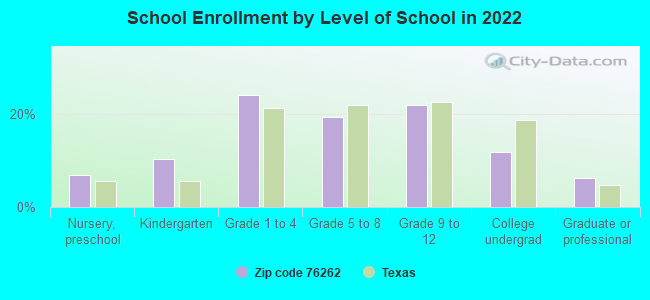
Private vs. public school enrollment:
Students in private schools in grades 1 to 8 (elementary and middle school): 739
Here:
14.0%
Texas:
8.8%
Students in private schools in grades 9 to 12 (high school): 351
Here:
13.2%
Texas:
8.0%
Students in private undergraduate colleges: 296
Here:
20.7%
Texas:
16.2%
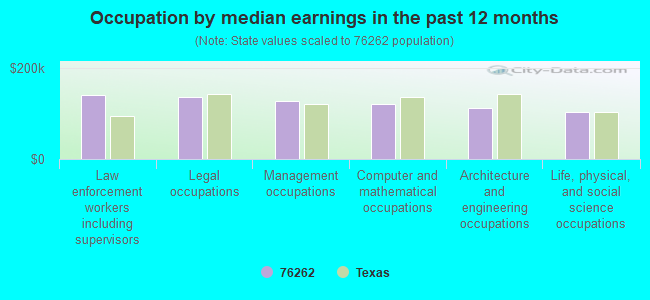
Occupation by median earnings in the past 12 months ($)
140,946Law enforcement workers including supervisors
136,609Legal occupations
126,439Management occupations
119,389Computer and mathematical occupations
110,977Architecture and engineering occupations
103,392Life, physical, and social science occupations
Companies with federal contracts located in this zip code:
SUNMOUNT CORPORATION (344 HARMONSON ROAD in ROANOKE, TX) : $34,745,324 in 66 contractsfrom 2002 to 2006
Contracts for Maintenance, Repair or Alteration of Real Property -- Airport Runways, Construction of Structures and Facilities -- Airport Runways by Army Signed by year:2000: $0; 2001: $0; 2002: $17,937,975; 2003: $811,277; 2004: $14,959,635; 2005: $993,907; 2006: $42,530.
Biggest contracts:
$16,132,825 with Army for Maintenance, Repair or Alteration of Real Property -- Airport Runways. Taking place in OK. Signed on 2002-08-30. Completion date: 2003-11-30.
$14,900,910 with Army for Construction of Structures and Facilities -- Airport Runways. Taking place in FL. Signed on 2004-09-29. Completion date: 2005-08-03.
$1,805,150 with Army for Maintenance, Repair or Alteration of Real Property -- Airport Runways. Taking place in OK. Signed on 2002-11-26. Completion date: 2003-11-30.
$240,000, same as above.Signed on 2003-03-31. Completion date: 2003-11-30.
RENDA MARINE, INC (522 BENSON LANE in ROANOKE, TX) : $16,324,448 in 41 contractsfrom 1999 to 2005
Contracts for Construction of Structures and Facilities -- Dredging, Maintenance, Repair or Alteration of Real Property -- Dredging by U.S. Army Corps of Engineers - civil program financing only, Army Signed by year:2000: $2,745,187; 2001: $6,233,073; 2002: $6,827,957; 2003: -$431,267; 2004: $417,070; 2005: -$432; 2006: $0.
Biggest contracts:
$3,083,833 with U.S. Army Corps of Engineers - civil program financing only for Construction of Structures and Facilities -- Dredging. Signed on 2001-03-23. Completion date: 2001-12-31.
$1,530,000, same as above.Signed on 2000-03-22. Completion date: 2000-09-29.
$1,500,000 with U.S. Army Corps of Engineers - civil program financing only for Maintenance, Repair or Alteration of Real Property -- Dredging. Taking place in AL. Signed on 2002-06-12. Completion date: 2002-10-25.
$1,000,000 with U.S. Army Corps of Engineers - civil program financing only for Construction of Structures and Facilities -- Dredging. Signed on 2001-01-02. Completion date: 2001-12-31.
D & L COMPONENTS, INC (123A MARSHALL CREEK ROAD in ROANOKE, TX; small business) : $582,403 in 13 contractsfrom 2000 to 2003
Contracts for Antennas, Waveguides, and Related Equipment, Valves, Nonpowered, Electrical and Electronic assemblies, Boards, Cards, and Associated Hardware, Switches, and moreby Defense Logistics Agency Signed by year:2000: $26,446; 2001: $0; 2002: $378,565; 2003: $177,392; 2004: $0; 2005: $0; 2006: $0.
Biggest contracts:
$93,180 with Defense Logistics Agency for Antennas, Waveguides, and Related Equipment. Signed on 2003-10-27. Completion date: 2004-04-30.
$71,895 with Defense Logistics Agency for Valves, Nonpowered. Signed on 2002-07-11. Completion date: 2002-10-03.
$68,947, same as above.Signed on 2002-03-05. Completion date: 2002-05-29.
$58,857 with Defense Logistics Agency for Electrical and Electronic assemblies, Boards, Cards, and Associated Hardware. Signed on 2002-04-10. Completion date: 2002-06-19.
POLYCONSTRUCTORS, INC (2200 FAWKES LANE in ROANOKE, TX; small business) : $235,738 in 4 contractsfrom 2003 to 2005
$115,434 with Air Force for Maintenance, Repair and Rebuilding of Equipment -- Miscellaneous. Taking place in OK. Signed on 2003-09-26. Completion date: 2003-11-10.
$83,000 with Air Force for Maintenance, Repair or Alteration of Real Property -- Maintenance Buildings. Taking place in OK. Signed on 2003-09-29. Completion date: 2003-10-30.
$29,461 with Air Force for Maintenance, Repair and Rebuilding of Equipment -- Miscellaneous. Taking place in OK. Signed on 2005-03-10. Completion date: 2005-04-30.
$7,843, same as above.Signed on 2005-06-22. Completion date: 2005-06-30.
AVIATECH CORP (104 LINDBERGH DR in ROANOKE, TX) : $175,770 in 2 contractsin 2006
$113,050 with Defense Logistics Agency for Antennas, Waveguides, and Related Equipment. Signed on 2006-06-20. Completion date: 2007-03-15.
$62,720, same as above.Signed on 2006-06-19. Completion date: 2006-11-06.
CELLCO PARTNERSHIP (6 CAMPUS CIRCLE in WESTLAKE, TX)
$33,000 with Air Force for Other ADP and Telecommunications Services (includes data storage on tapes, compact disks, etc.). Signed on 2001-09-25. Completion date: 2001-09-25.
ADVANCED ENTRY, LLC (2016 VISTA LN in ROANOKE, TX; small business) : $24,863 in 4 contractsfrom 2003 to 2006
$13,373 with Army for Electrical Control Equipment. Signed on 2005-08-30. Completion date: 2005-10-17.
$5,083 with Army for Miscellaneous Alarm, Signal and Security Detection Systems. Signed on 2004-11-23. Completion date: 2004-12-03.
$3,257 with Army for Communications Security Equipment and Components. Signed on 2003-06-13. Completion date: 2003-06-30.
$3,150 with Army for Miscellaneous Alarm, Signal and Security Detection Systems. Signed on 2006-04-03. Completion date: 2006-03-24.
MARKETING CONNECTIONS INC (17 TIMBERLINE DRIVE in ROANOKE, TX; small business) : $20,809 in 3 contractsfrom 2003 to 2005
$14,998 with Army for Miscellaneous Items. Signed on 2004-08-30. Completion date: 2004-10-01.
$5,699 with Army for Signs, Advertising Displays, and Identification Plates. Signed on 2003-05-14. Completion date: 2003-07-23.
$112 with Army for Miscellaneous Items. Signed on 2005-02-17. Completion date: 2004-10-01.
BOEDEKER, BARBARA LYNN (1118 TROPHY CLUB DR in ROANOKE, TX; small business)
$11,825 with Army for Ophthalmic Instruments, Equipment, and Supplies. Signed on 2004-09-20. Completion date: 2004-10-20.
EDWARD PETIT (1624 BELLECHASE DR in ROANOKE, TX; small business)
$6,740 with Army for Medical and Surgical Instruments, Equipment, and Supplies. Signed on 2005-09-22. Completion date: 2005-10-15.
Top industries in this zip code by the number of employees in 2005:
Management of Companies and Enterprises: Corporate, Subsidiary, and Regional Managing Offices (over 1000 employees: 1 establishment, 100-249 employees: 2 establishments, 1-4 employees: 5 establishments)
2002 - 2018 National Fire Incident Reporting System (NFIRS) incidents
Based on the data from the years 2002 - 2018 the average number of fires per year is 100. The highest number of reported fires - 145 took place in 2006, and the least - 19 in 2002. The data has an increasing trend.
When looking into fire subcategories, the most reports belonged to: Structure Fires (39.8%), and Outside Fires (38.9%).
Fire incident types reported to NFIRS in Zip Code 76262


 Nearest zip codes: 76248, 76177, 76092, 76244, 75022, 76226.
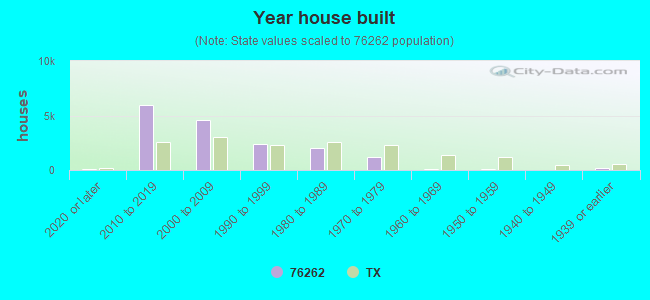


 Based on the data from the years 2002 - 2018 the average number of fires per year is 100. The highest number of reported fires - 145 took place in 2006, and the least - 19 in 2002. The data has an increasing trend.
 When looking into fire subcategories, the most reports belonged to: Structure Fires (39.8%), and Outside Fires (38.9%).