Estimated zip code population in 2022: 3,726 Zip code population in 2010: 4,162 Zip code population in 2000: 4,347
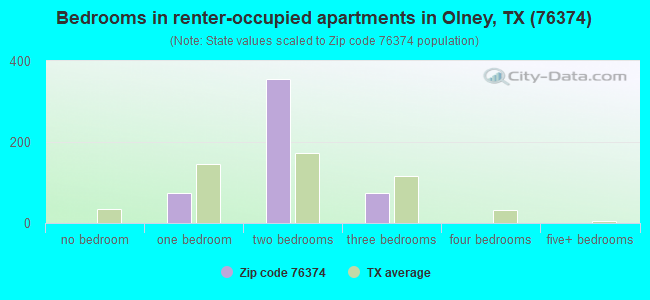
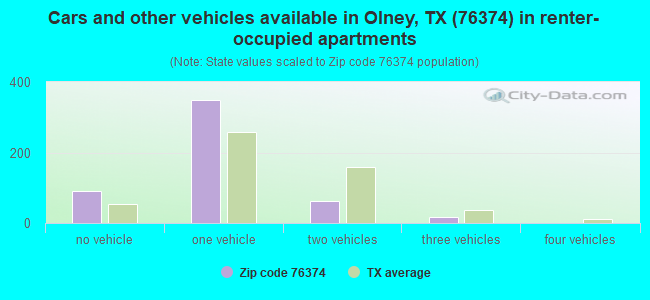
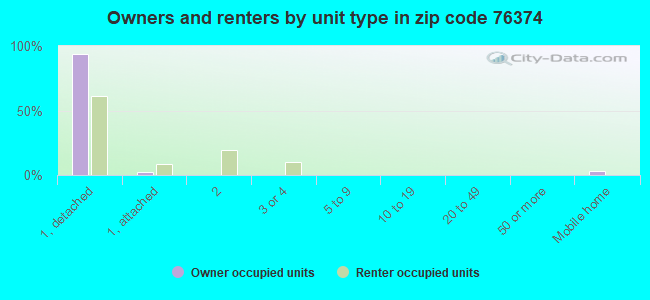
Houses and condos: 2,075 Renter-occupied apartments: 513
% of renters here:
28%
State:
38%
March 2022 cost of living index in zip code 76374: 75.9 (low, U.S. average is 100)
Land area: 282.2 sq. mi. Water area: 3.0 sq. mi.
Population density: 13 people per square mile
(very low).
OSM Map
General Map
Google Map
MSN Map
OSM Map
General Map
Google Map
MSN Map
OSM Map
General Map
Google Map
MSN Map
OSM Map
General Map
Google Map
MSN Map
Please wait while loading the map...
Real estate property taxes paid for housing units in 2022:
This zip code:
1.1% ($1,164)
Texas:
1.5% ($4,050)
Median real estate property taxes paid for housing units with mortgages in 2022: $2,087 (1.9%) Median real estate property taxes paid for housing units with no mortgage in 2022: $1,013 (1.0%)
Business Search- 14 Million verified businesses
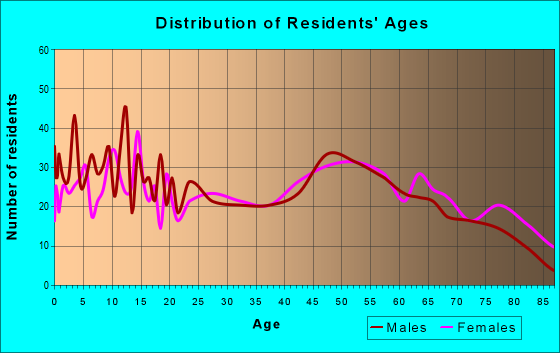
Males: 1,961
(52.6%)
Females: 1,764
(47.4%)
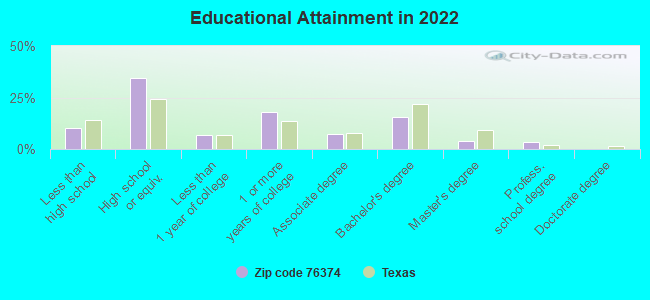
For population 25 years and over in 76374:
High school or higher: 89.1%
Bachelor's degree or higher: 23.1%
Graduate or professional degree: 7.5%
Unemployed: 5.7%
Mean travel time to work (commute): 11.7 minutes
For population 15 years and over in 76374:
Never married: 24.1%
Now married: 52.0%
Separated: 1.2%
Widowed: 12.0%
Divorced: 10.8%
Zip code 76374 compared to state average:
Median household income below state average.
Median house value significantly below state average.
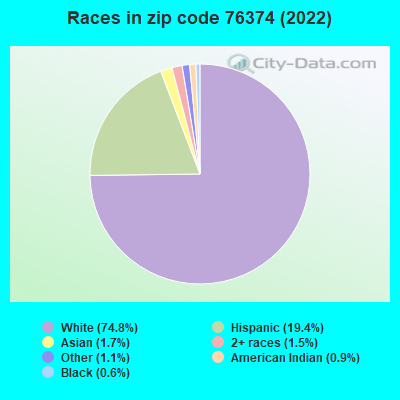
Black race population percentage significantly below state average.
Hispanic race population percentage below state average.
Median age above state average.
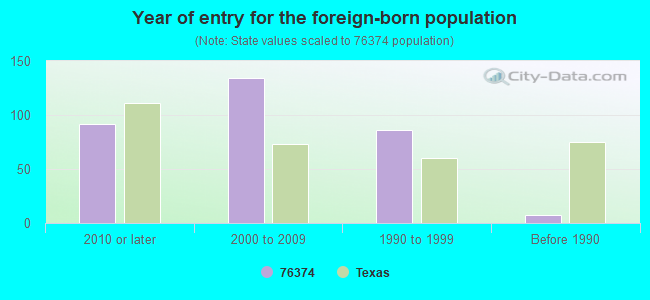
Foreign-born population percentage below state average.
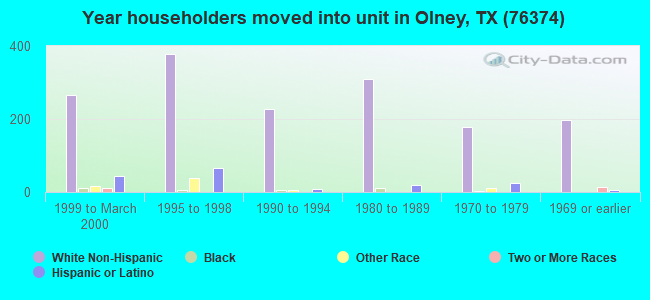
Length of stay since moving in significantly above state average.
Averages for the 2020 tax year for zip code 76374, filed in 2021:
Average Adjusted Gross Income (AGI) in 2020: $60,728 (Individual Income Tax Returns)
Here:
$60,728
State:
$77,054
Salary/wage: $48,799 (reported on 83.0% of returns)
Here:
$48,799
State:
$62,766
(% of AGI for various income ranges: 1196.0% for AGIs below $25k, 3688.6% for AGIs $25k-50k, 6518.1% for AGIs $50k-75k, 9629.1% for AGIs $75k-100k, 15344.2% for AGIs $100k-200k)
Taxable interest for individuals: $1,846 (reported on 24.8% of returns)
This zip code:
$1,846
Texas:
$2,665
(% of AGI for various income ranges: 14.0% for AGIs below $25k, 26.1% for AGIs $25k-50k, 31.2% for AGIs $50k-75k, 93.6% for AGIs $75k-100k, 296.7% for AGIs $100k-200k)
Ordinary dividends: $4,035 (reported on 15.8% of returns)
Here:
$4,035
State:
$10,044
(% of AGI for various income ranges: 10.4% for AGIs below $25k, 28.9% for AGIs $25k-50k, 70.6% for AGIs $50k-75k, 51.8% for AGIs $75k-100k, 197.5% for AGIs $100k-200k)
Net capital gain/loss in AGI: +$19,489 (reported on 11.5% of returns)
Here:
+$19,489
State:
+$39,590
(% of AGI for various income ranges: 11.3% for AGIs below $25k, 25.6% for AGIs $25k-50k, 115.0% for AGIs $50k-75k, 156.4% for AGIs $75k-100k, 236.7% for AGIs $100k-200k)
Profit/loss from business: +$8,853 (reported on 18.2% of returns)
Here:
+$8,853
State:
+$10,888
(% of AGI for various income ranges: 121.3% for AGIs below $25k, 73.3% for AGIs $25k-50k, 180.0% for AGIs $50k-75k, 233.6% for AGIs $75k-100k, 1084.2% for AGIs $100k-200k)
Taxable individual retirement arrangement distribution: $15,857 (reported on 8.5% of returns)
76374:
$15,857
Texas:
$24,740
(% of AGI for various income ranges: 41.8% for AGIs below $25k, 221.4% for AGIs $25k-50k, 280.0% for AGIs $75k-100k, 772.5% for AGIs $100k-200k)
Total itemized deductions: $42,033 (reported on 3.6% of returns)
Here:
$42,033
State:
$40,428
(% of AGI for various income ranges: 265.8% for AGIs $25k-50k, 1304.2% for AGIs $100k-200k)
Charity contributions: $22,250 (reported on 2.4% of returns)
Here:
$22,250
State:
$18,201
(% of AGI for various income ranges: 29.1% for AGIs below $25k, 632.5% for AGIs $100k-200k)
Taxes paid: $4,367 (reported on 3.6% of returns)
76374:
$4,367
State:
$7,821
(% of AGI for various income ranges: 26.1% for AGIs $25k-50k, 140.0% for AGIs $100k-200k)
Earned income credit: $2,683 (reported on 21.2% of returns)
Here:
$2,683
State:
$2,584
(% of AGI for various income ranges: 146.9% for AGIs below $25k, 77.2% for AGIs $25k-50k)
Percentage of individuals using paid preparers for their 2020 taxes: 89.1%
Here:
89%
State:
92%
(% for various income ranges: 88.1% for AGIs below $25k, 89.1% for AGIs $25k-50k, 90.9% for AGIs $50k-75k, 87.5% for AGIs $75k-100k, 88.9% for AGIs $100k-200k, 100.0% for AGIs over 200k)
Averages for the 2012 tax year for zip code 76374, filed in 2013:
Average Adjusted Gross Income (AGI) in 2012: $52,498 (Individual Income Tax Returns)
Here:
$52,498
State:
$65,384
Salary/wage: $40,526 (reported on 86.0% of returns)
Here:
$40,526
State:
$52,524
(% of AGI for various income ranges: 79.4% for AGIs below $25k, 81.4% for AGIs $25k-50k, 82.2% for AGIs $50k-75k, 79.9% for AGIs $75k-100k, 59.5% for AGIs $100k-200k, 32.7% for AGIs over 200k)
Taxable interest for individuals: $2,314 (reported on 26.2% of returns)
This zip code:
$2,314
Texas:
$2,372
(% of AGI for various income ranges: 1.2% for AGIs below $25k, 0.7% for AGIs $25k-50k, 0.5% for AGIs $50k-75k, 1.0% for AGIs $75k-100k, 0.9% for AGIs $100k-200k, 2.3% for AGIs over 200k)
Ordinary dividends: $3,448 (reported on 16.5% of returns)
Here:
$3,448
State:
$9,721
(% of AGI for various income ranges: 1.3% for AGIs below $25k, 0.3% for AGIs $25k-50k, 0.5% for AGIs $50k-75k, 0.6% for AGIs $75k-100k, 1.3% for AGIs $100k-200k, 2.2% for AGIs over 200k)
Net capital gain/loss in AGI: +$5,100 (reported on 12.2% of returns)
Here:
+$5,100
State:
+$35,319
(% of AGI for various income ranges: 0.9% for AGIs $75k-100k, 2.3% for AGIs $100k-200k, 2.9% for AGIs over 200k)
Profit/loss from business: +$16,844 (reported on 20.7% of returns)
Here:
+$16,844
State:
+$13,732
(% of AGI for various income ranges: 9.0% for AGIs below $25k, 3.7% for AGIs $25k-50k, 3.7% for AGIs $50k-75k, 4.3% for AGIs $75k-100k, 9.2% for AGIs $100k-200k, 9.6% for AGIs over 200k)
Taxable individual retirement arrangement distribution: $10,600 (reported on 8.5% of returns)
76374:
$10,600
Texas:
$19,511
(% of AGI for various income ranges: 2.6% for AGIs below $25k, 1.7% for AGIs $25k-50k, 3.8% for AGIs $50k-75k, 2.9% for AGIs $100k-200k)
Total itemized deductions: $27,600 (19% of AGI, reported on 12.8% of returns)
Here:
$27,600
State:
$24,724
Here:
19.2% of AGI
State:
15.9% of AGI
(% of AGI for various income ranges: 4.3% for AGIs below $25k, 3.5% for AGIs $25k-50k, 4.2% for AGIs $50k-75k, 6.1% for AGIs $75k-100k, 8.7% for AGIs $100k-200k, 11.1% for AGIs over 200k)
Charity contributions: $11,250 (reported on 9.8% of returns)
Here:
$11,250
State:
$6,808
(% of AGI for various income ranges: 0.9% for AGIs $25k-50k, 0.7% for AGIs $50k-75k, 1.2% for AGIs $75k-100k, 2.2% for AGIs $100k-200k, 5.6% for AGIs over 200k)
Taxes paid: $3,958 (reported on 11.6% of returns)
76374:
$3,958
State:
$6,921
(% of AGI for various income ranges: 0.4% for AGIs below $25k, 0.5% for AGIs $25k-50k, 0.6% for AGIs $50k-75k, 1.0% for AGIs $75k-100k, 1.6% for AGIs $100k-200k, 1.0% for AGIs over 200k)
Earned income credit: $2,347 (reported on 22.0% of returns)
Here:
$2,347
State:
$2,570
(% of AGI for various income ranges: 7.7% for AGIs below $25k, 1.2% for AGIs $25k-50k)
Percentage of individuals using paid preparers for their 2012 taxes: 58.5%
Here:
59%
State:
51%
(% for various income ranges: 53.0% for AGIs below $25k, 61.4% for AGIs $25k-50k, 54.5% for AGIs $50k-75k, 60.0% for AGIs $75k-100k, 76.9% for AGIs $100k-200k, 75.0% for AGIs over 200k)
Averages for the 2004 tax year for zip code 76374, filed in 2005:
Average Adjusted Gross Income (AGI) in 2004: $31,643 (Individual Income Tax Returns)
Here:
$31,643
State:
$47,881
Salary/wage: $28,192 (reported on 81.7% of returns)
Here:
$28,192
State:
$41,947
(% of AGI for various income ranges: 196.1% for AGIs below $10k, 77.0% for AGIs $10k-25k, 82.0% for AGIs $25k-50k, 74.6% for AGIs $50k-75k, 76.2% for AGIs $75k-100k, 43.5% for AGIs over 100k)
Taxable interest for individuals: $2,489 (reported on 33.4% of returns)
This zip code:
$2,489
Texas:
$2,255
(% of AGI for various income ranges: 14.4% for AGIs below $10k, 3.3% for AGIs $10k-25k, 1.5% for AGIs $25k-50k, 1.4% for AGIs $50k-75k, 2.4% for AGIs $75k-100k, 3.9% for AGIs over 100k)
Taxable dividends: $2,707 (reported on 13.2% of returns)
Here:
$2,707
State:
$4,261
(% of AGI for various income ranges: 2.8% for AGIs below $10k, 1.1% for AGIs $10k-25k, 0.4% for AGIs $25k-50k, 0.2% for AGIs $50k-75k, 1.5% for AGIs $75k-100k, 2.6% for AGIs over 100k)
Net capital gain/loss: +$3,286 (reported on 14.4% of returns)
Here:
+$3,286
State:
+$16,110
(% of AGI for various income ranges: -1.2% for AGIs below $10k, 0.1% for AGIs $10k-25k, 0.4% for AGIs $25k-50k, 1.4% for AGIs $50k-75k, 0.6% for AGIs $75k-100k, 4.7% for AGIs over 100k)
Profit/loss from business: +$9,747 (reported on 21.5% of returns)
Here:
+$9,747
State:
+$11,013
(% of AGI for various income ranges: 6.3% for AGIs below $10k, 6.1% for AGIs $10k-25k, 4.4% for AGIs $25k-50k, 6.0% for AGIs $50k-75k, 4.1% for AGIs $75k-100k, 12.1% for AGIs over 100k)
IRA payment deduction: $3,314 (reported on 2.1% of returns)
76374:
$3,314
Texas:
$3,120
Total itemized deductions: $17,532 (25% of AGI, reported on 11.0% of returns)
Here:
$17,532
State:
$19,631
Here:
24.7% of AGI
State:
18.9% of AGI
(% of AGI for various income ranges: 22.2% for AGIs below $10k, 3.6% for AGIs $10k-25k, 5.5% for AGIs $25k-50k, 6.3% for AGIs $50k-75k, 5.2% for AGIs $75k-100k, 7.4% for AGIs over 100k)
Charity contributions deductions: $5,087 (8% of AGI, reported on 9.4% of returns)
Here:
$5,087
State:
$4,753
Here:
7.6% of AGI
State:
4.2% of AGI
(% of AGI for various income ranges: 2.6% for AGIs below $10k, 1.0% for AGIs $10k-25k, 0.9% for AGIs $25k-50k, 1.5% for AGIs $50k-75k, 1.6% for AGIs $75k-100k, 2.5% for AGIs over 100k)
Total tax: $5,161 (reported on 65.2% of returns)
76374:
$5,161
State:
$9,058
(% of AGI for various income ranges: 5.6% for AGIs below $10k, 4.1% for AGIs $10k-25k, 6.2% for AGIs $25k-50k, 9.3% for AGIs $50k-75k, 11.5% for AGIs $75k-100k, 22.1% for AGIs over 100k)
Earned income credit: $1,707 (reported on 24.4% of returns)
Here:
$1,707
State:
$2,024
Percentage of individuals using paid preparers for their 2004 taxes: 68.4%
Here:
68%
State:
57%
(% for various income ranges: 63.8% for AGIs below $10k, 71.3% for AGIs $10k-25k, 66.7% for AGIs $25k-50k, 74.2% for AGIs $50k-75k, 65.5% for AGIs $75k-100k, 79.7% for AGIs over 100k)
Household received Food Stamps/SNAP in the past 12 months: 387 Household did not receive Food Stamps/SNAP in the past 12 months: 1,431
Women who had a birth in the past 12 months: 126 (34 now married, 88 unmarried) Women who did not have a birth in the past 12 months: 670 (357 now married, 310 unmarried)
Housing units in zip code 76374 with a mortgage: 326 (42 second mortgage, 36 home equity loan, 3 both second mortgage and home equity loan) Houses without a mortgage: 13
Median monthly owner costs for units with a mortgage: $960 Median monthly owner costs for units without a mortgage: $429
Residents with income below the poverty level in 2022:
This zip code:
21.2%
Whole state:
14.0%
Residents with income below 50% of the poverty level in 2022:
This zip code:
4.3%
Whole state:
7.4%
Median number of rooms in houses and condos:
Here:
6.5
State:
6.3
Median number of rooms in apartments:
Here:
4.6
State:
4.0
Notable locations in this zip code not listed on our city pages
Churches in zip code 76374 include: Pleasant Valley Church (A), Church of God (B), Church of Christ (C), Immanuel Baptist Church (D), Olney Assembly Church (E), Cumberland Presbyterian Church (F), Saint Luke Lutheran Church (G), Saint Luke Church (H). Display/hide their locations on the map
Reservoirs: Clayton Lake (A), Powell Lake (B), Conner Lake (C), Thief Lakes (D), Lake Olney (E), Calvin Lake (F), Lake Cooper Reservoir (G), Megargel Creek Reservoir (H). Display/hide their locations on the map
Streams, rivers, and creeks: Bitter Creek (A), Bear Creek (B), Willow Pond Creek (C), White Water (D), Red Haw Creek (E), Camp Creek (F), Mud Creek (G), Dry Creek (H), Curtis Creek (I). Display/hide their locations on the map
In group quarters: 71 (-1 institutionalized population)
Size of family households: 611 2-persons, 181 3-persons, 131 4-persons, 101 5-persons, 21 6-persons
Size of nonfamily households: 730 1-person, 44 2-persons
326 married couples with children.
386 single-parent households (91 men, 295 women).
85.6% of residents of 76374 zip code speak English at home.
10.5% of residents speak Spanish at home (45% very well, 44% well, 11% not well).
0.9% of residents speak other Indo-European language at home (100% very well).
3.2% of residents speak Asian or Pacific Island language at home (72% very well, 28% well).
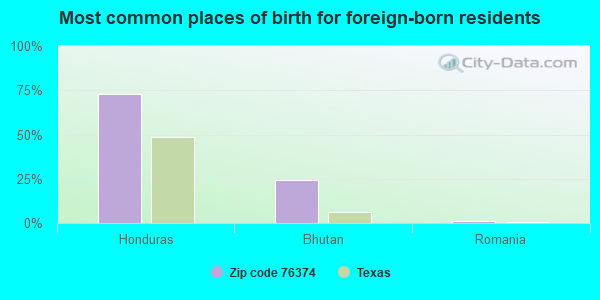
Foreign born population: 273 (7.3%) (12.1% of them are naturalized citizens)
This zip code:
7.3%
Whole state:
17.2%
73%Honduras
24%Bhutan
1%Romania
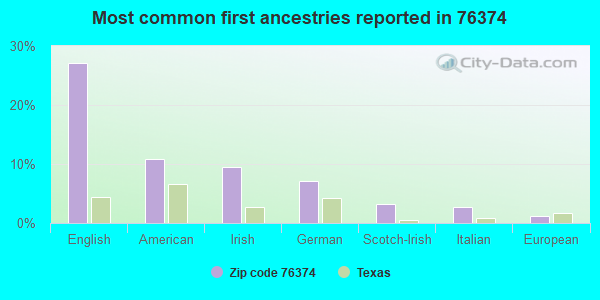
27%English
11%American
10%Irish
7%German
3%Scotch-Irish
3%Italian
1%European
Year of entry for the foreign-born population
922010 or later
1342000 to 2009
861990 to 1999
7Before 1990
Facilities with environmental interests located in this zip code:
AIR TRACTOR INC (1584 AIRPORT RD. in OLNEY, TX)
CRITERIA AND HAZARDOUS AIR POLLUTANT INVENTORY (Inventory of air pollution sources) Conditionally Exempt Small Quantity Generators, less than 100 kg/month of hazardous waste (Resource Conservation and Recovery Act (tracking hazardous waste)) HAZARDOUS WASTE BIENNIAL REPORTER (Resource Conservation and Recovery Act (tracking hazardous waste)) TRI REPORTER (Tracking of toxic chemicals releasing facilities) Business SIC and NAICS classification: AIRCRAFT Alternative names: AIR TRACTOR INC.
Housing units lacking complete plumbing facilities: 8.2% Housing units lacking complete kitchen facilities: 3.2%
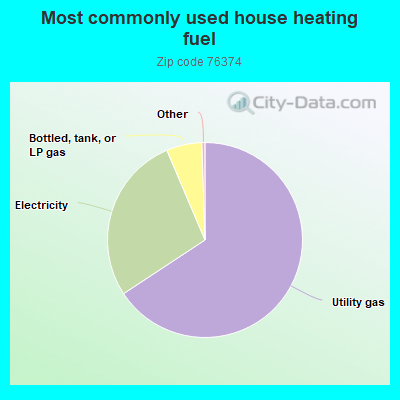
65.8%Utility gas
27.9%Electricity
5.9%Bottled, tank, or LP gas
Population in 1990: 4,554.
Place of birth for U.S.-born residents:
This state: 2,537
Northeast: 41
Midwest: 216
South: 323
West: 276
57% of the 76374 zip code residents lived in the same house 5 years ago. Out of people who lived in different houses, 49% lived in this county. Out of people who lived in different counties, 50% lived in Texas.
85% of the 76374 zip code residents lived in the same house 1 year ago. Out of people who lived in different houses, 55% moved from this county. Out of people who lived in different houses, 39% moved from different county within same state. Out of people who lived in different houses, 4% moved from different state.
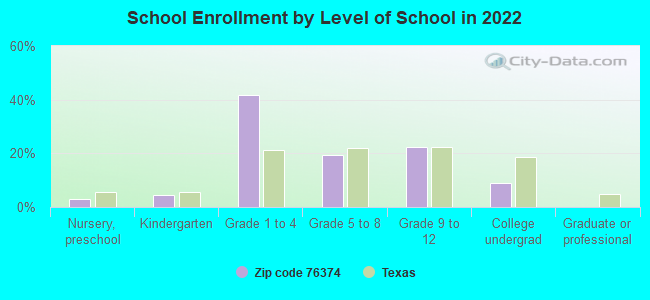
Private vs. public school enrollment:
Students in private schools in grades 1 to 8 (elementary and middle school): 69
Here:
16.1%
Texas:
8.8%
Students in private schools in grades 9 to 12 (high school):
Here:
0.0%
Texas:
8.0%
Students in private undergraduate colleges: 34
Here:
53.4%
Texas:
16.2%
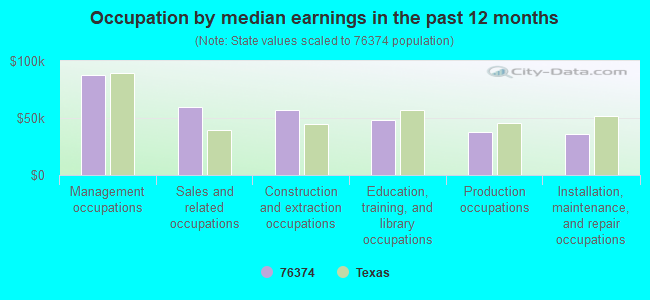
Occupation by median earnings in the past 12 months ($)
87,601Management occupations
59,817Sales and related occupations
57,422Construction and extraction occupations
48,579Education, training, and library occupations
38,152Production occupations
36,203Installation, maintenance, and repair occupations
Companies with federal contracts located in this zip code:
GILLOCK, PEARL (305 W GROVE in OLNEY, TX; small business) : $15,020 in 4 contractsfrom 2005 to 2006
$8,330 with Army for Recreation Site Maintenance Services (non-construction). Signed on 2006-03-29. Completion date: 2006-04-01.
$6,690, same as above.Signed on 2005-03-25. Completion date: 2005-09-30.
$6,690 with U.S. Army Corps of Engineers - civil program financing only for Recreation Site Maintenance Services (non-construction). Signed on 2005-03-25. Completion date: 2005-09-30.
-$6,690 with Army for Recreation Site Maintenance Services (non-construction). Signed on 2005-03-29. Completion date: 2005-09-30.
Top industries in this zip code by the number of employees in 2005:
Health Care and Social Assistance: General Medical and Surgical Hospitals (100-249 employees: 1 establishment)
62 people in nursing facilities/skilled-nursing facilities
People in group quarters in 2000:
111 people in nursing homes
Fatal accident statistics in 2013:
Fatal accident count: 1
Vehicles involved in fatal accidents: 2
Fatal accidents caused by drunken drivers: 0
Fatalities: 2
Persons involved in fatal accidents: 2
Pedestrians involved in fatal accidents: 0
Fatal accident statistics in 2012:
Fatal accident count: 1
Vehicles involved in fatal accidents: 1
Fatal accidents caused by drunken drivers: 0
Fatalities: 1
Persons involved in fatal accidents: 2
Pedestrians involved in fatal accidents: 0
2003 - 2013 National Fire Incident Reporting System (NFIRS) incidents
Based on the data from the years 2003 - 2013 the average number of fires per year is 43. The highest number of fire incidents - 114 took place in 2008, and the least - 0 in 2004. The data has a rising trend.
When looking into fire subcategories, the most reports belonged to: Outside Fires (79.0%), and Structure Fires (12.6%).
Fire incident types reported to NFIRS in Zip Code 76374


 Nearest zip codes: 76351, 76372, 76370, 76460, 76389, 76450.
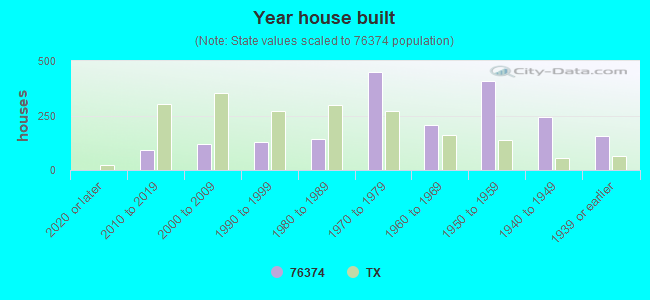


 Based on the data from the years 2003 - 2013 the average number of fires per year is 43. The highest number of fire incidents - 114 took place in 2008, and the least - 0 in 2004. The data has a rising trend.
 When looking into fire subcategories, the most reports belonged to: Outside Fires (79.0%), and Structure Fires (12.6%).