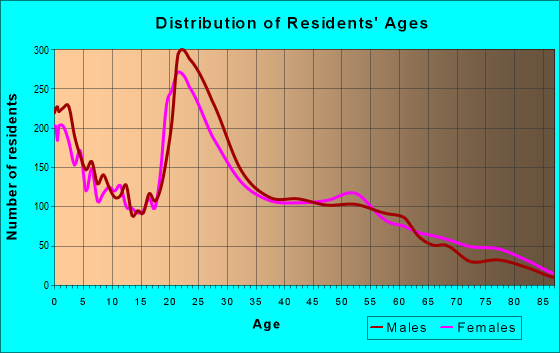
Estimated zip code population in 2022: 19,355 Zip code population in 2010: 19,206 Zip code population in 2000: 21,149
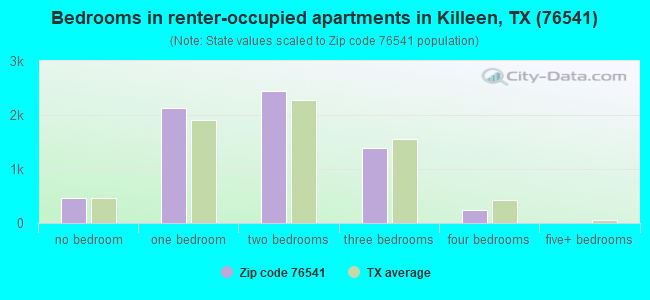
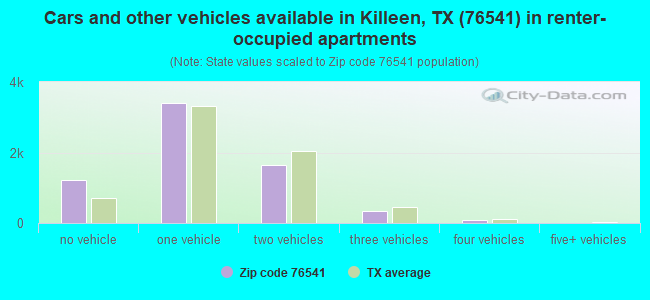
Houses and condos: 10,628 Renter-occupied apartments: 6,671
% of renters here:
76%
State:
38%
March 2022 cost of living index in zip code 76541: 83.7 (less than average, U.S. average is 100)
Land area: 4.7 sq. mi. Water area: 0.0 sq. mi.
Population density: 4,077 people per square mile
(average).
OSM Map
General Map
Google Map
MSN Map
OSM Map
General Map
Google Map
MSN Map
OSM Map
General Map
Google Map
MSN Map
OSM Map
General Map
Google Map
MSN Map
Please wait while loading the map...
Real estate property taxes paid for housing units in 2022:
This zip code:
1.3% ($1,312)
Texas:
1.5% ($4,050)
Median real estate property taxes paid for housing units with mortgages in 2022: $2,212 (1.8%) Median real estate property taxes paid for housing units with no mortgage in 2022: $1,035 (1.1%)
Averages for the 2020 tax year for zip code 76541, filed in 2021:
Average Adjusted Gross Income (AGI) in 2020: $29,782 (Individual Income Tax Returns)
Here:
$29,782
State:
$77,054
Salary/wage: $26,651 (reported on 84.3% of returns)
Here:
$26,651
State:
$62,766
(% of AGI for various income ranges: 1147.9% for AGIs below $25k, 3353.5% for AGIs $25k-50k, 6083.8% for AGIs $50k-75k, 8043.3% for AGIs $75k-100k, 16457.8% for AGIs $100k-200k)
Taxable interest for individuals: $838 (reported on 9.3% of returns)
This zip code:
$838
Texas:
$2,665
(% of AGI for various income ranges: 3.9% for AGIs below $25k, 9.9% for AGIs $25k-50k, 17.2% for AGIs $50k-75k, 40.6% for AGIs $75k-100k, 98.9% for AGIs $100k-200k)
Ordinary dividends: $2,219 (reported on 4.0% of returns)
Here:
$2,219
State:
$10,044
(% of AGI for various income ranges: 1.3% for AGIs below $25k, 4.7% for AGIs $25k-50k, 15.8% for AGIs $50k-75k, 39.4% for AGIs $75k-100k, 448.9% for AGIs $100k-200k)
Net capital gain/loss in AGI: +$8,359 (reported on 4.3% of returns)
Here:
+$8,359
State:
+$39,590
(% of AGI for various income ranges: 1.8% for AGIs below $25k, 10.4% for AGIs $25k-50k, 52.1% for AGIs $50k-75k, 108.3% for AGIs $75k-100k, 2303.3% for AGIs $100k-200k)
Profit/loss from business: +$7,011 (reported on 14.0% of returns)
Here:
+$7,011
State:
+$10,888
(% of AGI for various income ranges: 116.0% for AGIs below $25k, 76.5% for AGIs $25k-50k, 147.4% for AGIs $50k-75k, 314.4% for AGIs $75k-100k, 498.9% for AGIs $100k-200k)
Taxable individual retirement arrangement distribution: $9,313 (reported on 1.9% of returns)
76541:
$9,313
Texas:
$24,740
(% of AGI for various income ranges: 6.4% for AGIs below $25k, 11.3% for AGIs $25k-50k, 90.4% for AGIs $50k-75k, 471.1% for AGIs $100k-200k)
Total itemized deductions: $27,730 (reported on 1.3% of returns)
Here:
$27,730
State:
$40,428
(% of AGI for various income ranges: 44.3% for AGIs $25k-50k, 187.2% for AGIs $50k-75k, 882.2% for AGIs $100k-200k)
Charity contributions: $10,712 (reported on 1.0% of returns)
Here:
$10,712
State:
$18,201
(% of AGI for various income ranges: 8.8% for AGIs $25k-50k, 41.5% for AGIs $50k-75k, 488.9% for AGIs $100k-200k)
Taxes paid: $4,100 (reported on 1.3% of returns)
76541:
$4,100
State:
$7,821
(% of AGI for various income ranges: 4.3% for AGIs $25k-50k, 26.4% for AGIs $50k-75k, 192.2% for AGIs $100k-200k)
Earned income credit: $2,642 (reported on 36.1% of returns)
Here:
$2,642
State:
$2,584
(% of AGI for various income ranges: 146.1% for AGIs below $25k, 94.8% for AGIs $25k-50k, 2.8% for AGIs $50k-75k)
Percentage of individuals using paid preparers for their 2020 taxes: 94.4%
Here:
94%
State:
92%
(% for various income ranges: 94.4% for AGIs below $25k, 94.6% for AGIs $25k-50k, 94.1% for AGIs $50k-75k, 92.0% for AGIs $75k-100k, 106.2% for AGIs $100k-200k, 0.0% for AGIs over 200k)
Averages for the 2012 tax year for zip code 76541, filed in 2013:
Average Adjusted Gross Income (AGI) in 2012: $26,775 (Individual Income Tax Returns)
Here:
$26,775
State:
$65,384
Salary/wage: $24,209 (reported on 87.0% of returns)
Here:
$24,209
State:
$52,524
(% of AGI for various income ranges: 86.6% for AGIs below $25k, 84.6% for AGIs $25k-50k, 74.7% for AGIs $50k-75k, 66.8% for AGIs $75k-100k, 74.9% for AGIs $100k-200k)
Taxable interest for individuals: $761 (reported on 12.3% of returns)
This zip code:
$761
Texas:
$2,372
(% of AGI for various income ranges: 0.3% for AGIs below $25k, 0.3% for AGIs $25k-50k, 0.3% for AGIs $50k-75k, 0.6% for AGIs $75k-100k, 0.8% for AGIs $100k-200k, 0.1% for AGIs over 200k)
Ordinary dividends: $2,256 (reported on 5.3% of returns)
Here:
$2,256
State:
$9,721
(% of AGI for various income ranges: 0.4% for AGIs below $25k, 0.3% for AGIs $25k-50k, 0.3% for AGIs $50k-75k, 0.5% for AGIs $75k-100k, 1.7% for AGIs $100k-200k)
Net capital gain/loss in AGI: +$9,333 (reported on 3.5% of returns)
Here:
+$9,333
State:
+$35,319
(% of AGI for various income ranges: 0.2% for AGIs $25k-50k, 0.2% for AGIs $50k-75k, 0.2% for AGIs $75k-100k, 14.8% for AGIs $100k-200k)
Profit/loss from business: +$7,129 (reported on 10.5% of returns)
Here:
+$7,129
State:
+$13,732
(% of AGI for various income ranges: 6.0% for AGIs below $25k, 1.4% for AGIs $25k-50k, 1.8% for AGIs $50k-75k, 2.3% for AGIs $75k-100k)
Taxable individual retirement arrangement distribution: $8,458 (reported on 3.3% of returns)
76541:
$8,458
Texas:
$19,511
(% of AGI for various income ranges: 0.4% for AGIs below $25k, 0.6% for AGIs $25k-50k, 1.6% for AGIs $50k-75k, 1.3% for AGIs $75k-100k, 4.7% for AGIs $100k-200k)
Total itemized deductions: $17,614 (28% of AGI, reported on 6.3% of returns)
Here:
$17,614
State:
$24,724
Here:
27.7% of AGI
State:
15.9% of AGI
(% of AGI for various income ranges: 2.0% for AGIs below $25k, 3.6% for AGIs $25k-50k, 4.4% for AGIs $50k-75k, 6.9% for AGIs $75k-100k, 13.5% for AGIs $100k-200k)
Charity contributions: $6,036 (reported on 4.2% of returns)
Here:
$6,036
State:
$6,808
(% of AGI for various income ranges: 0.2% for AGIs below $25k, 0.7% for AGIs $25k-50k, 0.9% for AGIs $50k-75k, 2.2% for AGIs $75k-100k, 4.6% for AGIs $100k-200k)
Taxes paid: $3,465 (reported on 6.2% of returns)
76541:
$3,465
State:
$6,921
(% of AGI for various income ranges: 0.3% for AGIs below $25k, 0.6% for AGIs $25k-50k, 0.9% for AGIs $50k-75k, 1.5% for AGIs $75k-100k, 3.1% for AGIs $100k-200k)
Earned income credit: $2,565 (reported on 37.9% of returns)
Here:
$2,565
State:
$2,570
(% of AGI for various income ranges: 9.6% for AGIs below $25k, 2.0% for AGIs $25k-50k)
Percentage of individuals using paid preparers for their 2012 taxes: 51.1%
Here:
51%
State:
51%
(% for various income ranges: 50.4% for AGIs below $25k, 50.7% for AGIs $25k-50k, 54.5% for AGIs $50k-75k, 57.9% for AGIs $75k-100k, 50.0% for AGIs $100k-200k, 100.0% for AGIs over 200k)
Averages for the 2004 tax year for zip code 76541, filed in 2005:
Average Adjusted Gross Income (AGI) in 2004: $22,632 (Individual Income Tax Returns)
Here:
$22,632
State:
$47,881
Salary/wage: $20,468 (reported on 88.2% of returns)
Here:
$20,468
State:
$41,947
(% of AGI for various income ranges: 106.1% for AGIs below $10k, 88.3% for AGIs $10k-25k, 83.3% for AGIs $25k-50k, 71.2% for AGIs $50k-75k, 68.3% for AGIs $75k-100k, 48.9% for AGIs over 100k)
Taxable interest for individuals: $1,394 (reported on 17.7% of returns)
This zip code:
$1,394
Texas:
$2,255
(% of AGI for various income ranges: 1.5% for AGIs below $10k, 0.6% for AGIs $10k-25k, 0.9% for AGIs $25k-50k, 1.0% for AGIs $50k-75k, 2.4% for AGIs $75k-100k, 2.2% for AGIs over 100k)
Taxable dividends: $1,425 (reported on 7.0% of returns)
Here:
$1,425
State:
$4,261
(% of AGI for various income ranges: 0.3% for AGIs below $10k, 0.2% for AGIs $10k-25k, 0.3% for AGIs $25k-50k, 0.3% for AGIs $50k-75k, 0.6% for AGIs $75k-100k, 1.8% for AGIs over 100k)
Net capital gain/loss: +$7,009 (reported on 5.6% of returns)
Here:
+$7,009
State:
+$16,110
(% of AGI for various income ranges: -0.3% for AGIs below $10k, 0.1% for AGIs $10k-25k, 0.1% for AGIs $25k-50k, 1.2% for AGIs $50k-75k, 1.1% for AGIs $75k-100k, 13.7% for AGIs over 100k)
Profit/loss from business: +$8,266 (reported on 7.9% of returns)
Here:
+$8,266
State:
+$11,013
(% of AGI for various income ranges: 3.0% for AGIs below $10k, 2.8% for AGIs $10k-25k, 1.6% for AGIs $25k-50k, 1.8% for AGIs $50k-75k, 3.7% for AGIs $75k-100k, 7.9% for AGIs over 100k)
IRA payment deduction: $2,583 (reported on 1.1% of returns)
76541:
$2,583
Texas:
$3,120
(% of AGI for various income ranges: 0.1% for AGIs $10k-25k, 0.2% for AGIs $25k-50k, 0.1% for AGIs $50k-75k, 0.5% for AGIs $75k-100k)
Total itemized deductions: $16,320 (26% of AGI, reported on 6.4% of returns)
Here:
$16,320
State:
$19,631
Here:
26.0% of AGI
State:
18.9% of AGI
(% of AGI for various income ranges: 1.3% for AGIs below $10k, 2.4% for AGIs $10k-25k, 4.4% for AGIs $25k-50k, 6.7% for AGIs $50k-75k, 8.4% for AGIs $75k-100k, 8.4% for AGIs over 100k)
Charity contributions deductions: $5,592 (8% of AGI, reported on 5.3% of returns)
Here:
$5,592
State:
$4,753
Here:
8.3% of AGI
State:
4.2% of AGI
(% of AGI for various income ranges: 0.2% for AGIs below $10k, 0.4% for AGIs $10k-25k, 0.9% for AGIs $25k-50k, 1.4% for AGIs $50k-75k, 2.9% for AGIs $75k-100k, 4.7% for AGIs over 100k)
Total tax: $2,915 (reported on 54.5% of returns)
76541:
$2,915
State:
$9,058
(% of AGI for various income ranges: 1.2% for AGIs below $10k, 3.1% for AGIs $10k-25k, 6.1% for AGIs $25k-50k, 9.3% for AGIs $50k-75k, 11.8% for AGIs $75k-100k, 18.6% for AGIs over 100k)
Earned income credit: $1,942 (reported on 37.3% of returns)
Here:
$1,942
State:
$2,024
Percentage of individuals using paid preparers for their 2004 taxes: 70.3%
Here:
70%
State:
57%
(% for various income ranges: 70.7% for AGIs below $10k, 73.5% for AGIs $10k-25k, 65.9% for AGIs $25k-50k, 62.9% for AGIs $50k-75k, 65.2% for AGIs $75k-100k, 67.6% for AGIs over 100k)
Likely homosexual households (counted as self-reported same-sex unmarried-partner households)
Lesbian couples: 0.2% of all households
Gay men: 0.3% of all households
Household received Food Stamps/SNAP in the past 12 months: 2,602 Household did not receive Food Stamps/SNAP in the past 12 months: 6,266
Women who had a birth in the past 12 months: 478 (244 now married, 229 unmarried) Women who did not have a birth in the past 12 months: 4,516 (1,586 now married, 2,941 unmarried)
Housing units in zip code 76541 with a mortgage: 770 (5 second mortgage, 6 both second mortgage and home equity loan) Median monthly owner costs for units with a mortgage: $1,086 Median monthly owner costs for units without a mortgage: $414
Residents with income below the poverty level in 2022:
This zip code:
22.4%
Whole state:
14.0%
Residents with income below 50% of the poverty level in 2022:
This zip code:
10.2%
Whole state:
7.4%
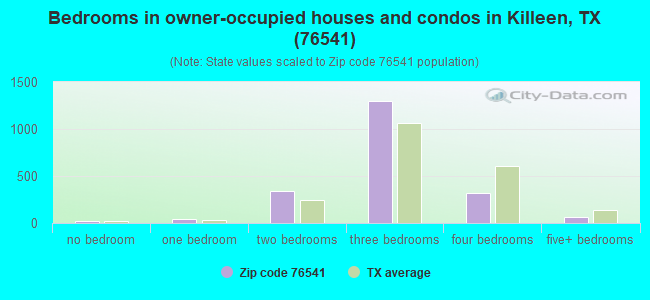
Median number of rooms in houses and condos:
Here:
5.3
State:
6.3
Median number of rooms in apartments:
Here:
3.3
State:
4.0
Notable locations in this zip code not listed on our city pages
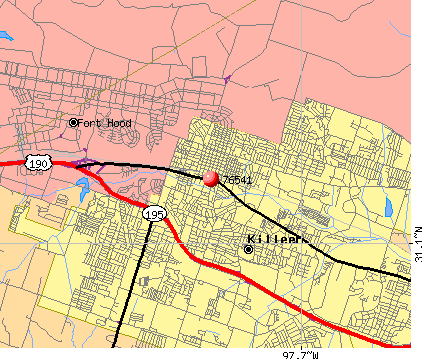
Notable locations in zip code 76541: Killeen Fire Department and Emergency Medical Services Central Station (A), Killeen Fire Department Station 1 (B). Display/hide their locations on the map
Churches in zip code 76541 include: Christ Gospel Apostolic Holiness Church (A), First Baptist Church of Killeen (B), First Baptist Church (C), Bethel Baptist Church (D), First Church of the Nazarene (E), Power House Church of God in Christ (F), Church of Christ (G), Skyline Baptist Church (H), Memorial Baptist Church (I). Display/hide their locations on the map
1,861 married couples with children.
1,875 single-parent households (134 men, 1,741 women).
67.4% of residents of 76541 zip code speak English at home.
27.5% of residents speak Spanish at home (68% very well, 15% well, 11% not well, 7% not at all).
2.1% of residents speak other Indo-European language at home (95% very well, 5% well).
2.9% of residents speak Asian or Pacific Island language at home (49% very well, 37% well, 14% not well).
0.3% of residents speak other language at home (90% very well, 10% well).
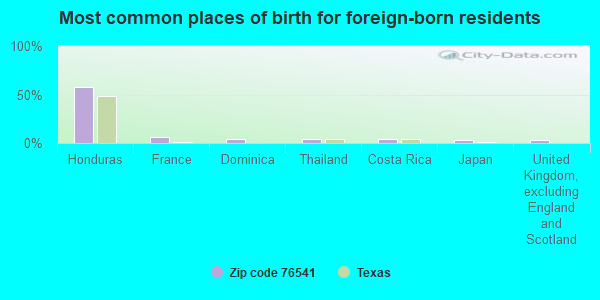
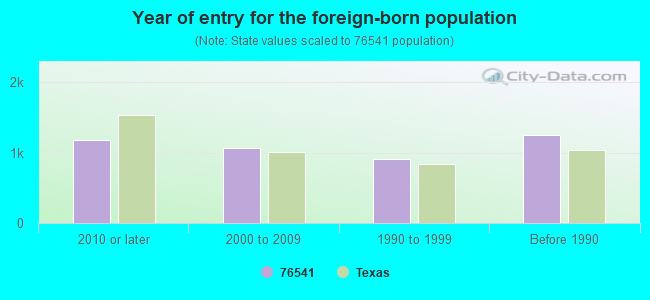
Foreign born population: 2,941 (15.2%) (42.8% of them are naturalized citizens)
Housing units lacking complete plumbing facilities: 3.3% Housing units lacking complete kitchen facilities: 4.9%
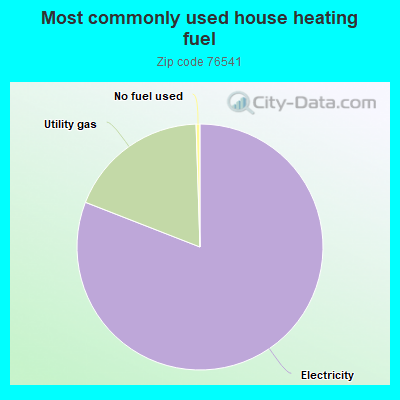
80.6%Electricity
18.5%Utility gas
0.5%No fuel used
Population in 1990: 22,853.
Place of birth for U.S.-born residents:
This state: 7,627
Northeast: 1,062
Midwest: 1,903
South: 2,736
West: 1,640
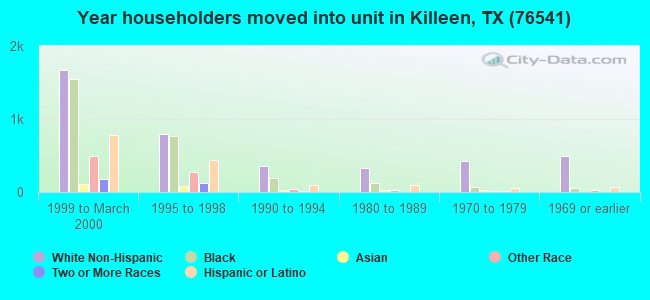
36% of the 76541 zip code residents lived in the same house 5 years ago. Out of people who lived in different houses, 34% lived in this county. Out of people who lived in different counties, 50% lived in Texas.
77% of the 76541 zip code residents lived in the same house 1 year ago. Out of people who lived in different houses, 51% moved from this county. Out of people who lived in different houses, 19% moved from different county within same state. Out of people who lived in different houses, 25% moved from different state. Out of people who lived in different houses, 3% moved from abroad.
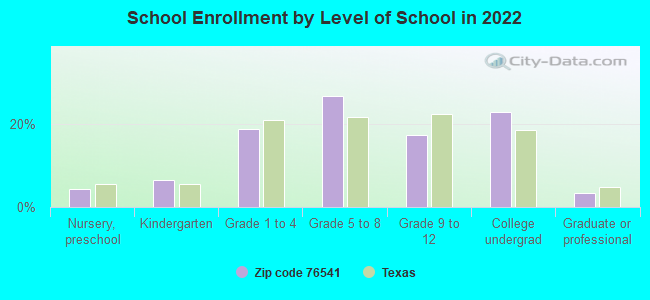
Private vs. public school enrollment:
Students in private schools in grades 1 to 8 (elementary and middle school): 88
Here:
4.7%
Texas:
8.8%
Students in private schools in grades 9 to 12 (high school): 32
Here:
4.5%
Texas:
8.0%
Students in private undergraduate colleges: 150
Here:
15.9%
Texas:
16.2%
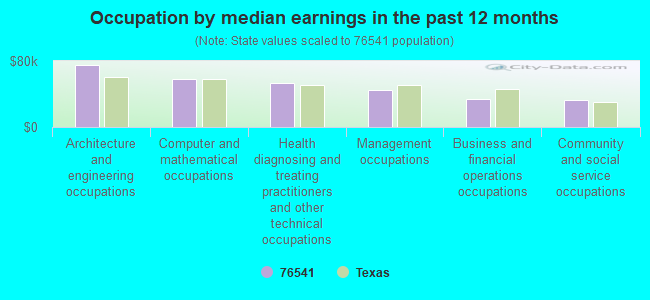
Occupation by median earnings in the past 12 months ($)
74,963Architecture and engineering occupations
57,893Computer and mathematical occupations
52,952Health diagnosing and treating practitioners and other technical occupations
44,393Management occupations
33,491Business and financial operations occupations
33,203Community and social service occupations
Companies with biggest federal contracts located in this zip code (KILLEEN, TX):
MANAGEMENT AND TRAINING CONSUL (1711 E CENTRAL TEXAS EXPR; small business) : $20,869,771 in 94 contractsfrom 2002 to 2006
Contracts for Other Administrative Support Services, Technical Representation Services -- Communication, Detection, and Coherent Radiation Equipment, Other Management Support Services, Other Professional Services, and moreby Army, Navy, U.S. Customs Service, Internal Revenue Service, and others Signed by year:2000: $0; 2001: $0; 2002: $261,912; 2003: $701,200; 2004: $4,149,933; 2005: $9,270,330; 2006: $6,486,396.
Biggest contracts:
$1,482,534 with Army for Other Administrative Support Services. Taking place in VA. Signed on 2006-06-23. Completion date: 2007-06-23.
$1,419,778, same as above.Signed on 2005-07-06. Completion date: 2006-06-24.
$1,419,778, same as above.Signed on 2005-09-13. Completion date: 2006-06-24.
$1,210,005, same as above.Signed on 2006-01-31. Completion date: 2007-01-31.
TERESA A. MCVICKER P.C. (406 PHYLLIS DRIVE; small business) : $1,351,673 in 12 contractsfrom 1999 to 2005
Contracts for Anesthesiology Services, Medical and Surgical Instruments, Equipment, and Supplies, Other Medical Services by Army Signed by year:2000: $144,560; 2001: $102,847; 2002: $153,920; 2003: $249,400; 2004: $565,115; 2005: -$4,969; 2006: $0.
Biggest contracts:
$594,852 with Army for Anesthesiology Services. Signed on 2004-10-07. Completion date: 2005-09-30.
$197,600, same as above.Signed on 2003-10-29. Completion date: 2002-09-30.
$153,920, same as above.Signed on 2002-10-24. Completion date: 2002-09-30.
$149,760, same as above.Signed on 2001-11-05. Completion date: 2002-09-30.
SOUTHWEST-TEX LEASING CO INC (1801 E VETERANS MEMORIAL) : $469,458 in 51 contractsfrom 2001 to 2006
Contracts for Lease or Rental of Equipment -- Ground Effect Vehicles, Motor Vehicles, Trailers, and Cycles, Motor Passenger Services by Army Signed by year:2000: $0; 2001: $63,166; 2002: $117,087; 2003: $100,606; 2004: $16,598; 2005: $167,784; 2006: $4,217.
Biggest contracts:
$64,150 with Army for Lease or Rental of Equipment -- Ground Effect Vehicles, Motor Vehicles, Trailers, and Cycles. Signed on 2003-11-21. Completion date: 2003-12-18.
$43,200, same as above.Signed on 2005-03-04. Completion date: 2005-03-07.
$37,920, same as above.Signed on 2005-09-12. Completion date: 2005-11-02.
$33,999, same as above.Signed on 2002-01-03. Completion date: 2002-03-05.
SOUTHWESTERN COACHES, INC (403 N 2ND ST; small business) : $348,088 in 15 contractsfrom 2000 to 2005
Contracts for Passenger Motor Charter Service, Lease or Rental of Equipment -- Ground Effect Vehicles, Motor Vehicles, Trailers, and Cycles, Motor Passenger Services by Army Signed by year:2000: $99,806; 2001: $121,393; 2002: $73,458; 2003: $36,920; 2004: $13,474; 2005: $3,037; 2006: $0.
Biggest contracts:
$121,393 with Army for Passenger Motor Charter Service. Signed on 2001-08-24. Completion date: 2002-08-31.
$99,806, same as above.Signed on 2000-09-25. Completion date: 2002-08-31.
$51,040 with Army for Lease or Rental of Equipment -- Ground Effect Vehicles, Motor Vehicles, Trailers, and Cycles. Signed on 2002-12-31. Completion date: 2003-01-03.
$17,618, same as above.Signed on 2002-08-19. Completion date: 2002-08-21.
HOWARD JOHNSON INN (803 EAST CENTRAL TX EXPWY) : $313,301 in 6 contractsfrom 2003 to 2005
Contracts for Lease or Rental of Facilities -- Troop Housing Facilities, Lodging - Hotel/Motel by Army Signed by year:2000: $0; 2001: $0; 2002: $0; 2003: $273,701; 2004: $0; 2005: $39,600; 2006: $0.
Biggest contracts:
$217,120 with Army for Lease or Rental of Facilities -- Troop Housing Facilities. Signed on 2003-10-22. Completion date: 2004-02-28.
$57,997 with Army for Lodging - Hotel/Motel. Signed on 2003-03-14. Completion date: 2003-03-29.
$39,600, same as above.Signed on 2005-07-22. Completion date: 2005-08-04.
$14,632, same as above.Signed on 2003-04-02. Completion date: 2003-04-24.
PLAZA HOTEL AND CONFERENCE CEN (1721 CENTRAL TX EXPWY) : $190,031 in 19 contractsfrom 2003 to 2006
Contracts for Lodging - Hotel/Motel, Other Education and Training Services by Army Signed by year:2000: $0; 2001: $0; 2002: $0; 2003: $155,421; 2004: $12,266; 2005: $6,846; 2006: $15,498.
Biggest contracts:
$82,352 with Army for Lodging - Hotel/Motel. Signed on 2003-06-11. Completion date: 2003-03-24.
$44,663, same as above.Signed on 2003-03-22. Completion date: 2003-04-26.
$35,400, same as above.Signed on 2004-02-18. Completion date: 2004-05-17.
$25,311, same as above.Signed on 2003-03-14. Completion date: 2003-03-24.
FAMILIES IN CRISIS INC (1305 E RANCIER AVE) : $102,455 in 56 contractsfrom 2001 to 2006
Contracts for Other Professional Services by Army Signed by year:2000: $0; 2001: $7,779; 2002: $28,010; 2003: $9,916; 2004: $10,799; 2005: $36,985; 2006: $8,966.
Biggest contracts:
$9,705 with Army for Other Professional Services. Signed on 2005-06-14. Completion date: 2005-03-31.
$8,349, same as above.Signed on 2006-03-21. Completion date: 2006-06-30.
$8,349, same as above.Signed on 2005-12-20. Completion date: 2006-03-31.
$8,349, same as above.Signed on 2006-07-10. Effective on 2006-07-01. Completion date: 2006-09-30.
CENTRAL TELEPHONE COMPANY OF T (603 N 8TH ST) : $95,237 in 7 contractsfrom 2002 to 2004
Contracts for ADP Telecommunications and Transmission Services, Advertising Services, Other Medical Services by Department of Defense, Army Signed by year:2000: $0; 2001: $0; 2002: $80,904; 2003: $4,259; 2004: $10,074; 2005: $0; 2006: $0.
Biggest contracts:
$47,899 with Department of Defense for ADP Telecommunications and Transmission Services. Signed on 2002-05-31. Completion date: 2001-09-05.
$28,746, same as above.Signed on 2002-05-31. Completion date: 2005-03-06.
$10,074 with Army for Advertising Services. Taking place in MO. Signed on 2004-03-11. Completion date: 2004-03-31.
$4,259 with Army for Other Medical Services. Taking place in MO. Signed on 2003-11-21. Completion date: 2004-09-30.
MCMASTER, TODD (711 W BRYCE AVE; small business) : $81,411 in 3 contractsfrom 2003 to 2004
$52,216 with Army for Maintenance, Repair and Rebuilding of Equipment -- Ground Effect Vehicles, Motor Vehicles, Trailers, and Cycles. Signed on 2003-11-28. Completion date: 2003-11-28.
$25,195 with Air Force for Maintenance, Repair and Rebuilding of Equipment -- Construction, Mining, Excavating, and Highway Maintenance Equipment. Signed on 2004-03-15. Completion date: 2004-04-30.
$4,000 with Army for Maintenance, Repair and Rebuilding of Equipment -- Ground Effect Vehicles, Motor Vehicles, Trailers, and Cycles. Signed on 2004-01-06. Completion date: 2003-11-28.
SYNCTECH SOLUTIONS LLC (331 E AVENUE D; small business)
$59,070 with Army for ADP Input/Output and Storage Devices. Signed on 2005-05-11. Completion date: 2005-06-06.
Top industries in this zip code by the number of employees in 2005:
2002 - 2018 National Fire Incident Reporting System (NFIRS) incidents
According to the data from the years 2002 - 2018 the average number of fire incidents per year is 103. The highest number of fires - 142 took place in 2018, and the least - 57 in 2009. The data has a growing trend.
When looking into fire subcategories, the most reports belonged to: Structure Fires (50.3%), and Outside Fires (31.0%).
Fire incident types reported to NFIRS in Zip Code 76541
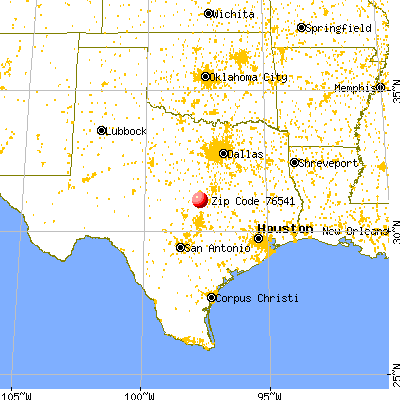


 Nearest zip codes: 76544, 76542, 76543, 76548, 76559, 76549.
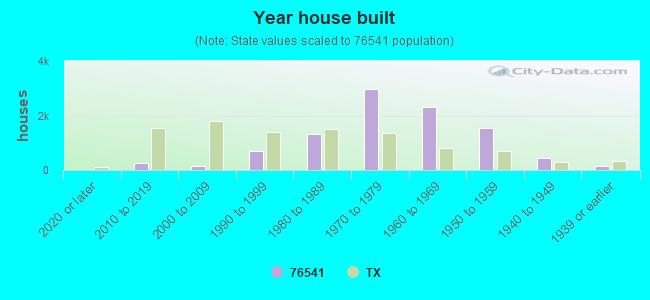


 : $20,869,771 in 94 contracts from 2002 to 2006

 According to the data from the years 2002 - 2018 the average number of fire incidents per year is 103. The highest number of fires - 142 took place in 2018, and the least - 57 in 2009. The data has a growing trend.
 When looking into fire subcategories, the most reports belonged to: Structure Fires (50.3%), and Outside Fires (31.0%).