Estimated zip code population in 2022: 1,872 Zip code population in 2010: 1,584 Zip code population in 2000: 1,657
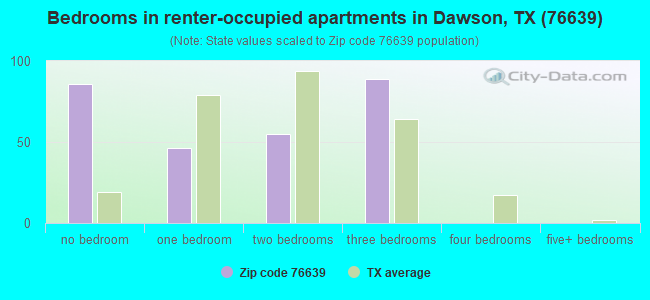
Houses and condos: 903 Renter-occupied apartments: 261
% of renters here:
36%
State:
38%
March 2022 cost of living index in zip code 76639: 78.7 (low, U.S. average is 100)
Land area: 91.9 sq. mi. Water area: 2.6 sq. mi.
Population density: 20 people per square mile
(very low).
OSM Map
General Map
Google Map
MSN Map
OSM Map
General Map
Google Map
MSN Map
OSM Map
General Map
Google Map
MSN Map
OSM Map
General Map
Google Map
MSN Map
Please wait while loading the map...
Real estate property taxes paid for housing units in 2022:
This zip code:
1.0% ($1,350)
Texas:
1.5% ($4,050)
Median real estate property taxes paid for housing units with mortgages in 2022: $2,145 (1.1%) Median real estate property taxes paid for housing units with no mortgage in 2022: $1,018 (0.8%)
Business Search- 14 Million verified businesses
Males: 974
(52.1%)
Females: 897
(47.9%)
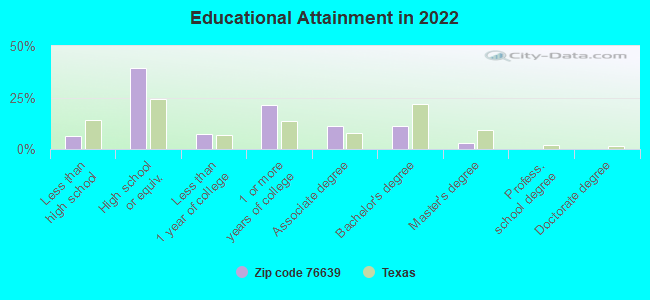
For population 25 years and over in 76639:
High school or higher: 92.3%
Bachelor's degree or higher: 14.5%
Graduate or professional degree: 3.4%
Unemployed: 4.8%
Mean travel time to work (commute): 33.0 minutes
For population 15 years and over in 76639:
Never married: 29.0%
Now married: 47.2%
Separated: 2.4%
Widowed: 9.3%
Divorced: 12.1%
Zip code 76639 compared to state average:
Median household income below state average.
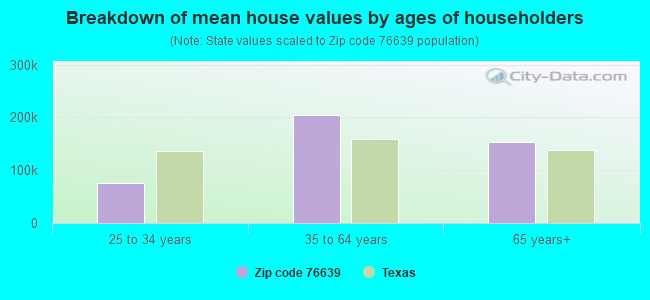
Median house value below state average.
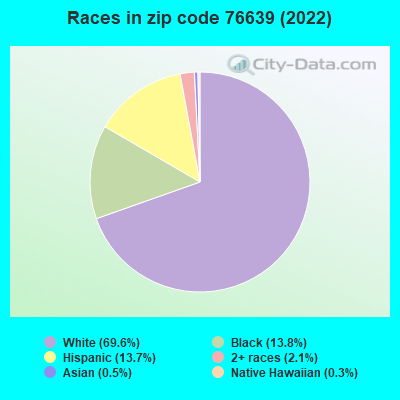
Hispanic race population percentage significantly below state average.
Median age above state average.
Foreign-born population percentage significantly below state average.
Length of stay since moving in significantly above state average.
Number of college students below state average.
Percentage of population with a bachelor's degree or higher significantly below state average.
Averages for the 2020 tax year for zip code 76639, filed in 2021:
Average Adjusted Gross Income (AGI) in 2020: $43,336 (Individual Income Tax Returns)
Here:
$43,336
State:
$77,054
Salary/wage: $40,340 (reported on 79.7% of returns)
Here:
$40,340
State:
$62,766
(% of AGI for various income ranges: 1247.7% for AGIs below $25k, 3328.8% for AGIs $25k-50k, 6081.4% for AGIs $50k-75k, 10183.3% for AGIs $75k-100k, 16177.5% for AGIs $100k-200k)
Taxable interest for individuals: $857 (reported on 20.3% of returns)
This zip code:
$857
Texas:
$2,665
(% of AGI for various income ranges: 5.9% for AGIs below $25k, 19.4% for AGIs $25k-50k, 14.3% for AGIs $50k-75k, 160.0% for AGIs $100k-200k)
Ordinary dividends: $2,800 (reported on 7.2% of returns)
Here:
$2,800
State:
$10,044
(% of AGI for various income ranges: 35.0% for AGIs below $25k, 90.0% for AGIs $50k-75k)
Net capital gain/loss in AGI: +$3,560 (reported on 7.2% of returns)
Here:
+$3,560
State:
+$39,590
(% of AGI for various income ranges: 17.3% for AGIs below $25k, 200.0% for AGIs $50k-75k)
Profit/loss from business: +$5,409 (reported on 15.9% of returns)
Here:
+$5,409
State:
+$10,888
(% of AGI for various income ranges: 181.8% for AGIs below $25k, 82.9% for AGIs $25k-50k, 77.1% for AGIs $50k-75k)
Taxable individual retirement arrangement distribution: $9,100 (reported on 5.8% of returns)
76639:
$9,100
Texas:
$24,740
(% of AGI for various income ranges: 214.1% for AGIs $25k-50k)
Earned income credit: $2,553 (reported on 24.6% of returns)
Here:
$2,553
State:
$2,584
(% of AGI for various income ranges: 124.1% for AGIs below $25k, 94.7% for AGIs $25k-50k)
Percentage of individuals using paid preparers for their 2020 taxes: 92.8%
Here:
93%
State:
92%
(% for various income ranges: 93.1% for AGIs below $25k, 95.0% for AGIs $25k-50k, 88.9% for AGIs $50k-75k, 100.0% for AGIs $75k-100k, 85.7% for AGIs $100k-200k)
Averages for the 2012 tax year for zip code 76639, filed in 2013:
Average Adjusted Gross Income (AGI) in 2012: $39,123 (Individual Income Tax Returns)
Here:
$39,123
State:
$65,384
Salary/wage: $35,222 (reported on 80.7% of returns)
Here:
$35,222
State:
$52,524
(% of AGI for various income ranges: 77.1% for AGIs below $25k, 75.3% for AGIs $25k-50k, 72.2% for AGIs $50k-75k, 79.1% for AGIs $75k-100k, 62.8% for AGIs $100k-200k)
Taxable interest for individuals: $779 (reported on 24.6% of returns)
This zip code:
$779
Texas:
$2,372
(% of AGI for various income ranges: 0.6% for AGIs below $25k, 0.7% for AGIs $25k-50k, 0.7% for AGIs $50k-75k, 0.4% for AGIs $100k-200k)
Ordinary dividends: $1,725 (reported on 7.0% of returns)
Here:
$1,725
State:
$9,721
Net capital gain/loss in AGI: +$3,900 (reported on 8.8% of returns)
Here:
+$3,900
State:
+$35,319
Profit/loss from business: +$7,610 (reported on 17.5% of returns)
Here:
+$7,610
State:
+$13,732
(% of AGI for various income ranges: 8.2% for AGIs below $25k, 5.1% for AGIs $25k-50k, 4.2% for AGIs $50k-75k)
Taxable individual retirement arrangement distribution: $9,000 (reported on 8.8% of returns)
76639:
$9,000
Texas:
$19,511
Total itemized deductions: $18,886 (26% of AGI, reported on 12.3% of returns)
Here:
$18,886
State:
$24,724
Here:
25.8% of AGI
State:
15.9% of AGI
(% of AGI for various income ranges: 8.7% for AGIs below $25k, 8.3% for AGIs $50k-75k, 17.2% for AGIs $75k-100k)
Charity contributions: $4,000 (reported on 7.0% of returns)
Here:
$4,000
State:
$6,808
Taxes paid: $4,517 (reported on 10.5% of returns)
76639:
$4,517
State:
$6,921
Earned income credit: $2,281 (reported on 28.1% of returns)
Here:
$2,281
State:
$2,570
(% of AGI for various income ranges: 8.1% for AGIs below $25k, 1.6% for AGIs $25k-50k)
Percentage of individuals using paid preparers for their 2012 taxes: 52.6%
Here:
53%
State:
51%
(% for various income ranges: 50.0% for AGIs below $25k, 46.7% for AGIs $25k-50k, 62.5% for AGIs $50k-75k, 50.0% for AGIs $75k-100k, 75.0% for AGIs $100k-200k)
Averages for the 2004 tax year for zip code 76639, filed in 2005:
Average Adjusted Gross Income (AGI) in 2004: $29,440 (Individual Income Tax Returns)
Here:
$29,440
State:
$47,881
Salary/wage: $29,294 (reported on 81.2% of returns)
Here:
$29,294
State:
$41,947
(% of AGI for various income ranges: 144.0% for AGIs below $10k, 75.9% for AGIs $10k-25k, 84.3% for AGIs $25k-50k, 76.6% for AGIs $50k-75k, 80.5% for AGIs $75k-100k, 73.6% for AGIs over 100k)
Taxable interest for individuals: $1,383 (reported on 29.7% of returns)
This zip code:
$1,383
Texas:
$2,255
(% of AGI for various income ranges: 3.2% for AGIs below $10k, 2.5% for AGIs $10k-25k, 0.8% for AGIs $25k-50k, 1.6% for AGIs $50k-75k, 1.4% for AGIs $75k-100k, 0.3% for AGIs over 100k)
Taxable dividends: $889 (reported on 8.9% of returns)
Here:
$889
State:
$4,261
(% of AGI for various income ranges: 0.8% for AGIs $10k-25k, 0.1% for AGIs $25k-50k, 0.2% for AGIs $50k-75k, 0.4% for AGIs $75k-100k)
Net capital gain/loss: +$409 (reported on 7.2% of returns)
Here:
+$409
State:
+$16,110
Profit/loss from business: +$5,052 (reported on 16.0% of returns)
Here:
+$5,052
State:
+$11,013
(% of AGI for various income ranges: 20.4% for AGIs below $10k, 5.9% for AGIs $10k-25k, 3.1% for AGIs $25k-50k, 1.0% for AGIs $50k-75k)
Total itemized deductions: $16,333 (31% of AGI, reported on 11.4% of returns)
Here:
$16,333
State:
$19,631
Here:
30.7% of AGI
State:
18.9% of AGI
(% of AGI for various income ranges: 7.6% for AGIs $10k-25k, 5.5% for AGIs $25k-50k, 5.8% for AGIs $50k-75k, 12.1% for AGIs $75k-100k)
Charity contributions deductions: $3,225 (6% of AGI, reported on 6.6% of returns)
Here:
$3,225
State:
$4,753
Here:
6.1% of AGI
State:
4.2% of AGI
(% of AGI for various income ranges: 1.1% for AGIs $10k-25k, 1.2% for AGIs $50k-75k, 1.6% for AGIs $75k-100k)
Total tax: $3,558 (reported on 66.4% of returns)
76639:
$3,558
State:
$9,058
(% of AGI for various income ranges: 4.1% for AGIs below $10k, 3.2% for AGIs $10k-25k, 6.8% for AGIs $25k-50k, 9.0% for AGIs $50k-75k, 11.1% for AGIs $75k-100k, 15.2% for AGIs over 100k)
Earned income credit: $1,949 (reported on 26.0% of returns)
Here:
$1,949
State:
$2,024
Percentage of individuals using paid preparers for their 2004 taxes: 62.9%
Here:
63%
State:
57%
(% for various income ranges: 54.1% for AGIs below $10k, 66.3% for AGIs $10k-25k, 68.8% for AGIs $25k-50k, 62.5% for AGIs $50k-75k, 46.9% for AGIs $75k-100k, 84.6% for AGIs over 100k)
Household received Food Stamps/SNAP in the past 12 months: 172 Household did not receive Food Stamps/SNAP in the past 12 months: 563
Women who had a birth in the past 12 months: 9 (3 now married, 5 unmarried) Women who did not have a birth in the past 12 months: 379 (152 now married, 227 unmarried)
Housing units in zip code 76639 with a mortgage: 202 Median monthly owner costs for units with a mortgage: $1,425 Median monthly owner costs for units without a mortgage: $473
Residents with income below the poverty level in 2022:
This zip code:
12.8%
Whole state:
14.0%
Residents with income below 50% of the poverty level in 2022:
This zip code:
7.0%
Whole state:
7.4%
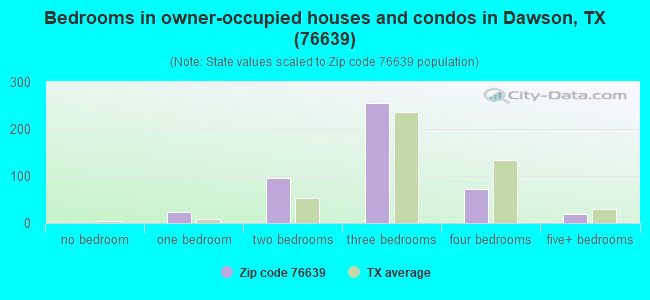
Median number of rooms in houses and condos:
Here:
5.8
State:
6.3
Median number of rooms in apartments:
Here:
3.9
State:
4.0
Notable locations in this zip code not listed on our city pages
Notable locations in zip code 76639: Union High (A), Sherman Public Library (B), Dawson Volunteer Fire Department (C), Union High Volunteer Fire Department (D). Display/hide their locations on the map
Reservoirs: Navarro Mills Lake (A), Lake Dawson (B), Soil Conservation Service Site 15 Reservoir (C), Soil Conservation Service Site 14a Reservoir (D), Soil Conservation Service Site 14 Reservoir (E), Soil Conservation Service Site 31 Reservoir (F), Soil Conservation Service Site 26a Reservoir (G), Soil Conservation Service Site 107a Reservoir (H). Display/hide their locations on the map
Size of family households: 172 2-persons, 49 3-persons, 139 4-persons, 13 5-persons, 15 6-persons, 18 7-or-more-persons
Size of nonfamily households: 298 1-person, 4 2-persons, 20 3-persons
173 married couples with children.
160 single-parent households (160 women).
94.3% of residents of 76639 zip code speak English at home.
5.2% of residents speak Spanish at home (68% very well, 27% well, 5% not well).
0.2% of residents speak other Indo-European language at home (50% very well, 50% well).
0.2% of residents speak Asian or Pacific Island language at home (100% well).
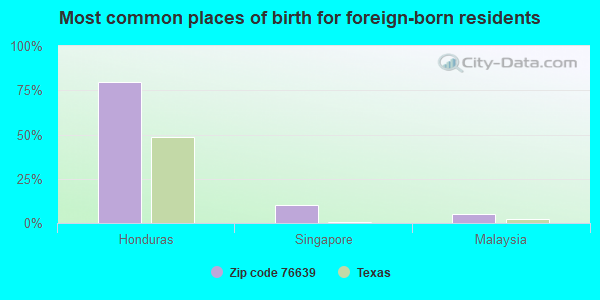
Foreign born population: 57 (3.0%) (9.7% of them are naturalized citizens)
This zip code:
3.0%
Whole state:
17.2%
80%Honduras
10%Singapore
5%Malaysia
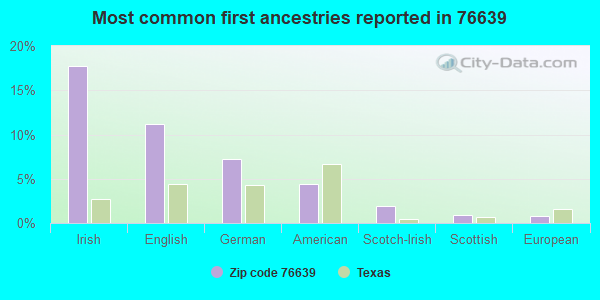
18%Irish
11%English
7%German
4%American
2%Scotch-Irish
1%Scottish
1%European
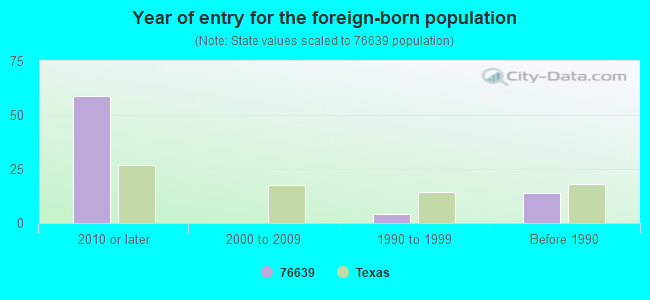
Year of entry for the foreign-born population
592010 or later
02000 to 2009
41990 to 1999
14Before 1990
Housing units lacking complete plumbing facilities: 11.0% Housing units lacking complete kitchen facilities: 13.9%
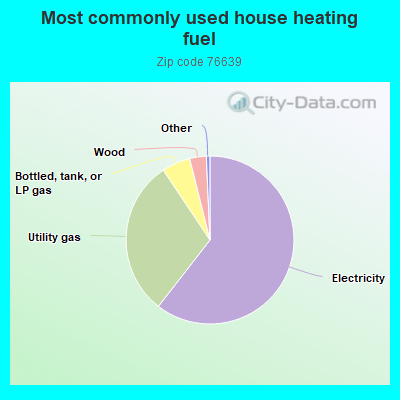
60.7%Electricity
30.2%Utility gas
5.5%Bottled, tank, or LP gas
3.2%Wood
Population in 1990: 1,457. Population change in the 1990s: +200 (+13.7%).
Place of birth for U.S.-born residents:
This state: 1,484
Northeast: 40
Midwest: 77
South: 92
West: 93
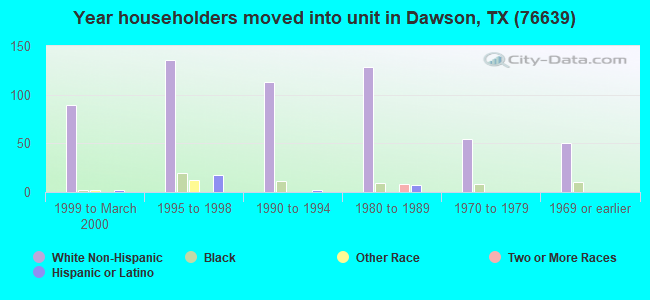
64% of the 76639 zip code residents lived in the same house 5 years ago. Out of people who lived in different houses, 49% lived in this county. Out of people who lived in different counties, 50% lived in Texas.
89% of the 76639 zip code residents lived in the same house 1 year ago. Out of people who lived in different houses, 40% moved from this county. Out of people who lived in different houses, 22% moved from different county within same state. Out of people who lived in different houses, 21% moved from different state. Out of people who lived in different houses, 19% moved from abroad.
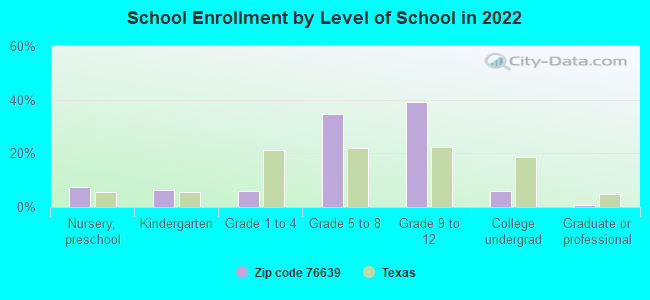
Private vs. public school enrollment:
Students in private schools in grades 1 to 8 (elementary and middle school):
Here:
0.0%
Texas:
8.8%
Students in private schools in grades 9 to 12 (high school): 1
Here:
0.6%
Texas:
8.0%
Students in private undergraduate colleges: 6
Here:
23.9%
Texas:
16.2%
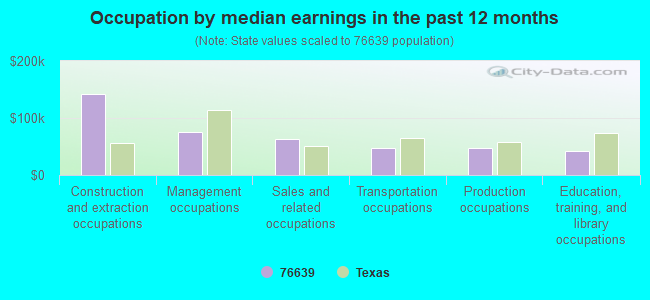
Occupation by median earnings in the past 12 months ($)
142,086Construction and extraction occupations
74,638Management occupations
63,158Sales and related occupations
48,194Transportation occupations
46,495Production occupations
42,440Education, training, and library occupations
Companies with federal contracts located in this zip code:
MCCOY, BRIANA K (203 N WACO STREET in DAWSON, TX; small business) : $164,952 in 5 contractsfrom 2003 to 2006
Contracts for Custodial Janitorial Services by Army, U.S. Army Corps of Engineers - civil program financing only Signed by year:2000: $0; 2001: $0; 2002: $0; 2003: $75,335; 2004: $81,462; 2005: $0; 2006: $8,155.
Biggest contracts:
$81,462 with Army for Custodial Janitorial Services. Signed on 2004-01-22. Completion date: 2004-09-30.
$72,649 with U.S. Army Corps of Engineers - civil program financing only for Custodial Janitorial Services. Signed on 2003-05-06. Completion date: 2003-09-30.
$8,155 with Army for Custodial Janitorial Services. Signed on 2006-01-25. Completion date: 2006-09-30.
$2,686, same as above.Signed on 2003-12-12. Completion date: 2004-09-30.
ALBERT HAGMAN JR (ROUTE 1 BOX 125 in DAWSON, TX; small business) : $18,600 in 2 contractsin 2004
$9,300 with Army for Recreation Site Maintenance Services (non-construction). Signed on 2004-10-01. Completion date: 2005-09-30.
$9,300 with U.S. Army Corps of Engineers - civil program financing only for Recreation Site Maintenance Services (non-construction). Signed on 2004-10-01. Completion date: 2005-09-30.
PRYOR,THOMAS (205 S 1ST W in DAWSON, TX; small business) : $14,360 in 2 contractsin 2004
$7,180 with Army for Landscaping/Groundskeeping Services. Signed on 2004-10-07. Completion date: 2005-09-30.
$7,180 with U.S. Army Corps of Engineers - civil program financing only for Landscaping/Groundskeeping Services. Signed on 2004-10-07. Completion date: 2005-09-30.
Top industries in this zip code by the number of employees in 2005:
Finance and Insurance: Commercial Banking (10-19 employees: 1 establishment)
Other Services (except Public Administration): Religious Organizations (5-9: 1, 1-4: 1)
Administrative and Support and Waste Management and Remediation Services: Carpet and Upholstery Cleaning Services (5-9: 1)
Professional, Scientific, and Technical Services: Other Accounting Services (1-4: 2)
Administrative and Support and Waste Management and Remediation Services: Janitorial Services (1-4: 1)
Other Services (except Public Administration): All Other Personal Services (1-4: 1)
Fatal accident statistics in 2014:
Fatal accident count: 2
Vehicles involved in fatal accidents: 2
Fatal accidents caused by drunken drivers: 1
Fatalities: 2
Persons involved in fatal accidents: 4
Pedestrians involved in fatal accidents: 0
Fatal accident statistics in 2012:
Fatal accident count: 2
Vehicles involved in fatal accidents: 4
Fatal accidents caused by drunken drivers: 0
Fatalities: 2
Persons involved in fatal accidents: 10
Pedestrians involved in fatal accidents: 0
2005 - 2018 National Fire Incident Reporting System (NFIRS) incidents
According to the data from the years 2005 - 2018 the average number of fire incidents per year is 10. The highest number of reported fire incidents - 27 took place in 2005, and the least - 0 in 2012. The data has a decreasing trend.
When looking into fire subcategories, the most incidents belonged to: Outside Fires (55.1%), and Structure Fires (34.0%).
Fire incident types reported to NFIRS in Zip Code 76639

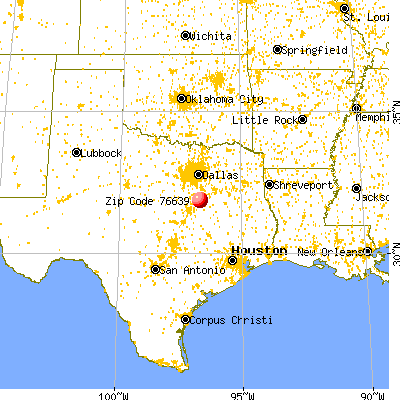


 Nearest zip codes: 76679, 76686, 76635, 76648, 75102, 76681.


 : $164,952 in 5 contracts from 2003 to 2006
 According to the data from the years 2005 - 2018 the average number of fire incidents per year is 10. The highest number of reported fire incidents - 27 took place in 2005, and the least - 0 in 2012. The data has a decreasing trend.
 When looking into fire subcategories, the most incidents belonged to: Outside Fires (55.1%), and Structure Fires (34.0%).